A newer version of this visualization is available.
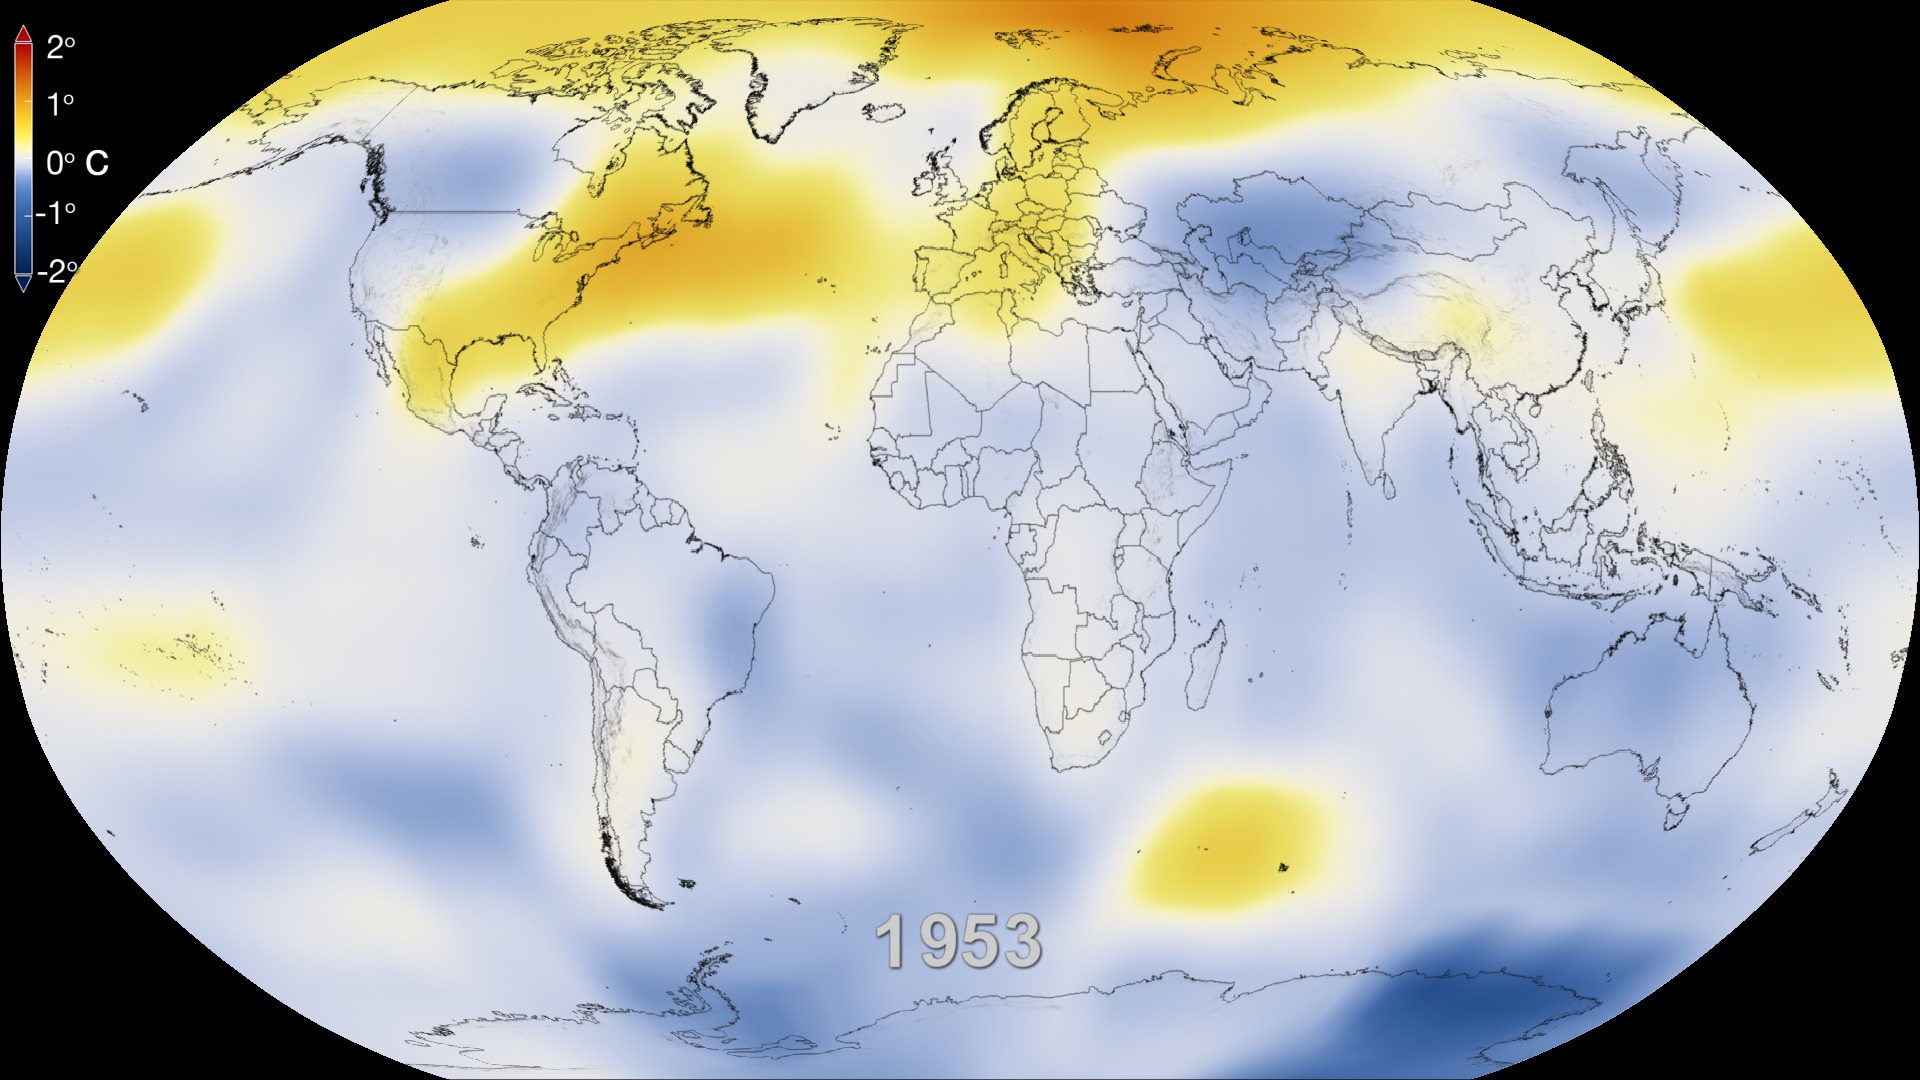
Global Temperature Anomalies from 1880 to 2023
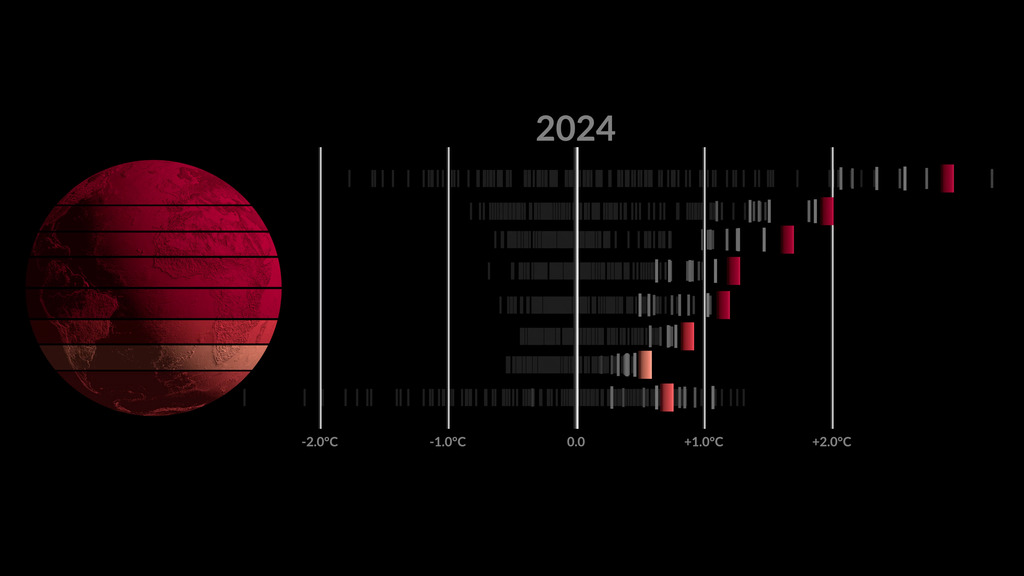
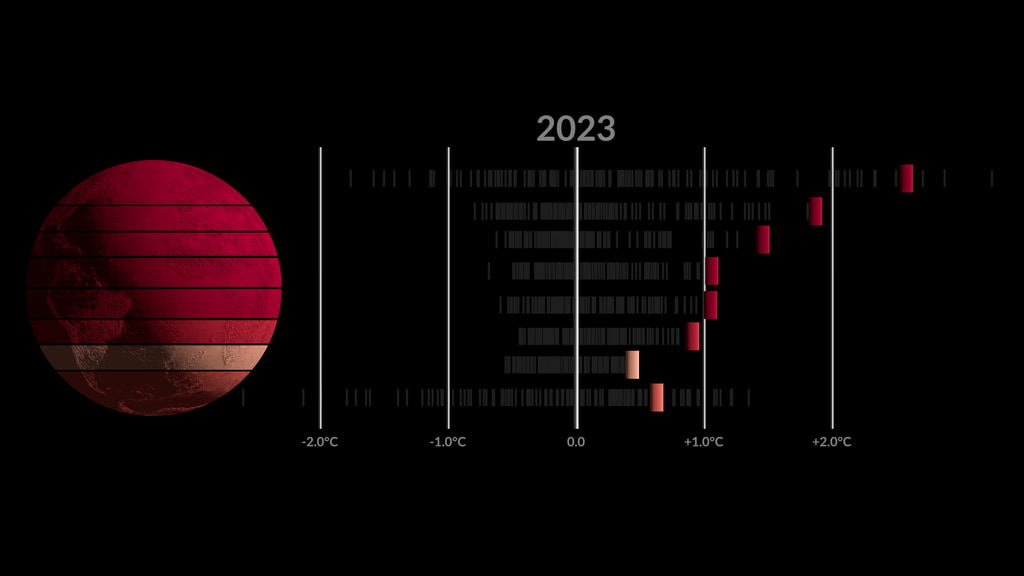
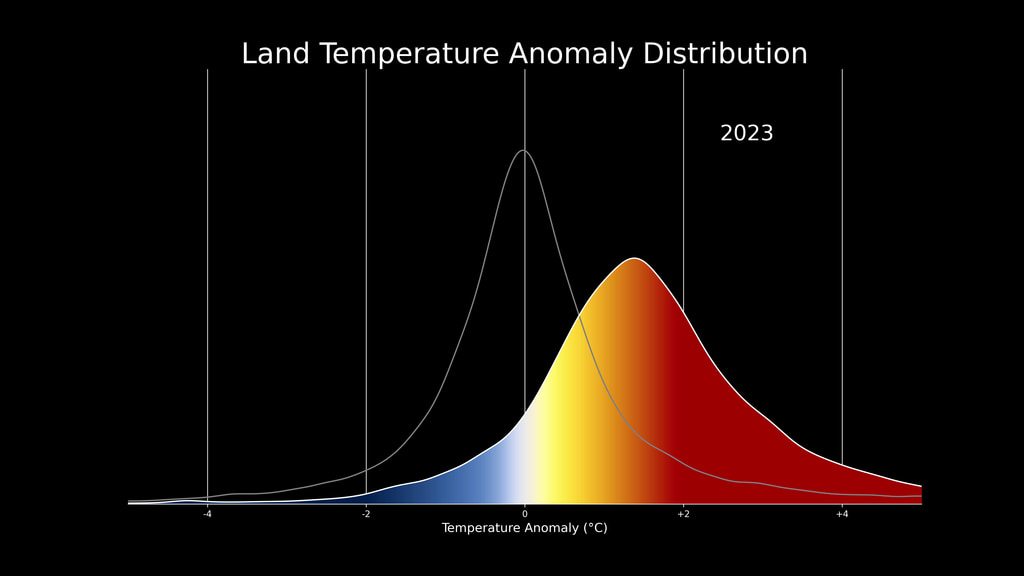
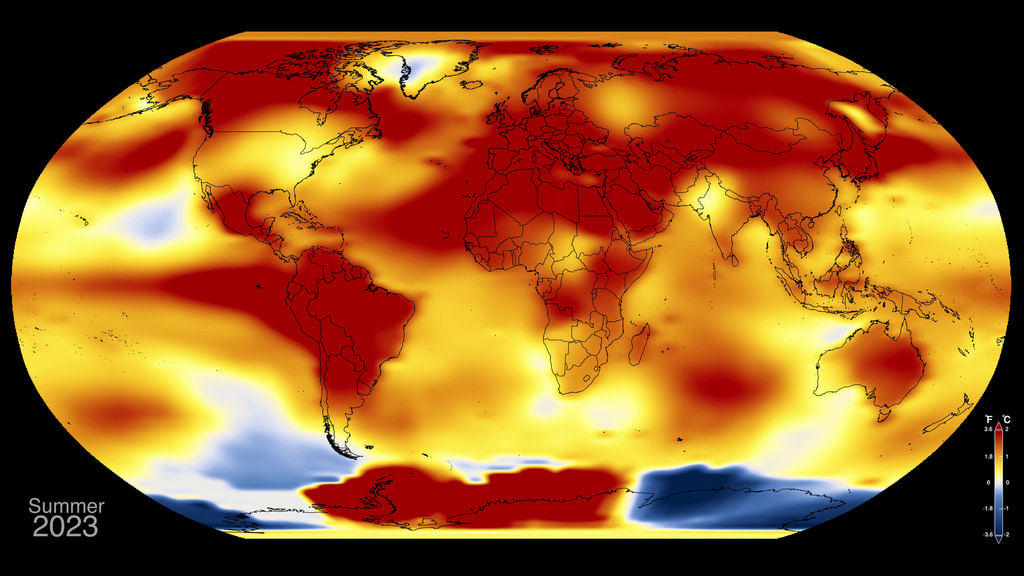
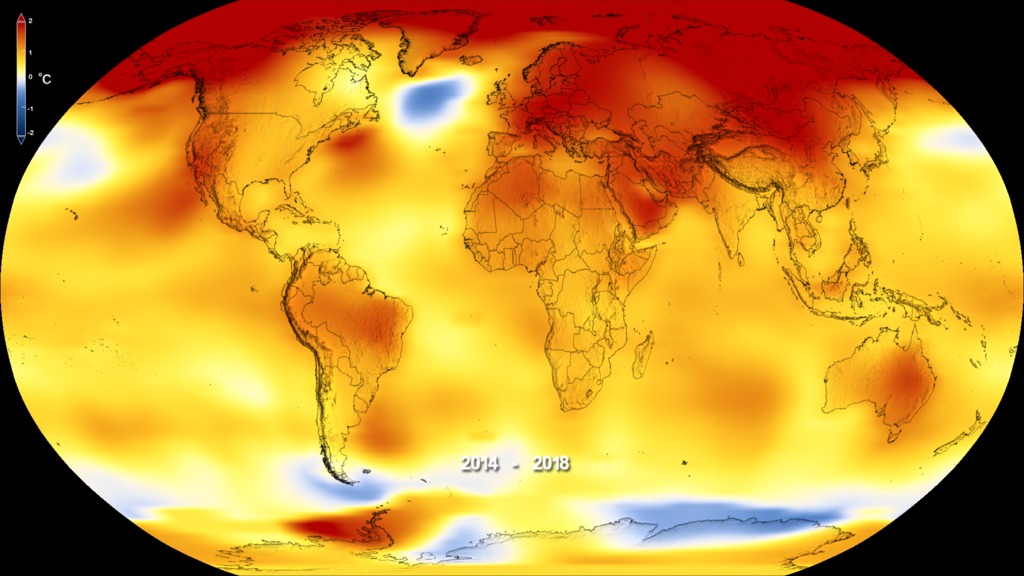
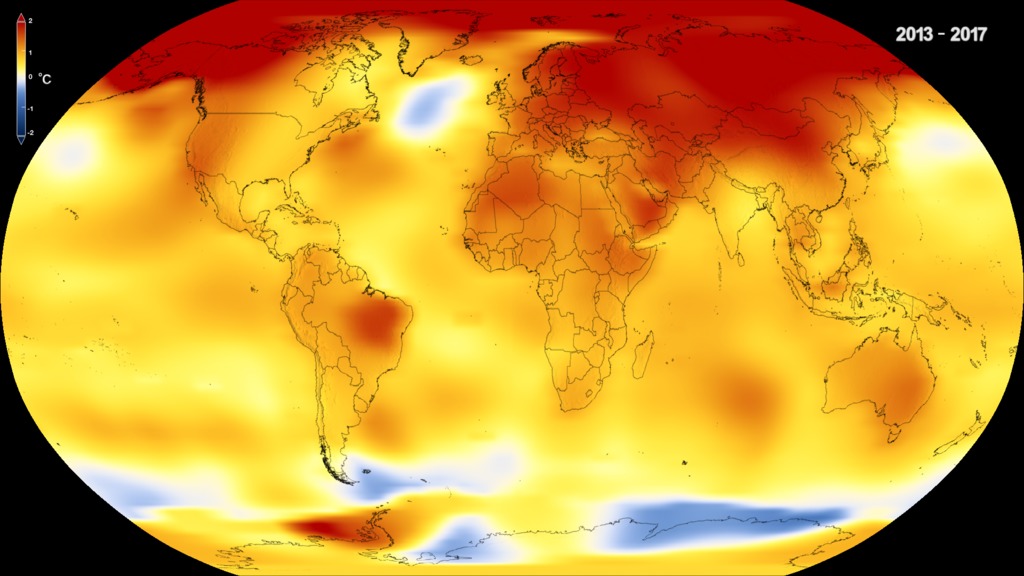
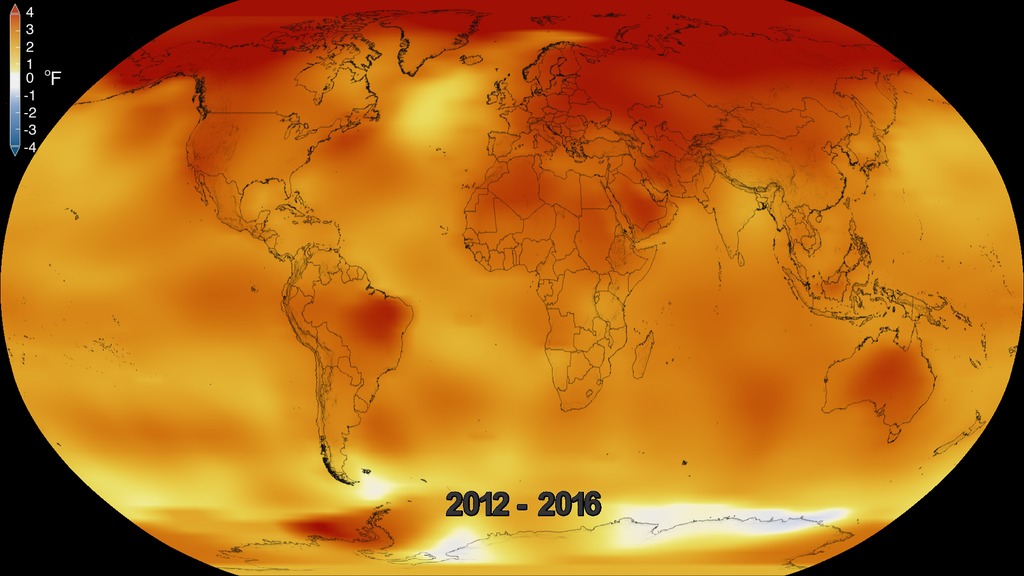
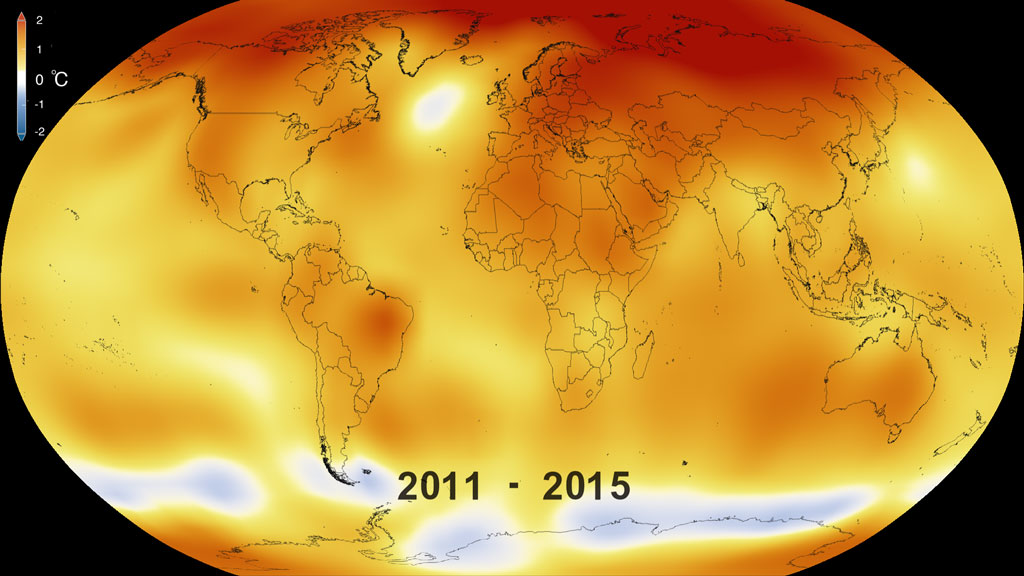
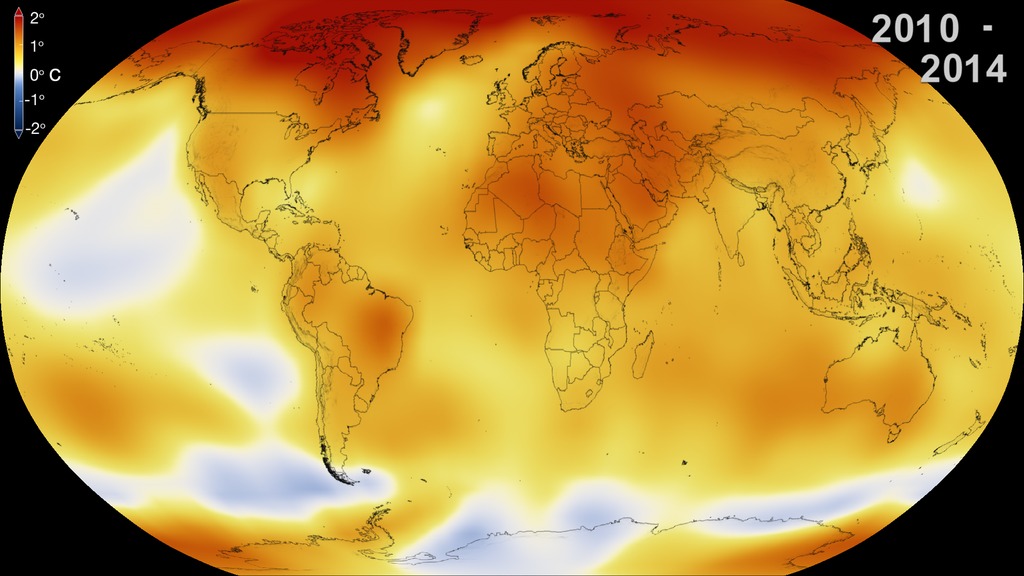
This color-coded map in Robinson projection displays a progression of changing global surface temperature anomalies. Normal temperatures are shown in white. Higher than normal temperatures are shown in red and lower than normal temperatures are shown in blue. Normal temperatures are calculated over the 30 year baseline period 1951-1980. The maps are averages over a running 24 month window. The final frame represents global temperature anomalies in 2023.
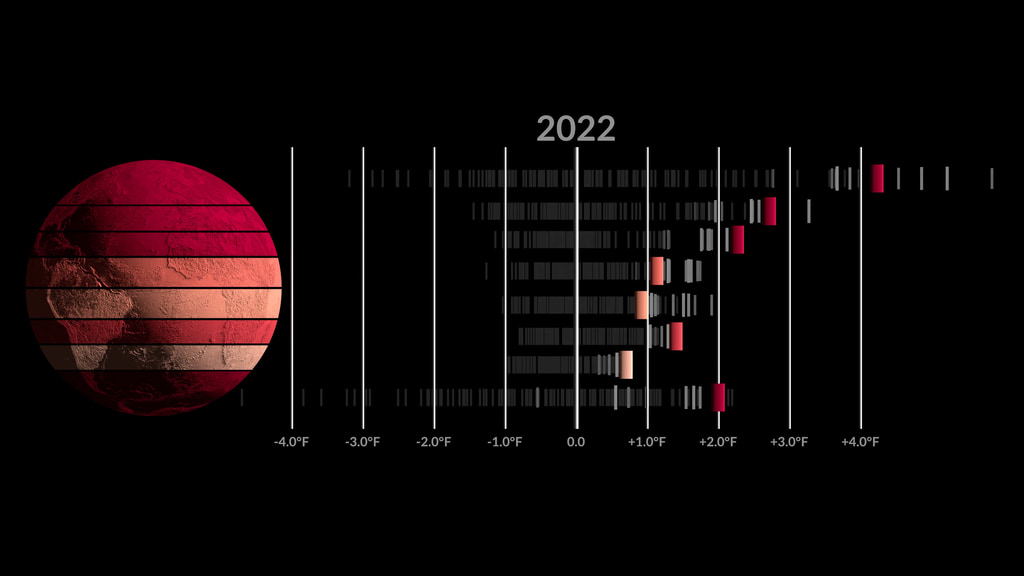
Earth's average surface temperature in 2023 was the warmest on record, according to an analysis by NASA. Global temperatures in 2023 were around 2 degrees Fahrenheit (1.1 degrees Celsius) above the average for NASA's baseline period (1951-1980), scientists from NASA's Goddard Institute for Space Studies (GISS) in New York reported.
In 2023, hundreds of millions of people around the world experienced extreme heat, and each month from June through December set a global record for the respective month. July was the hottest month ever recorded. Overall, Earth was about 2.45 degrees Fahrenheit (or about 1.36 degrees Celsius) warmer in 2023 than the late 19th-century average, when modern record-keeping began.
“The exceptional warming that we’re experiencing is not something we’ve seen before as a species,” said Gavin Schmidt, director of GISS. “It’s driven primarily by our fossil fuel emissions, and we're seeing the impacts in heat waves, intense rainfall, and coastal flooding.”
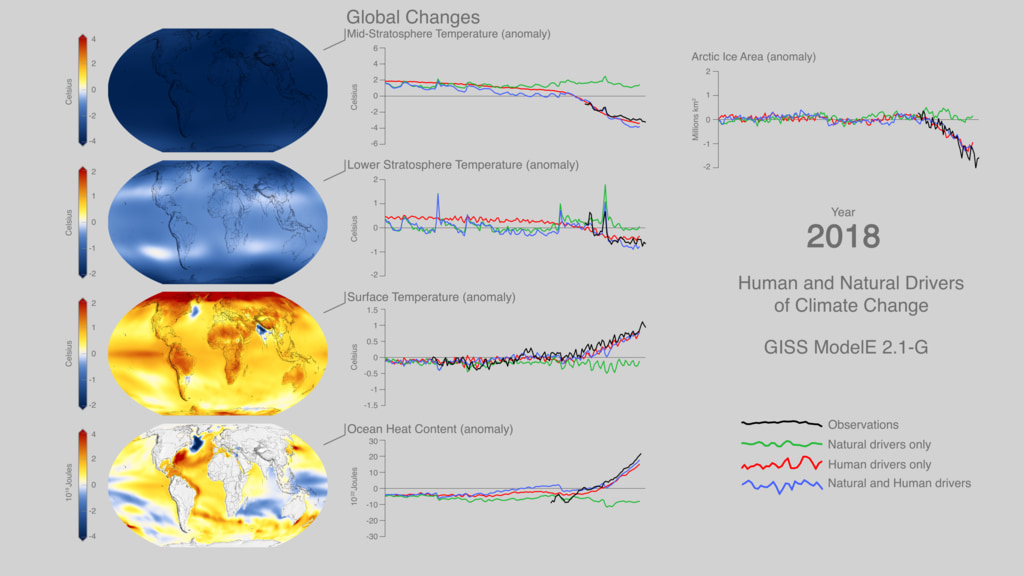
Though scientists have conclusive evidence that the planet’s long-term warming trend is driven by human activitiy, they still examine other events that can effect yearly or multi-year changes in climate such as El Nino, aerosols and pollution, and volcanic eruptions.
NASA's full dataset of global surface temperatures as well as full details with code of how NASA scientists conducted the analysis, are publicly available from GISS.
GISS is a NASA laboratory managed by the Earth Sciences Division of the agency's Goddard Space Flight Center in Greenbelt, Maryland. The laboratory is affiliated with Columbia University's Earth Institute and School of Engineering and Applied Science in New York.
For more information about NASA's Earth science programs, visit:
https://www.nasa.gov/earth
This visualizarion is in an equirectangular projection optimised for spherical displays such as Science On a Sphere. This color-coded map displays a progression of changing global surface temperature anomalies. Normal temperatures are shown in white. Higher than normal temperatures are shown in red and lower than normal temperatures are shown in blue. Normal temperatures are calculated over the 30 year baseline period 1951-1980. The maps are averages over a running 24 month window. The final frame represents global temperature anomalies in 2023.
The file time.txt is a label file containing the animation time for each frame number
This color-coded map in Orthographic projection displays a progression of changing global surface temperature anomalies. Normal temperatures are shown in white. Higher than normal temperatures are shown in red and lower than normal temperatures are shown in blue. Normal temperatures are calculated over the 30 year baseline period 1951-1980. The maps are averages over a running 24 month window. The final frame represents global temperature anomalies in 2023.

Colortable in both degrees Fahrenheit and degrees Celsius.
Credits
Please give credit for this item to:
NASA's Scientific Visualization Studio
Data provided by Robert B. Schmunk (NASA/GSFC GISS)
-
Scientists
-
Gavin A. Schmidt
(NASA/GSFC GISS)

-
Robert B Schmunk
(SIGMA Space Partners, LLC.)
-
Reto A. Ruedy
(SIGMA Space Partners, LLC.)
-
Gavin A. Schmidt
(NASA/GSFC GISS)
-
Public affairs officer
-
Peter H. Jacobs
(NASA/GSFC)
-
Peter H. Jacobs
(NASA/GSFC)
-
Producer
- Kathleen Gaeta (Advocates in Manpower Management, Inc.)
-
Visualizer
-
Mark SubbaRao
(NASA/GSFC)
-
Mark SubbaRao
(NASA/GSFC)
-
Writers
- Sally Younger (NASA/JPL)
- Jenny Marder Fadoul (Telophase)
Series
This page can be found in the following series:Datasets used
-
GISTEMP [GISS Surface Temperature Analysis (GISTEMP)]
ID: 585The GISS Surface Temperature Analysis version 4 (GISTEMP v4) is an estimate of global surface temperature change. Graphs and tables are updated around the middle of every month using current data files from NOAA GHCN v4 (meteorological stations) and ERSST v5 (ocean areas), combined as described in our publications Hansen et al. (2010), Lenssen et al. (2019), and Lenssen et al. (2024).
Credit: Lenssen, N., G.A. Schmidt, M. Hendrickson, P. Jacobs, M. Menne, and R. Ruedy, 2024: A GISTEMPv4 observational uncertainty ensemble. J. Geophys. Res. Atmos., 129, no. 17, e2023JD040179, doi:10.1029/2023JD040179.
This dataset can be found at: https://data.giss.nasa.gov/gistemp/
See all pages that use this dataset
Note: While we identify the data sets used on this page, we do not store any further details, nor the data sets themselves on our site.
Related
- ID: 5376
 Visualization
 - ID: 5451
 Visualization
 - ID: 5452
- ID: 5383
 Visualization
 - ID: 5311

- ID: 5327

- ID: 5208
 Visualization
 - ID: 5209
 Visualization
 - ID: 5211
- ID: 5191
 Visualization
 - ID: 5161
 Visualization
 - ID: 5137
 Visualization
 - ID: 5065
- ID: 14327
- ID: 5057
 Visualization
 - ID: 5059
 Visualization
 - ID: 14273
 Produced Video
 - ID: 4978
 Visualization
 - ID: 4975
 Visualization
 - ID: 14069
- ID: 4961
 Visualization
 - ID: 4908
 Visualization
 - ID: 4891
- ID: 13791
 Produced Video
Newer Versions
- ID: 5450
 Visualization
Older Versions
- ID: 5060
 Visualization
 - ID: 4964
 Visualization
 - ID: 4882
 Visualization
 - ID: 4626
 Visualization
 - ID: 4609
 Visualization
 - ID: 4546
 Visualization
 - ID: 4419
 Visualization
 - ID: 4252
 Visualization
 - ID: 4135
 Visualization
 - ID: 4030
 Visualization
 - ID: 3901
- ID: 3375
Used as a Source In
- ID: 14713
 Produced Video
 - ID: 14066
![Universal Production Music: Knock and Wait (Instrumental) by Brice Davoli [SACEM], Well That’s Difference (Instrumental) by Jeff Cardoni [ASCAP], Wanna Be Hipster (Instrumental) by Jeff Cardoni [ASCAP], Curiosity Killed Kitty (Instrumental) by Robert Leslie Bennett [ASCAP], Eco Issues (Instrumental) by Max van Thun [GEMA] Additional Footage: Pond5.com, CSPANComplete transcript available.](/vis/a010000/a014000/a014066/Title.jpg) Produced Video
Produced Video - ID: 31168
 Hyperwall Visual
 - ID: 13979
![Music: Futurity by Lee Groves [PRS] and Peter George Marett [PRS]Complete transcript available.](/vis/a010000/a013900/a013979/Screen_Shot_2021-10-28_at_2.29.18_PM.png)
- ID: 13909
 Produced Video
 - ID: 13814
 Produced Video
 - ID: 13799
![Music: Organic Machine by Bernhard Hering [GEMA] and Matthias Kruger [GEMA]Complete transcript available.](/vis/a010000/a013700/a013799/2020Temp.png) Produced Video
Produced Video - ID: 13781
![Music: A Curious Incident by Jay Price [PRS] and Paul Reeves [PRS]Complete transcript available.](/vis/a010000/a013700/a013781/CO20.jpg)
- ID: 13747
![Music: Rain over the Sea by Bruno Vouillon [SACEM]Complete transcript available.](/vis/a010000/a013700/a013747/Thumbnail0.jpg) Produced Video
Produced Video - ID: 13652
![Music: "Solar Winds" by Ben Niblett [PRS] and Jon Cotton [PRS] courtesy of Universal Production Music.
Complete transcript available.](/vis/a010000/a013600/a013652/BushFire_Still_2.jpg) Produced Video
Produced Video - ID: 13516
![Music: Avalanches by Chris Constantinou [PRS] and Paul Frazer [PRS]Complete transcript available.](/vis/a010000/a013500/a013516/2019Temp.png) Produced Video
Produced Video - ID: 13309
![Music: Hiraeth by Anthony Edwin Phillips [PRS], James Edward CollinsComplete transcript available.](/vis/a010000/a013300/a013309/Arctic_Min_2019_Thumbnail_LKW.png) Produced Video
Produced Video - ID: 13281
![Music: Stepping Stone Bridge by Timothy Michael Hammond [PRS], Wayne Roberts [PRS]Watching Ladybirds by Benjamin James Parsons [PRS] This video can be freely shared and downloaded. While the video in its entirety can be shared without permission, some individual imagery provided by pond5.com and Artbeats is obtained through permission and may not be excised or remixed in other products. Specific details on stock footage may be found here. For more information on NASA’s media guidelines, visit https://www.nasa.gov/multimedia/guidelines/index.html. Complete transcript available.](/vis/a010000/a013200/a013281/Thumbnail_Arctic_Fires_Print.jpg) Produced Video
Produced Video - ID: 13188
![Music: After the Sun by Andrew Michael Britton [PRS], David Stephen Goldsmith [PRS], Andrew Skeet [PRS]Complete transcript available.](/vis/a010000/a013100/a013188/Still_print.jpg) Produced Video
Produced Video - ID: 13142
![Music: Sculpture by Axel Coon [GEMA], Ralf Goebel [GEMA]Complete transcript available.](/vis/a010000/a013100/a013142/FlatMapStill.jpg) Produced Video
Produced Video
Release date
This page was originally published on Friday, January 12, 2024.
This page was last updated on Wednesday, January 8, 2025 at 1:56 PM EST.