NASA Climate Spiral 1880-Present
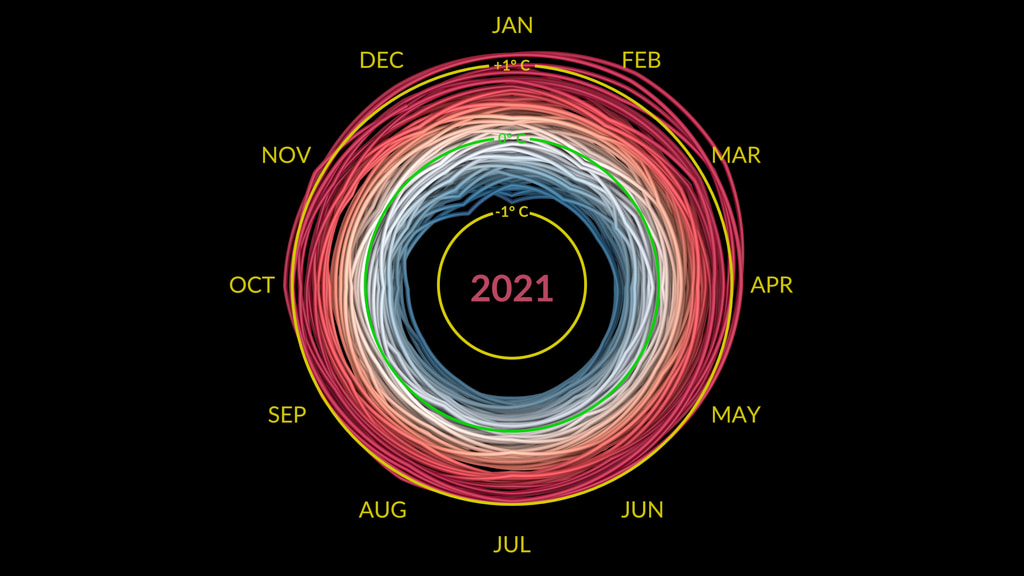
The NASA climate spiral visualization with labels in English and Celsius.
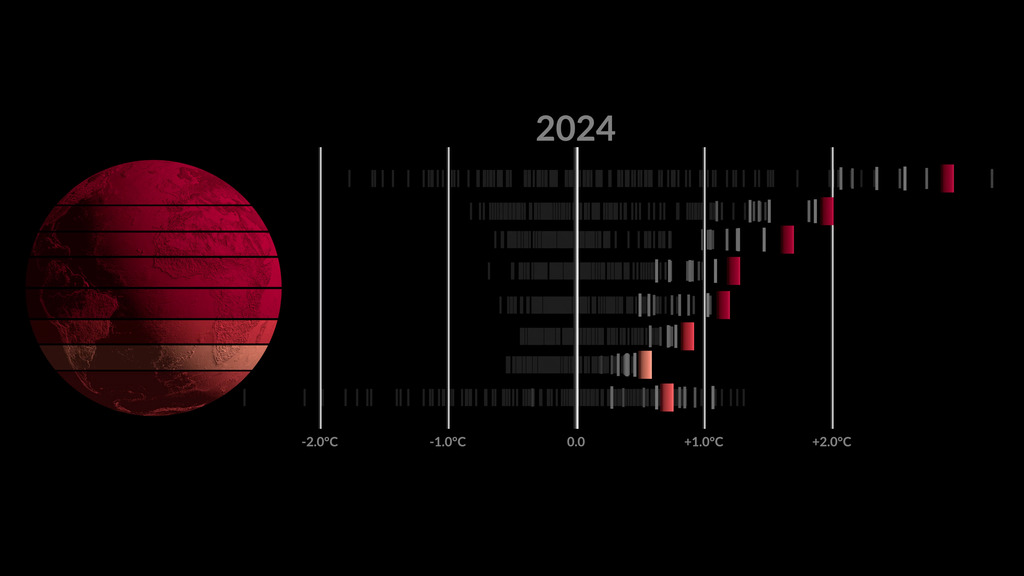
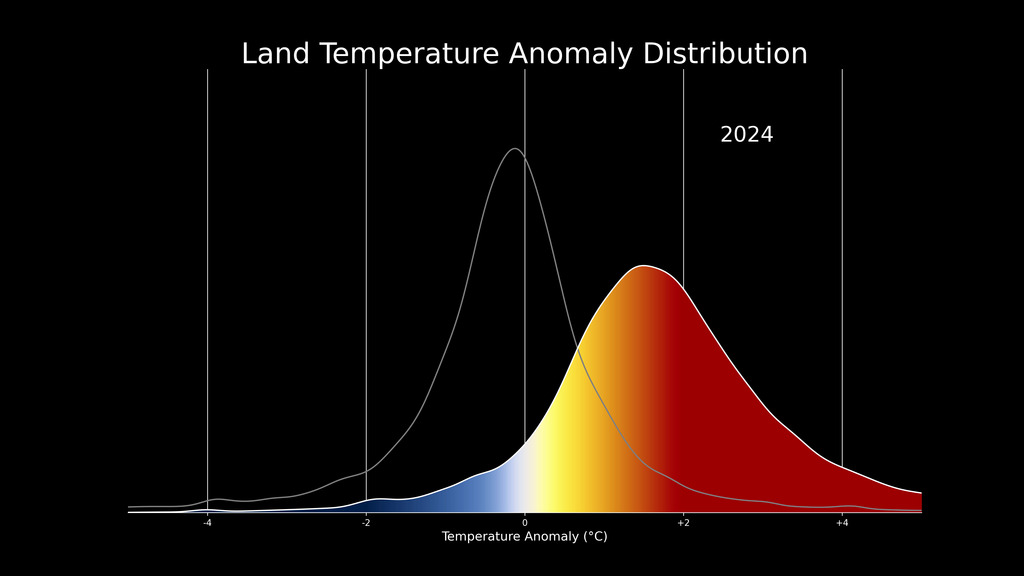
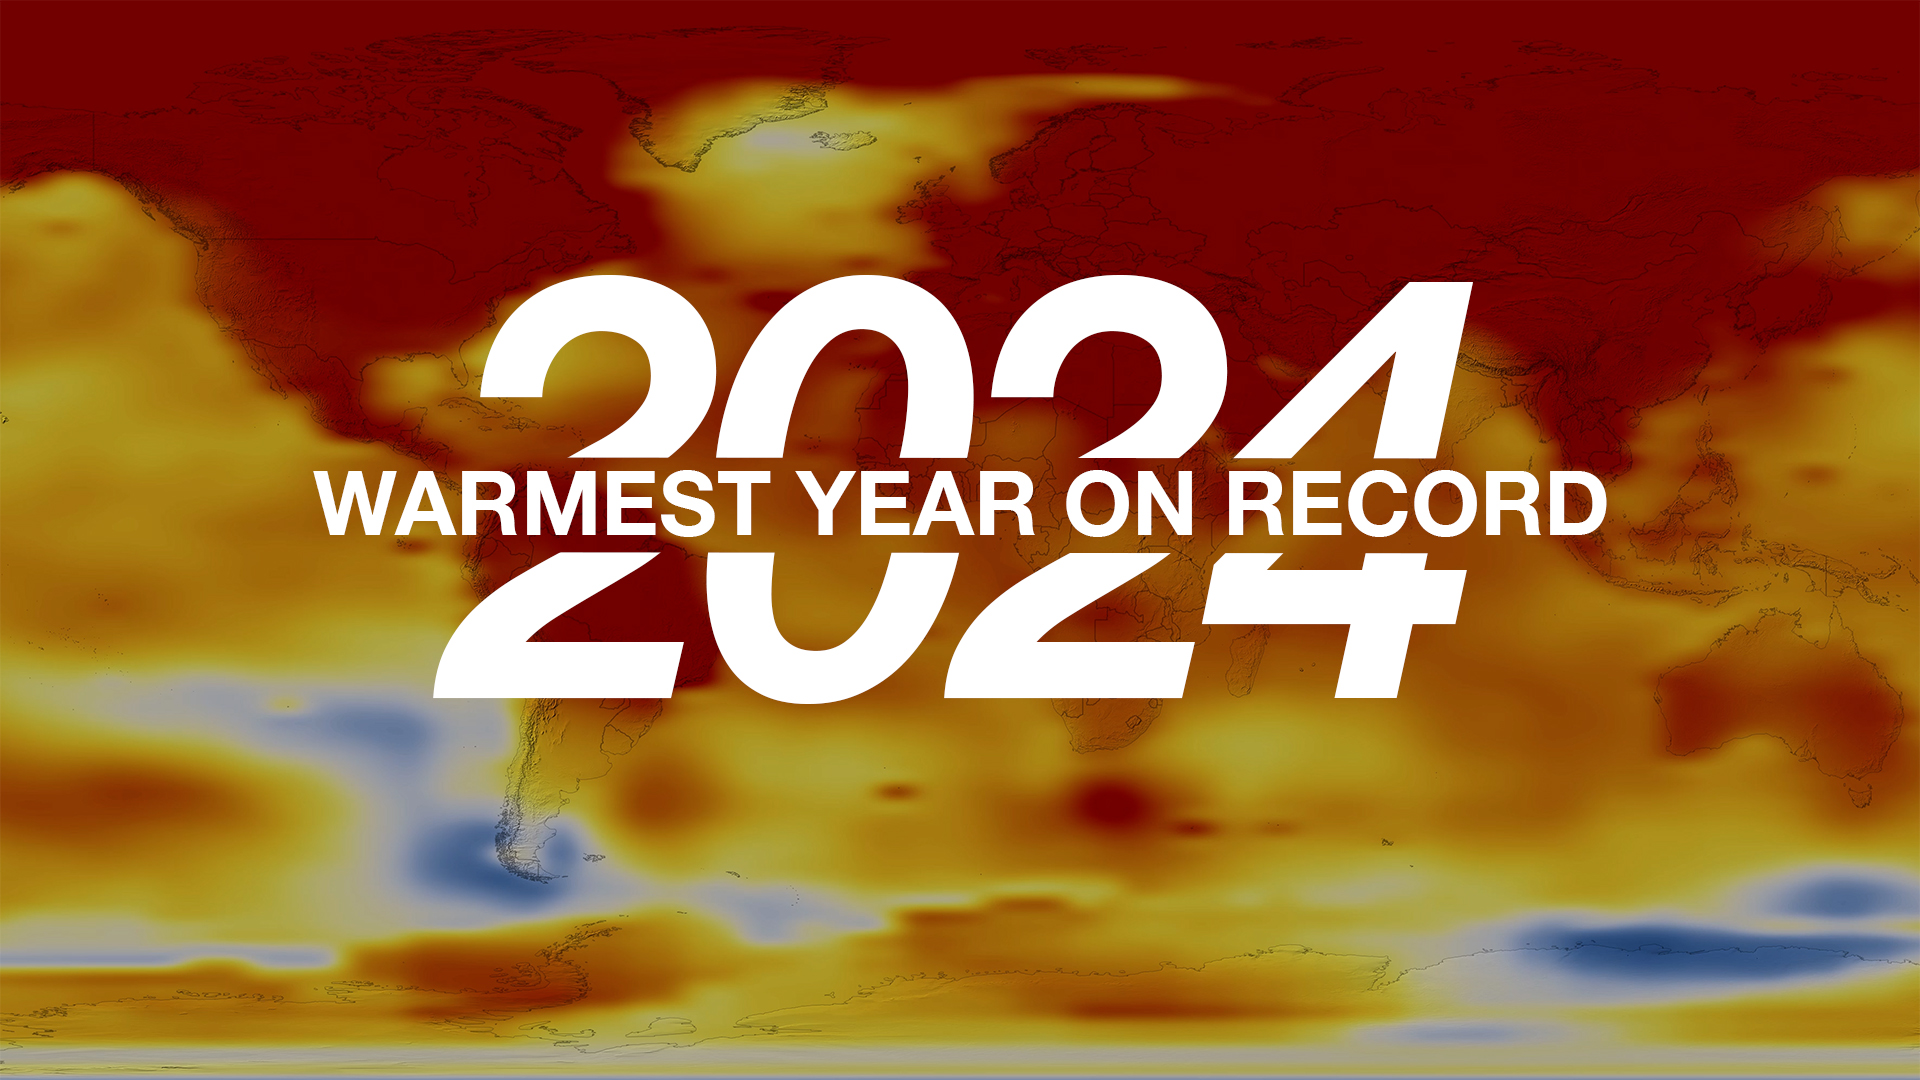
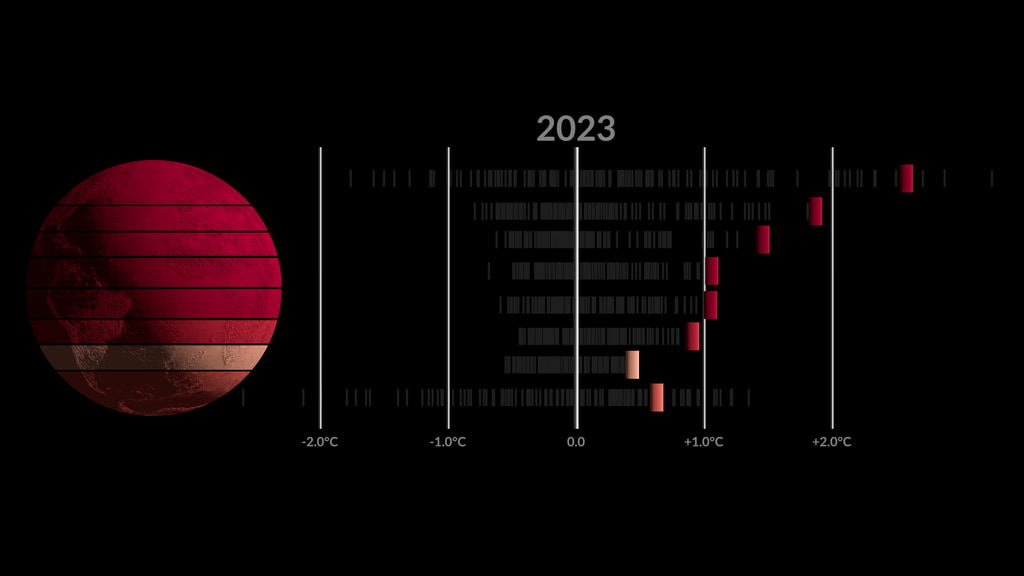
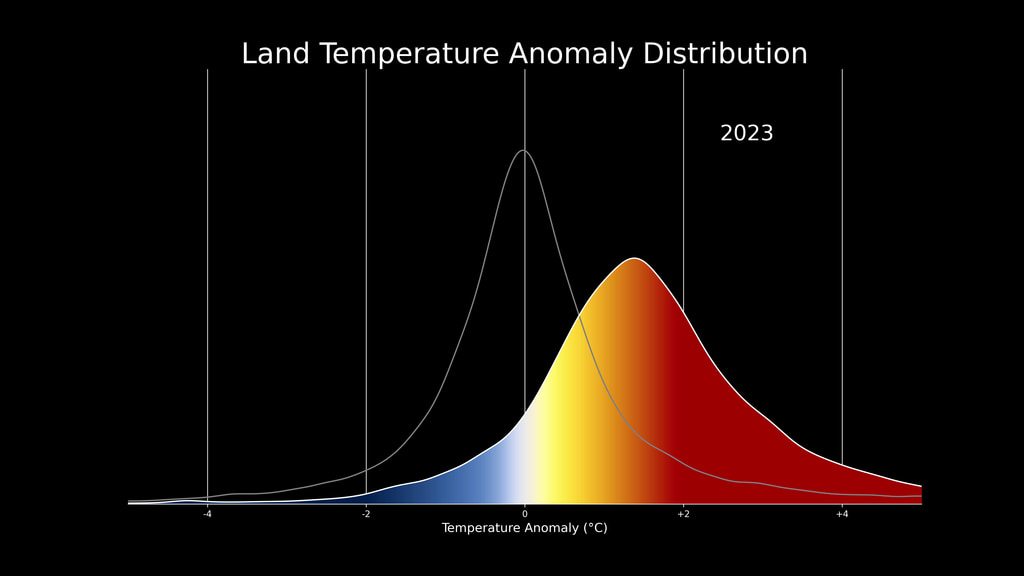
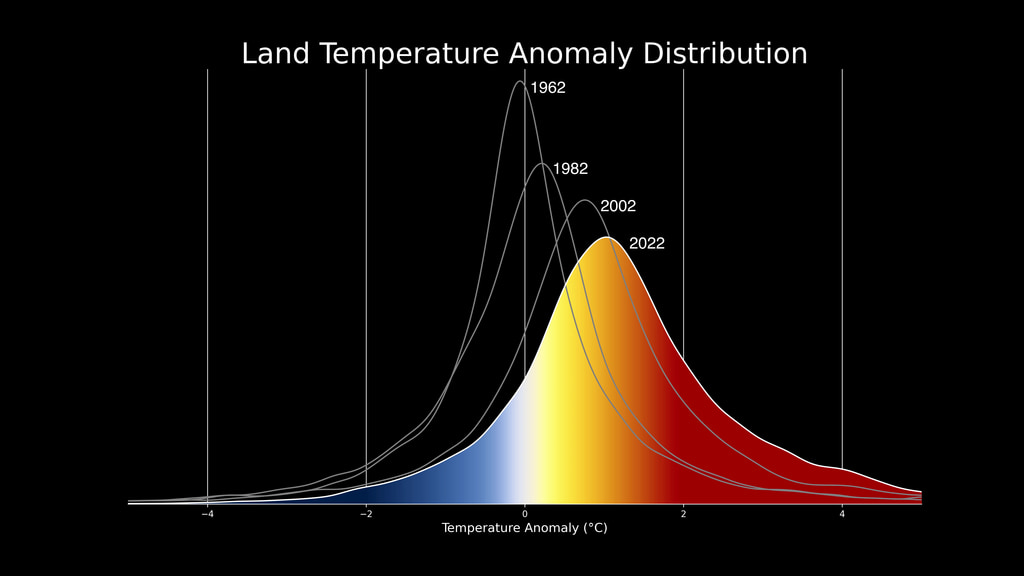
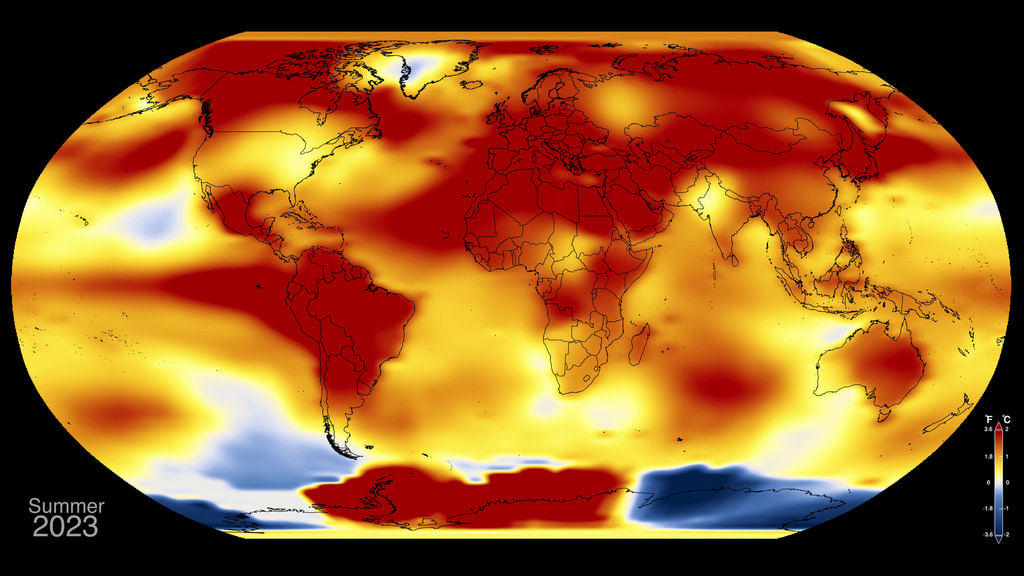
The visualization presents monthly global temperature anomalies. This visualization is updated roughly two weeks after the end of each month.
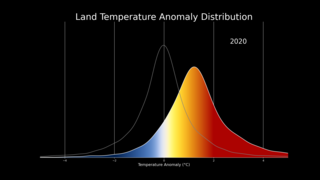
Temperature anomalies are deviations from a long term global average. In this case the period 1951-1980 is used to define the baseline for the anomaly. These temperatures are based on the GISS Surface Temperature Analysis (GISTEMP v4), an estimate of global surface temperature change. The data file used to create this visualization is publicly accessible here.
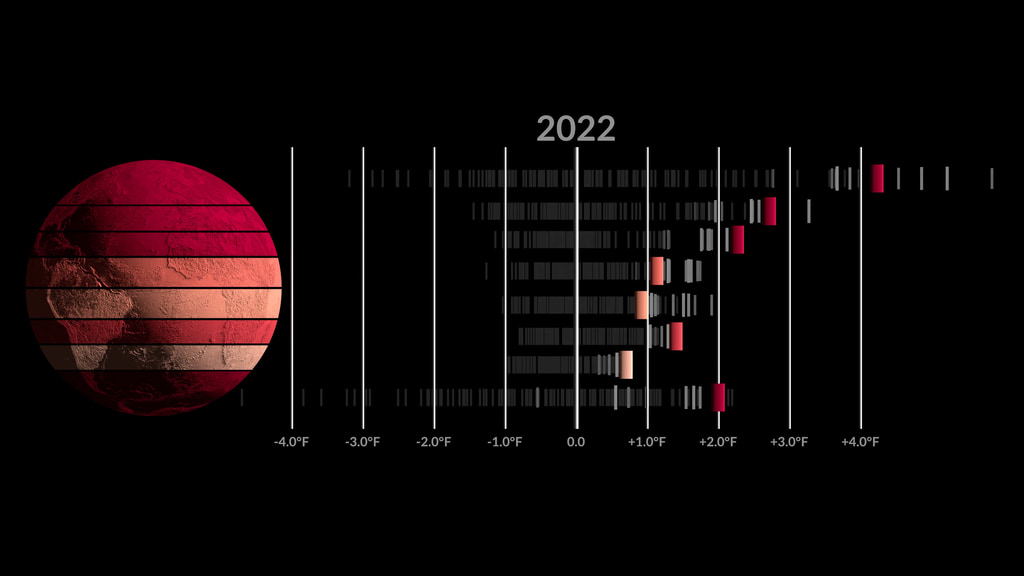
The term 'climate spiral' describes an animated radial plot of global temperatures. Climate scientist Ed Hawkins from the National Centre for Atmospheric Science, University of Reading popularized this style of visualization in 2016.
The Goddard Institute for Space Studies (GISS) in New York is a NASA laboratory managed by the Earth Sciences Division of the agency’s Goddard Space Flight Center in Greenbelt, Maryland. The laboratory is affiliated with Columbia University’s Earth Institute and School of Engineering and Applied Science in New York.
The NASA climate spiral visualization with labels in English and Fahrenheit.
The NASA climate spiral visualization with labels in Spanish and Celsius.
Credits
Please give credit for this item to:
NASA's Scientific Visualization Studio
-
Visualizers
-
Mark SubbaRao
(NASA/GSFC)

-
Ed Hawkins
(National Centre for Atmospheric Science, University of Reading)
-
Mark SubbaRao
(NASA/GSFC)
-
Technical support
- Laurence Schuler (ADNET Systems, Inc.)
- Ian Jones (ADNET Systems, Inc.)
-
Web administrator
- Ella Kaplan (Global Science and Technology, Inc.)
-
Scientist
-
Gavin A. Schmidt
(NASA/GSFC GISS)
-
Gavin A. Schmidt
(NASA/GSFC GISS)
-
Science support
-
Peter H. Jacobs
(NASA/GSFC)
-
Peter H. Jacobs
(NASA/GSFC)
Datasets used
-
GISTEMP [GISS Surface Temperature Analysis (GISTEMP)]
ID: 585The GISS Surface Temperature Analysis version 4 (GISTEMP v4) is an estimate of global surface temperature change. Graphs and tables are updated around the middle of every month using current data files from NOAA GHCN v4 (meteorological stations) and ERSST v5 (ocean areas), combined as described in our publications Hansen et al. (2010), Lenssen et al. (2019), and Lenssen et al. (2024).
Credit: Lenssen, N., G.A. Schmidt, M. Hendrickson, P. Jacobs, M. Menne, and R. Ruedy, 2024: A GISTEMPv4 observational uncertainty ensemble. J. Geophys. Res. Atmos., 129, no. 17, e2023JD040179, doi:10.1029/2023JD040179.
This dataset can be found at: https://data.giss.nasa.gov/gistemp/
See all pages that use this dataset
Note: While we identify the data sets used on this page, we do not store any further details, nor the data sets themselves on our site.
Citing this page
Related
- ID: 5603
 Visualization
 - ID: 5376
 Visualization
 - ID: 5451
 Visualization
 - ID: 5452
- ID: 14743
 Produced Video
 - ID: 5383
 Visualization
 - ID: 5311

- ID: 5327

- ID: 5207
 Visualization
 - ID: 5209
 Visualization
 - ID: 5211
- ID: 14502
 Produced Video
 - ID: 5065
- ID: 5059
 Visualization
 - ID: 14273
 Produced Video
 - ID: 5060
 Visualization
 - ID: 5028
 Visualization
 - ID: 4891
Older Versions
- ID: 5161
 Visualization
 - ID: 5057
 Visualization
 - ID: 4975
 Visualization
Release date
This page was originally published on Wednesday, November 15, 2023.
This page was last updated on Friday, June 12, 2026 at 2:03 PM EDT.