Arctic Sea Ice Spiral
A data visualization of the Arctic sea ice extent from October 1978 to September 2022. This version is in units of square miles, see below for version in square kilometers.
A data visualization of the Arctic sea ice extent from October 1978 to September 2022. This version is in units of square kilometers, see above for version in square miles.
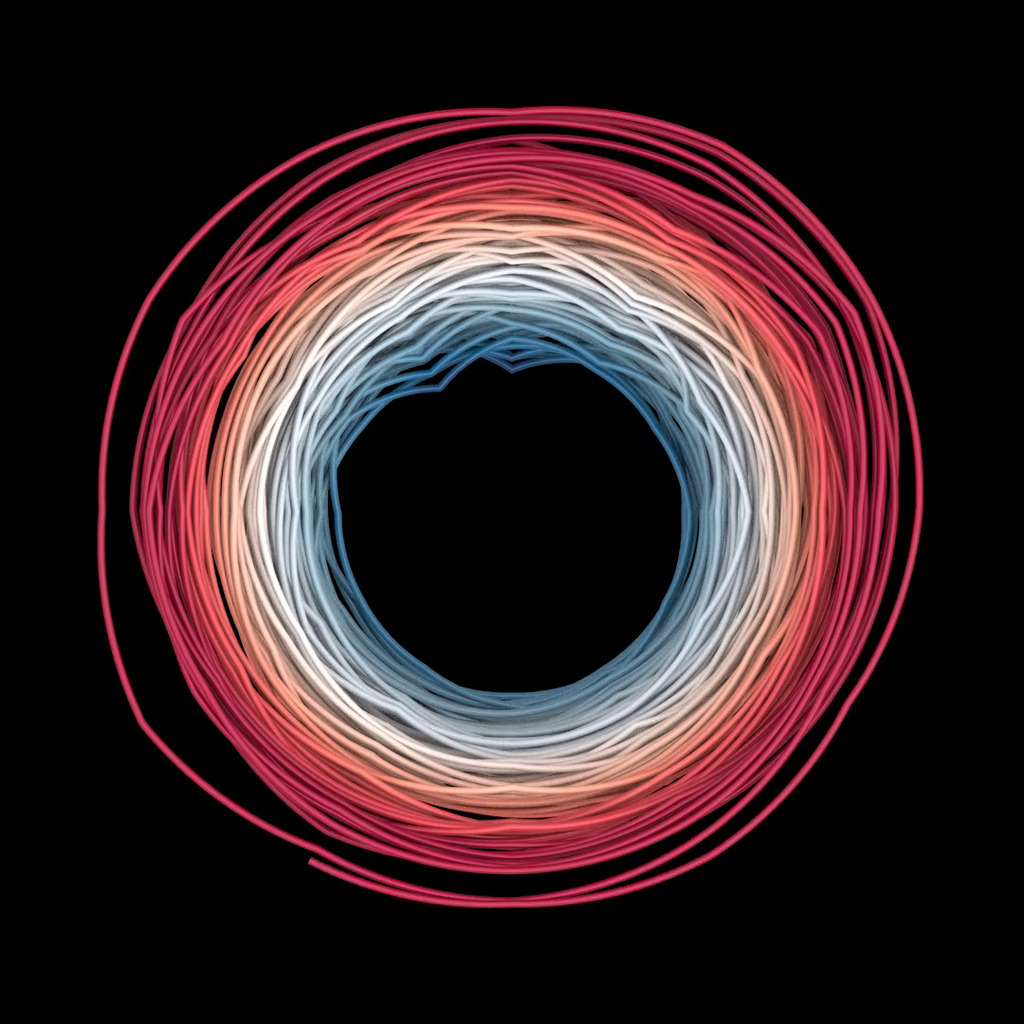
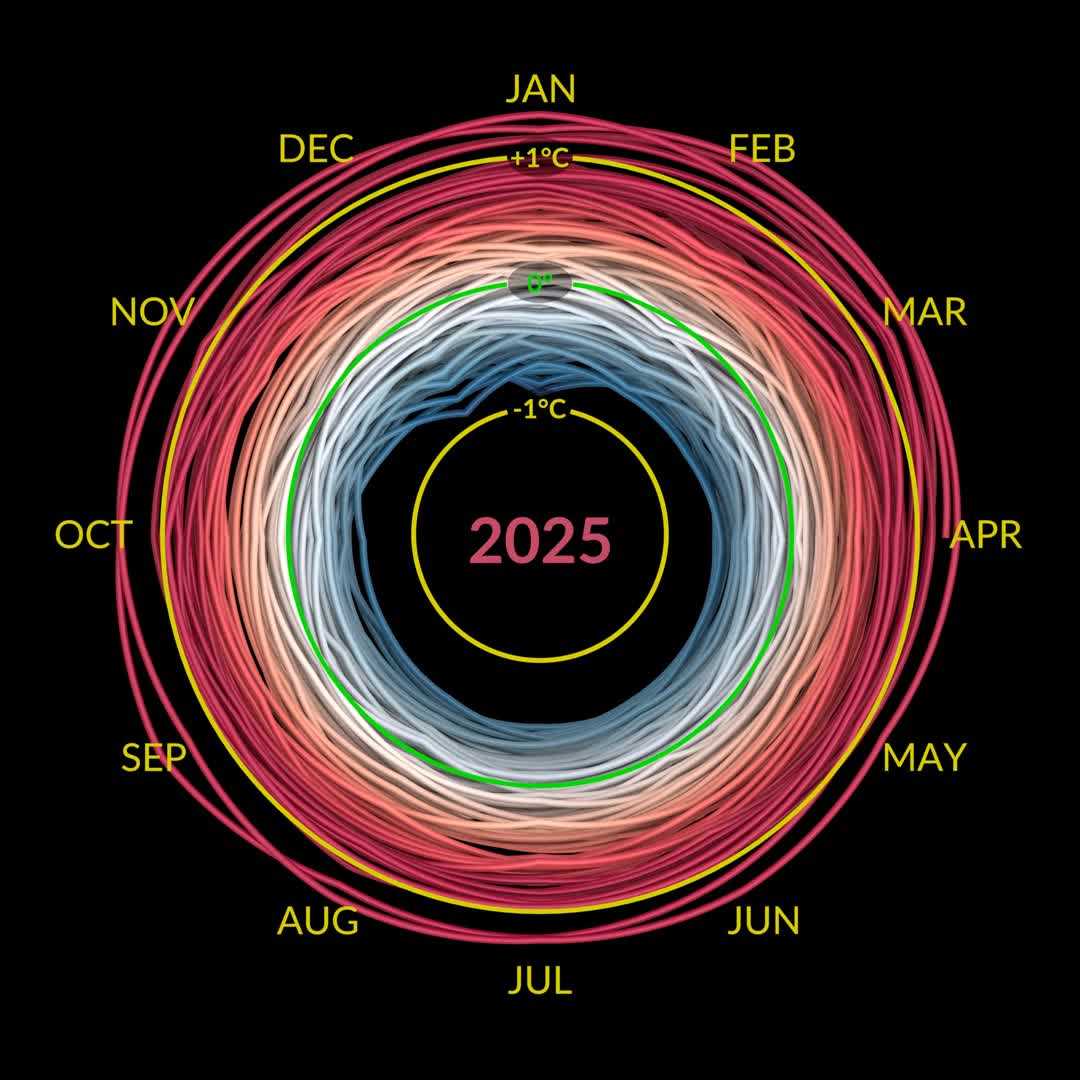
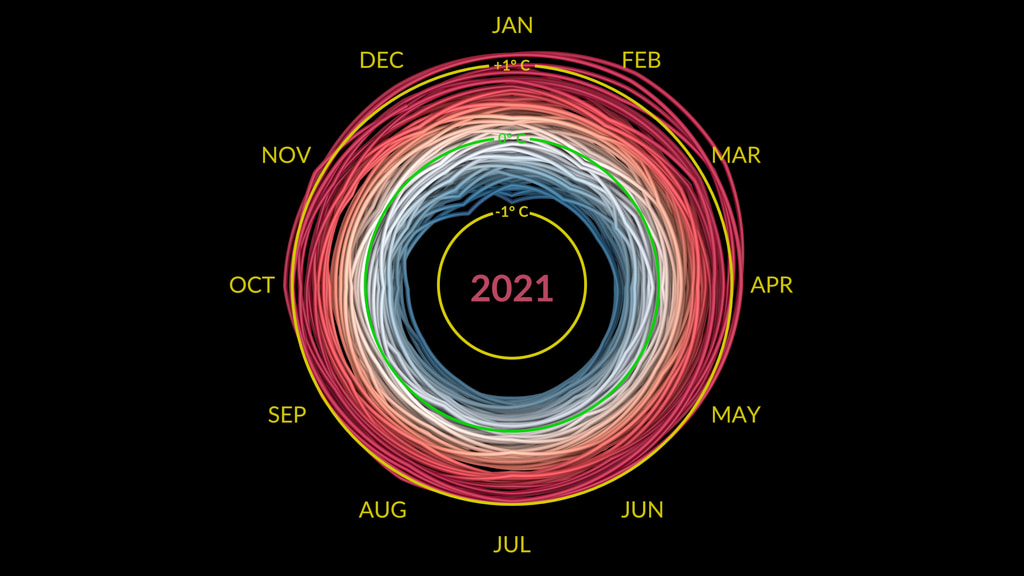
This data visualization shows the Arctic sea ice extent from October 1978 to September 2022. The amount of Arctic sea ice varies seasonally, typically reaching a maximum in March and a minimum in September. Recently, the Arctic sea ice minimum has been decreasing at a rate of 13% per decade. Please see Global Climate Change Vital Signs: Arctic Sea Ice Minimum Extent for more information.
Credits
Please give credit for this item to:
NASA's Scientific Visualization Studio
-
Visualizer
-
Mark SubbaRao
(NASA/GSFC)

-
Mark SubbaRao
(NASA/GSFC)
-
Technical support
- Laurence Schuler (ADNET Systems, Inc.)
- Ian Jones (ADNET Systems, Inc.)
-
Web administrator
- Ella Kaplan (Global Science and Technology, Inc.)
Datasets used
-
Sea Ice Index (Sea Ice Index) [DMSP, DMSP 5D-3/F17, DMSP 5D-3/F18, Nimbus-7: SMMR, SSM/I, SSMIS]
ID: 1162The Sea Ice Index provides a quick look at Arctic- and Antarctic-wide changes in sea ice. It is a source for consistent, up-to-date sea ice extent and concentration images, in PNG format, and data values, in GeoTIFF and ASCII text files, from November 1978 to the present. Sea Ice Index images also depict trends and anomalies in ice cover calculated using a 30-year reference period of 1981 through 2010. The images and data are produced in a consistent way that makes the Index time-series appropriate for use when looking at long-term trends in sea ice cover. Both monthly and daily products are available. However, monthly products are better to use for long-term trend analysis because errors in the daily product tend to be averaged out in the monthly product and because day-to-day variations are often the result of short-term weather.
Credit: Data Contributors: Florence Fetterer, Kenneth Knowles, Walter Meier, Matthew Savoie, Ann Windnagel
This dataset can be found at: https://nsidc.org/data/g02135/versions/3#anchor-1
See all pages that use this dataset
Note: While we identify the data sets used on this page, we do not store any further details, nor the data sets themselves on our site.
Related
- ID: 5376
 Visualization
 - ID: 5383
 Visualization
 - ID: 5311

- ID: 5327

- ID: 5191
 Visualization
 - ID: 5190
 Visualization
 - ID: 5161
 Visualization
 - ID: 5137
 Visualization
 - ID: 5057
 Visualization
 - ID: 4975
 Visualization
Release date
This page was originally published on Thursday, September 22, 2022.
This page was last updated on Friday, May 17, 2024 at 1:54 PM EDT.