July 2023 Record High Global Temperatures
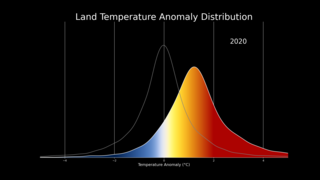
Monthly temperature anomalies measure from 1880 to July 2023 measured with respect to a the baseline period 1951-1980. This graph includes the seasonal cycle (from MERRA2) showing that July 2023 was the warmest month on record. Temperatures measured in Celsius, a Fahrenheit version of this graph is also available.
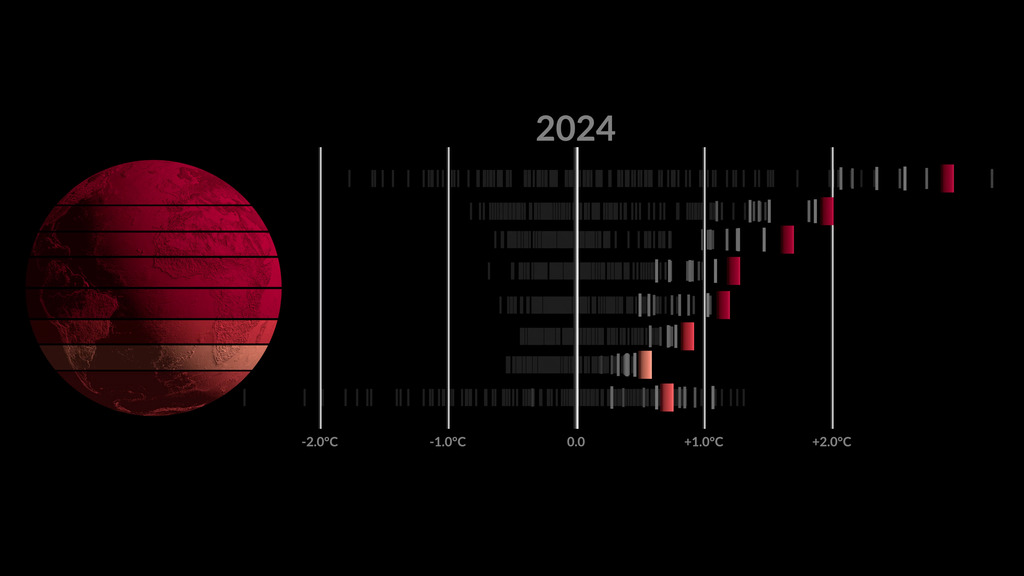
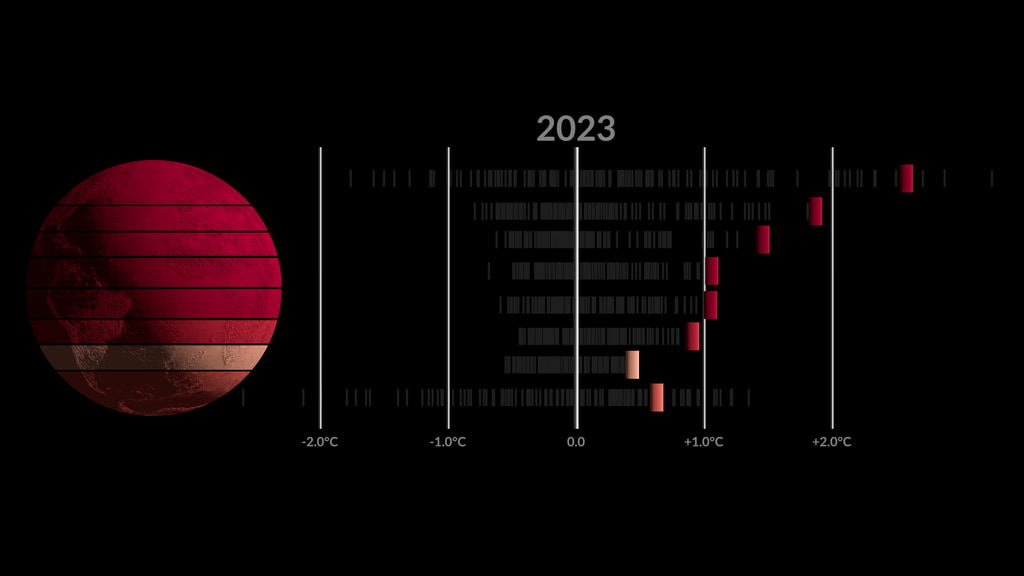
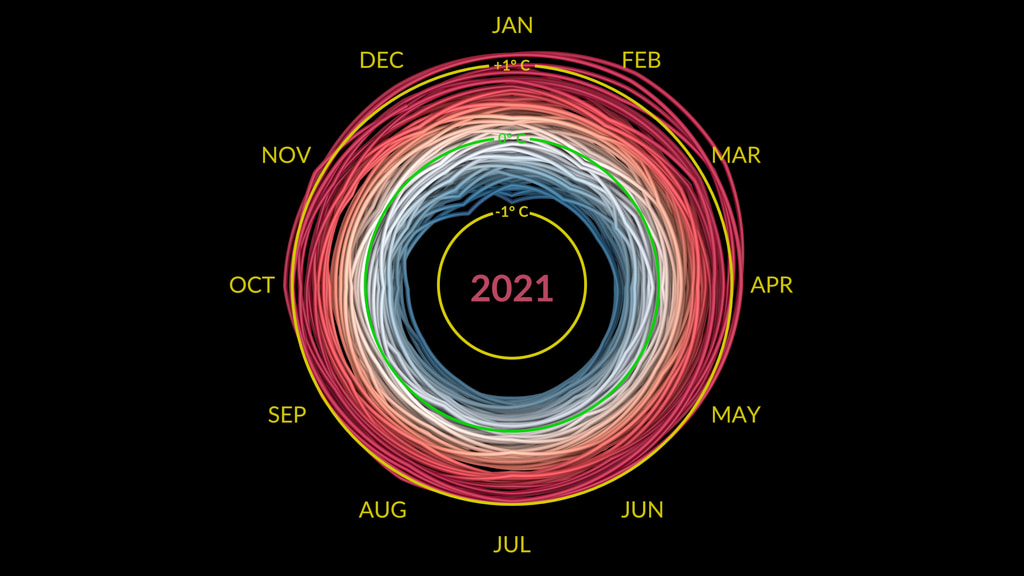
Climate Spiral showing monthly temperature anomalies 1880 through July 2023 (over the baseline period 1951-1980). This version is in Celsius, a version in Fahrenheit is also available.
July 2023 set a record for the warmest month on record (since 1880). July 2023 was 0.24 degrees Celsius (0.43 degrees Fahrenheit) warmer than the previous record. The globally averaged temperature in July 2023 was 1.18 degrees Celsius (2.12 degrees Fahrenheit) warmer than the average July temperature (as compared to the baseline period 1951-1980). July is also, on average, the warmest month of the year (based on MERRA-2 realalysis data here). The combination of these factors led to July 2023 setting the mark as the warmest month since 1880.
Two graphics are provided here. One plots monthly temperature anomalies with the seasonal cycle included, while the climate spiral graphic plots monthly temperature anomalies without the seasonal cycle.
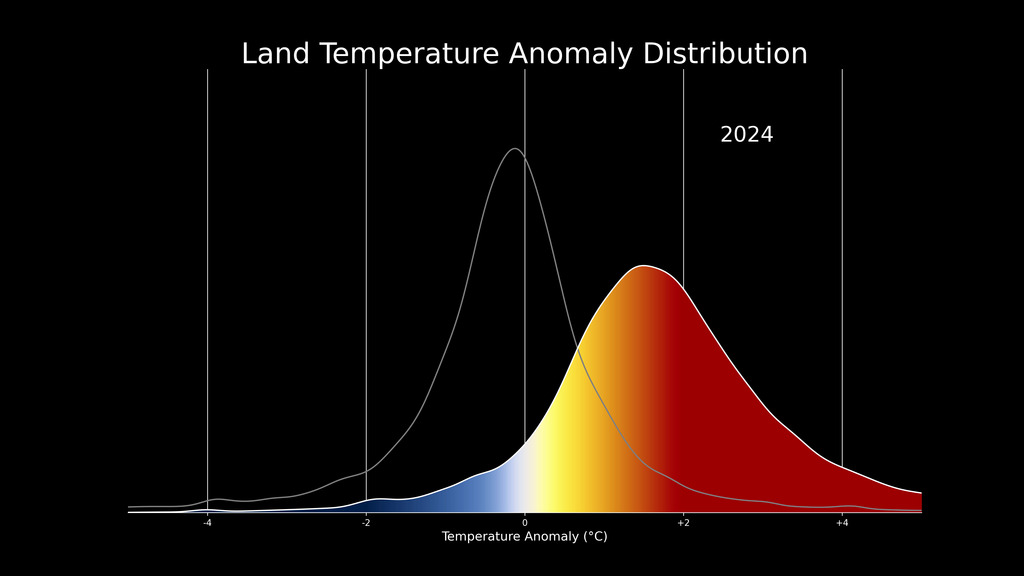
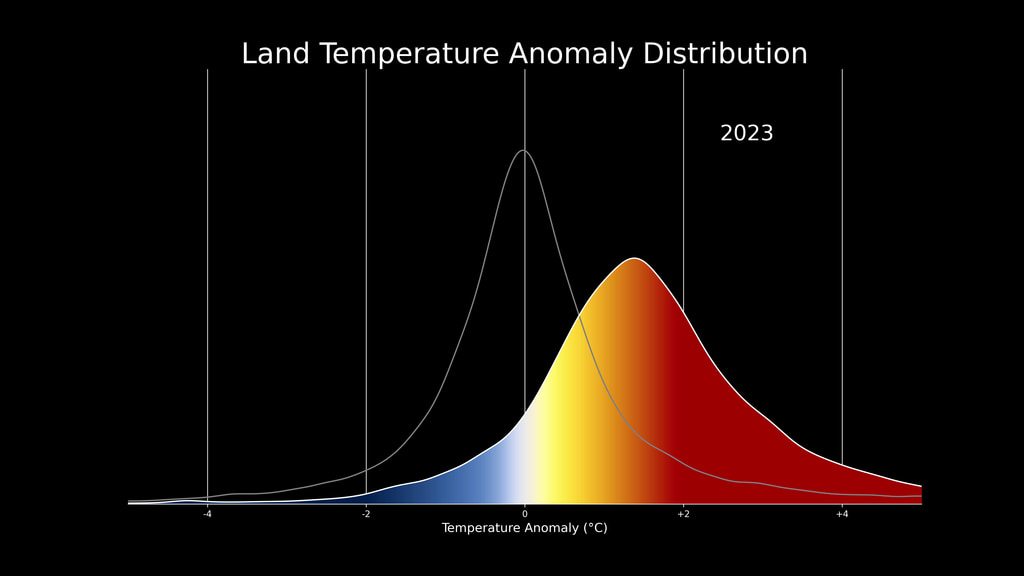
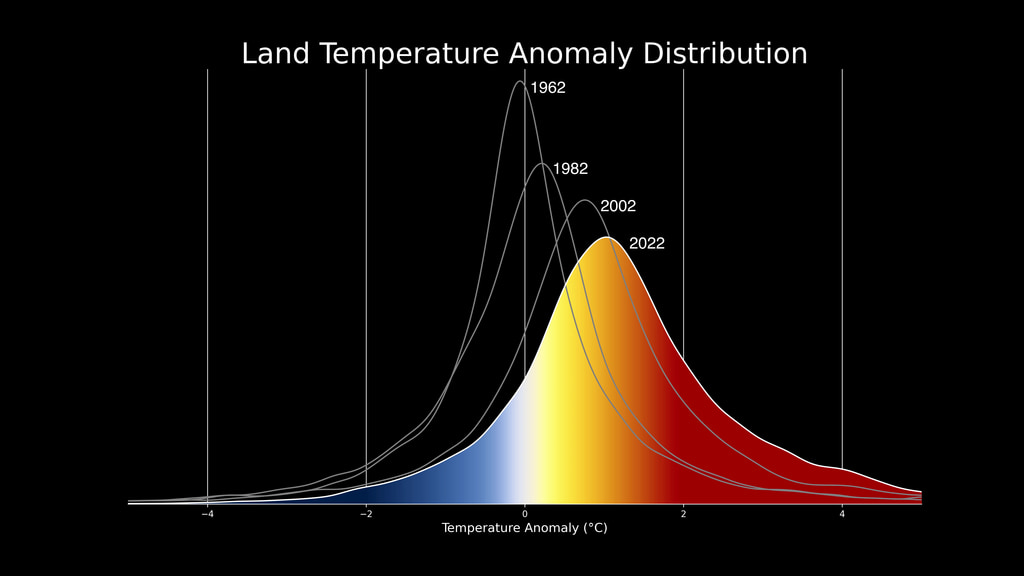
Temperature anomalies are deviations from a long term global average. In this case the period 1951-1980 is used to define the baseline for the anomaly. These temperature anomalies are based on the GISS Surface Temperature Analysis (GISTEMP v4), an estimate of global surface temperature change. The data file used to create this visualization is publicly accessible here.
The Goddard Institute of Space Studies (GISS) is a NASA laboratory managed by the Earth Sciences Division of the agency’s Goddard Space Flight Center in Greenbelt, Maryland. The laboratory is affiliated with Columbia University’s Earth Institute and School of Engineering and Applied Science in New York.
The term 'climate spiral' describes an animated radial plot of global temperatures. Climate scientist Ed Hawkins from the National Centre for Atmospheric Science, University of Reading popularized this style of visualization in 2016.
Additional versions of these graphics labeled in Fahrenheit and Spanish are below.
Monthly temperature anomalies measure from 1880 to July 2023 measured with respect to a the baseline period 1951-1980. This graph includes the seasonal cycle (from MERRA2) showing that July 2023 was the warmest month on record. This version is labeled in Spanish.
Monthly temperature anomalies measure from 1880 to July 2023 measured with respect to a the baseline period 1951-1980. This version is labeled in Spanish.
Climate Spiral showing monthly temperature anomalies 1880 through July 2023 (over the baseline period 1951-1980). This version is in Fahrenheit, a Celsius version is also available.
Monthly temperature anomalies measure from 1880 to July 2023 measured with respect to a the baseline period 1951-1980. This graph includes the seasonal cycle (from MERRA2) showing that July 2023 was the warmest month on record. Temperatures measured in Fahrenheit, a Celsius version of this graph is also available.
Credits
Please give credit for this item to:
NASA's Scientific Visualization Studio
-
Visualizers
-
Mark SubbaRao
(NASA/GSFC)

-
Ed Hawkins
(National Centre for Atmospheric Science, University of Reading)
-
Mark SubbaRao
(NASA/GSFC)
-
Technical support
- Laurence Schuler (ADNET Systems, Inc.)
- Ian Jones (ADNET Systems, Inc.)
-
Web administrator
- Ella Kaplan (Global Science and Technology, Inc.)
-
Scientist
-
Gavin A. Schmidt
(NASA/GSFC GISS)
-
Gavin A. Schmidt
(NASA/GSFC GISS)
-
Producer
-
Peter H. Jacobs
(NASA/GSFC)
-
Peter H. Jacobs
(NASA/GSFC)
Datasets used
-
GISTEMP [GISS Surface Temperature Analysis (GISTEMP)]
ID: 585The GISS Surface Temperature Analysis version 4 (GISTEMP v4) is an estimate of global surface temperature change. Graphs and tables are updated around the middle of every month using current data files from NOAA GHCN v4 (meteorological stations) and ERSST v5 (ocean areas), combined as described in our publications Hansen et al. (2010), Lenssen et al. (2019), and Lenssen et al. (2024).
Credit: Lenssen, N., G.A. Schmidt, M. Hendrickson, P. Jacobs, M. Menne, and R. Ruedy, 2024: A GISTEMPv4 observational uncertainty ensemble. J. Geophys. Res. Atmos., 129, no. 17, e2023JD040179, doi:10.1029/2023JD040179.
This dataset can be found at: https://data.giss.nasa.gov/gistemp/
See all pages that use this dataset -
MERRA-2 (MERRA-2)
ID: 1134
Note: While we identify the data sets used on this page, we do not store any further details, nor the data sets themselves on our site.
Related
- ID: 5603
 Visualization
 - ID: 5450
 Visualization
 - ID: 5451
 Visualization
 - ID: 5452
- ID: 5207
 Visualization
 - ID: 5209
 Visualization
 - ID: 5211
- ID: 14407
![Universal Production Music: Knock and Wait (Instrumental) by Brice Davoli [SACEM], Well That’s Difference (Instrumental) by Jeff Cardoni [ASCAP], Wanna Be Hipster (Instrumental) by Jeff Cardoni [ASCAP], Curiosity Killed Kitty (Instrumental) by Robert Leslie Bennett [ASCAP], Eco Issues (Instrumental) by Max van Thun [GEMA] Additional Footage: Pond5.com, CSPANComplete transcript available.](/vis/a010000/a014400/a014407/Title.jpg) Produced Video
Produced Video - ID: 5065
- ID: 5059
 Visualization
 - ID: 14273
 Produced Video
 - ID: 5060
 Visualization
 - ID: 5028
 Visualization
 - ID: 4891
Older Versions
- ID: 4975
 Visualization
Release date
This page was originally published on Monday, August 14, 2023.
This page was last updated on Wednesday, September 27, 2023 at 12:39 PM EDT.