A newer version of this visualization is available.
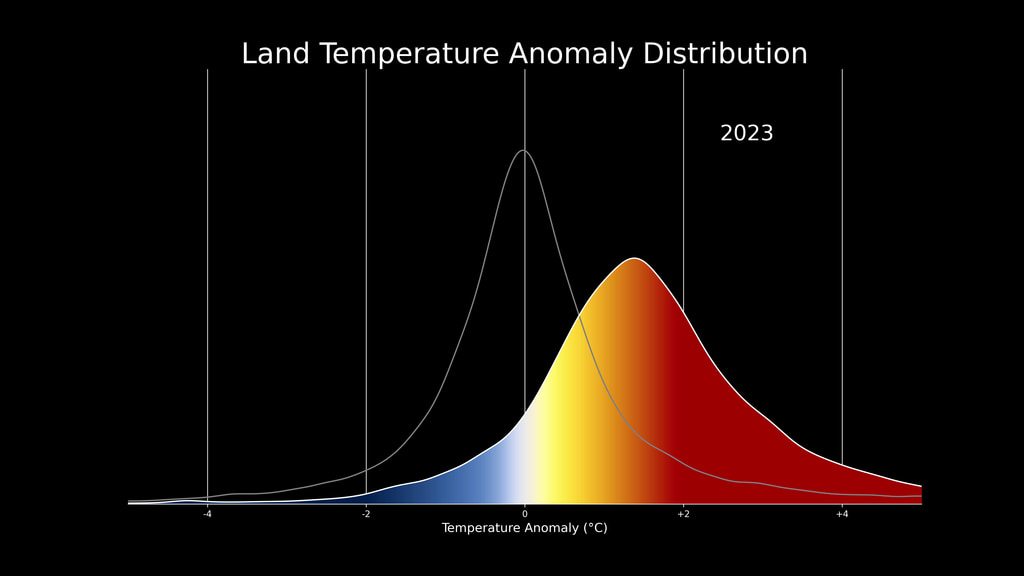
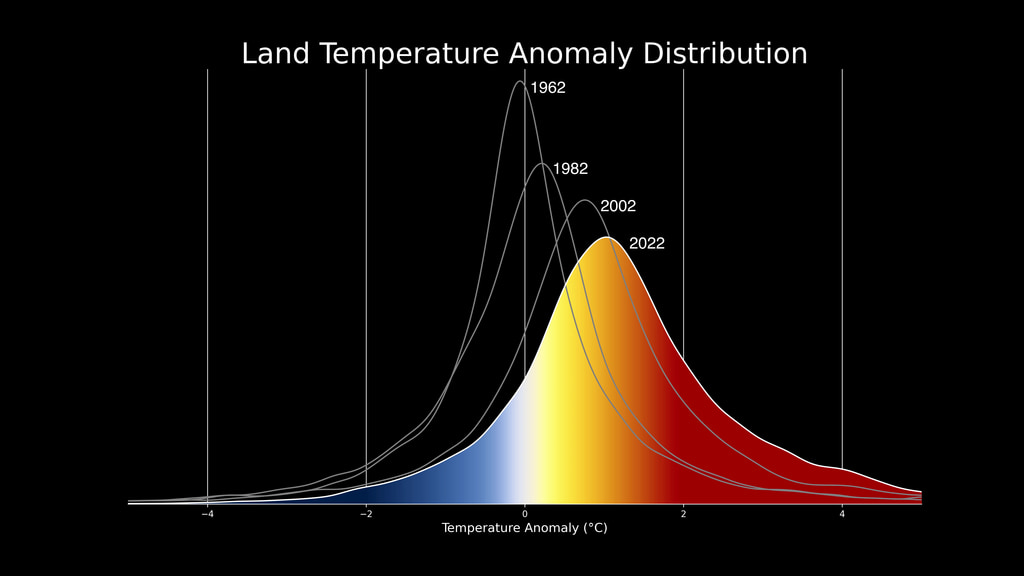
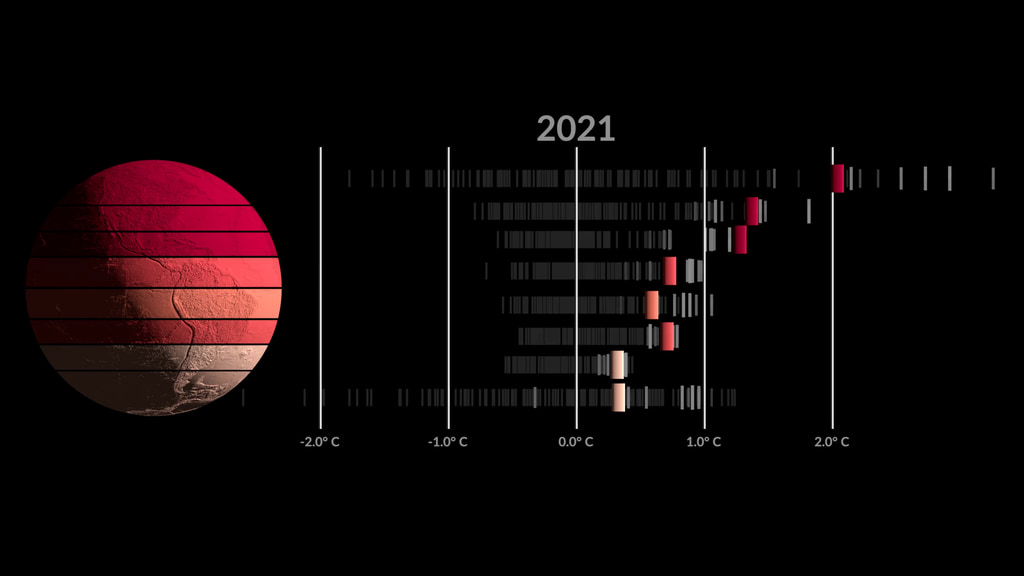
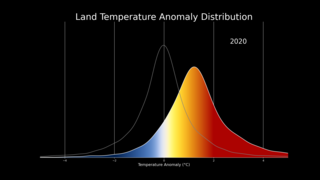
Global Temperature Anomalies from 1880 to 2024
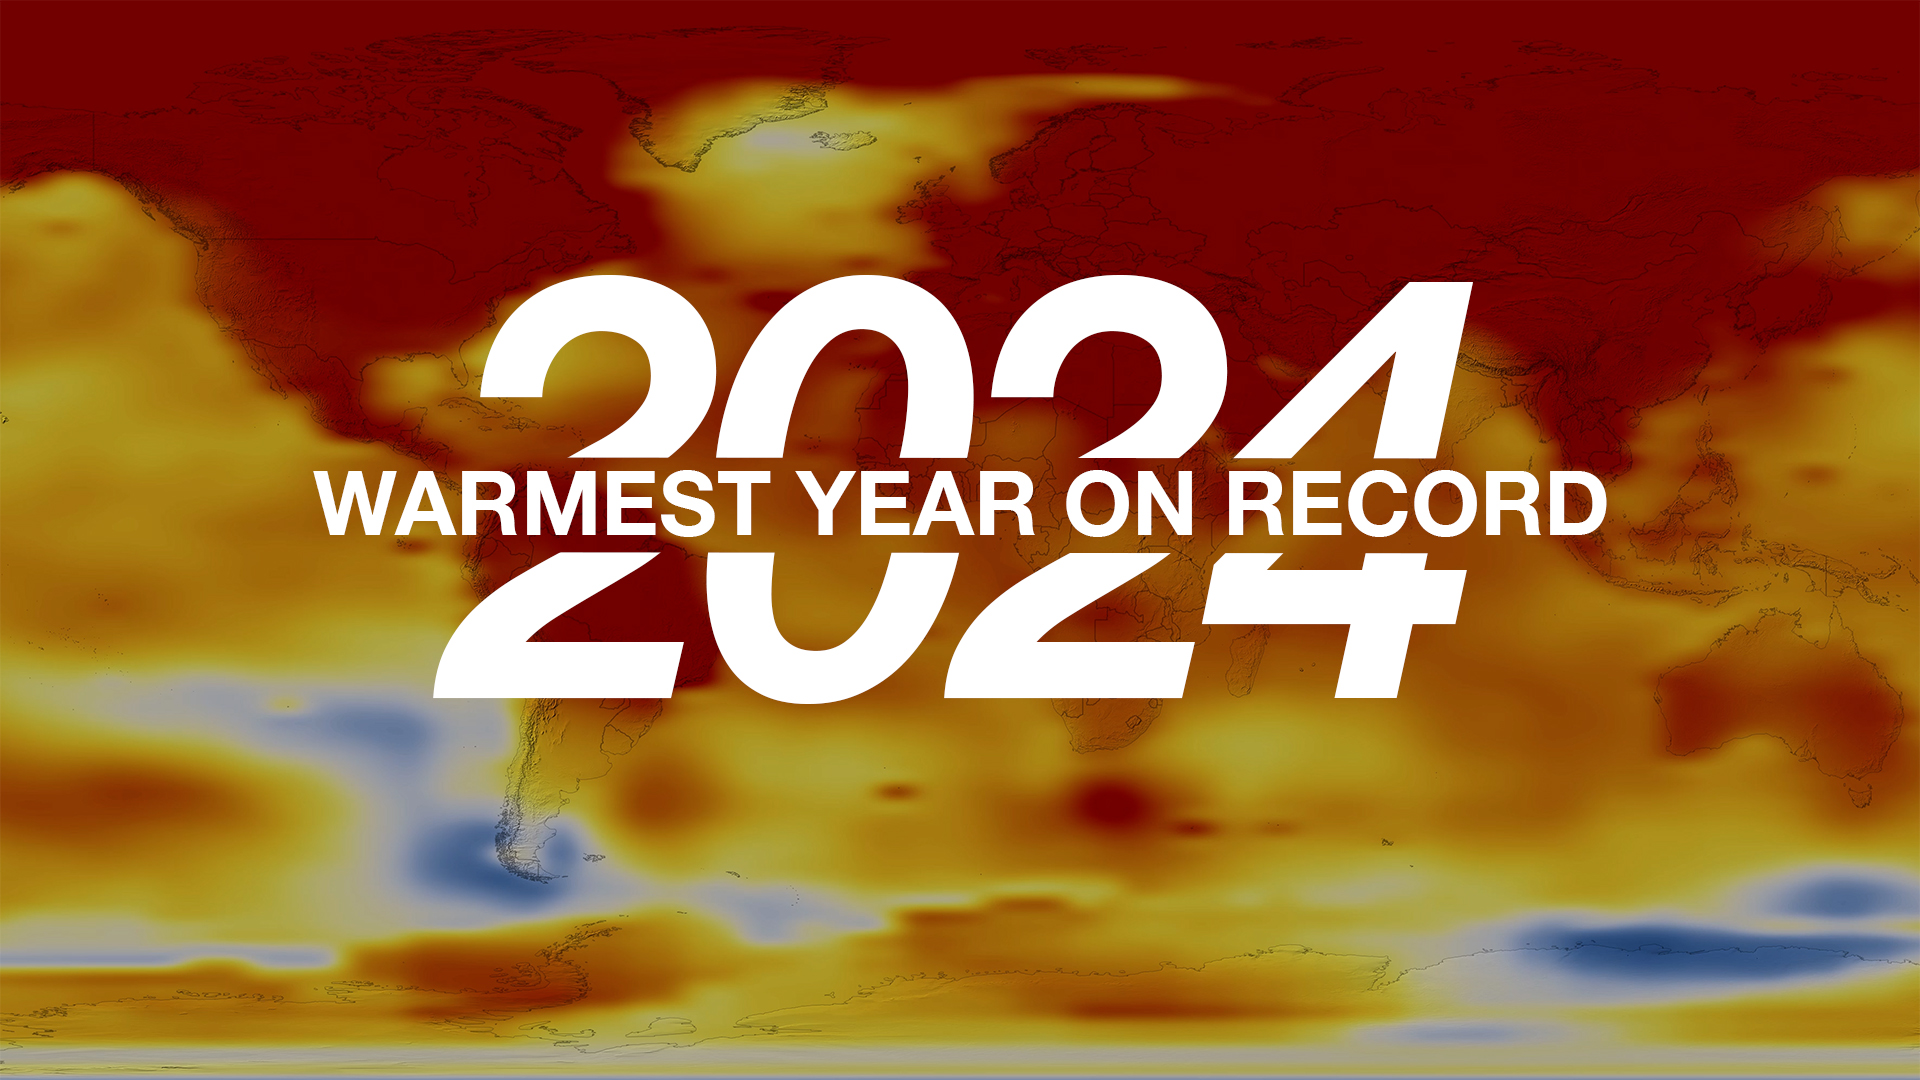
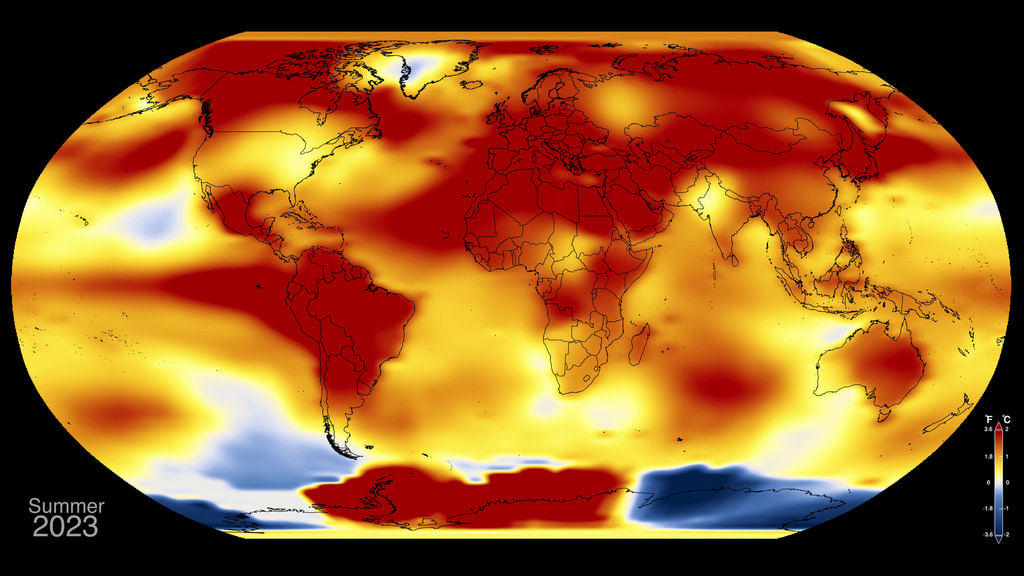
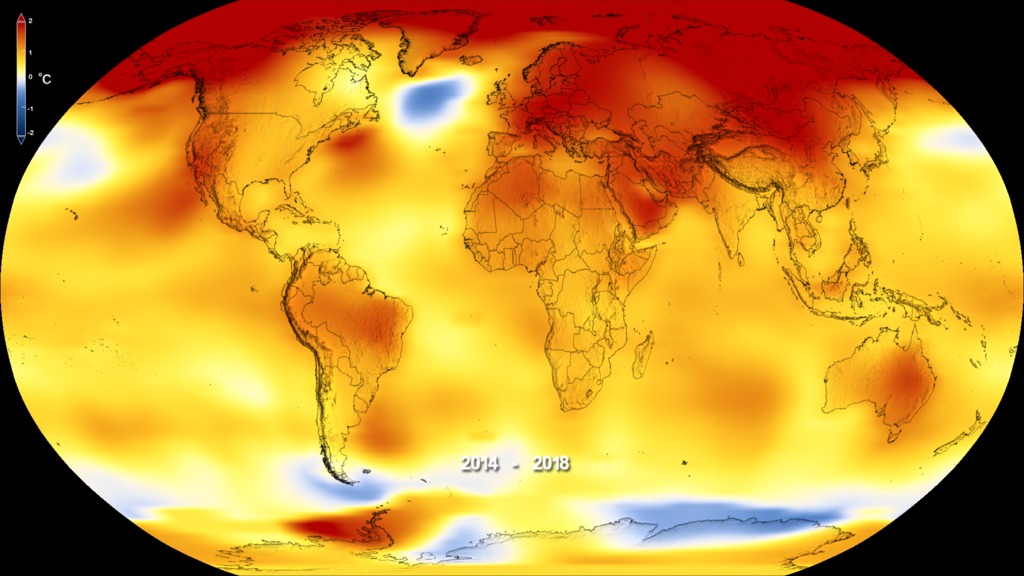
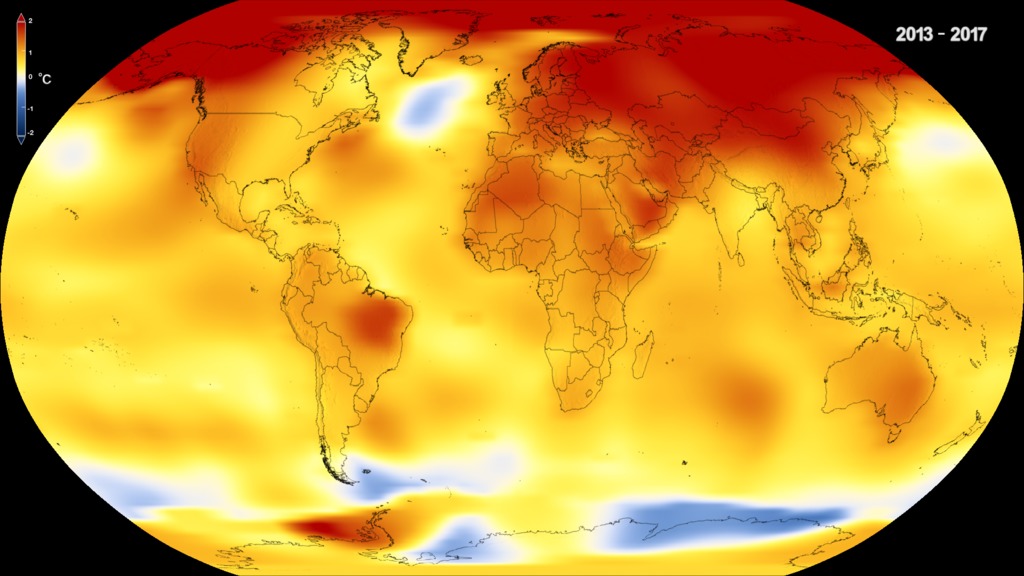
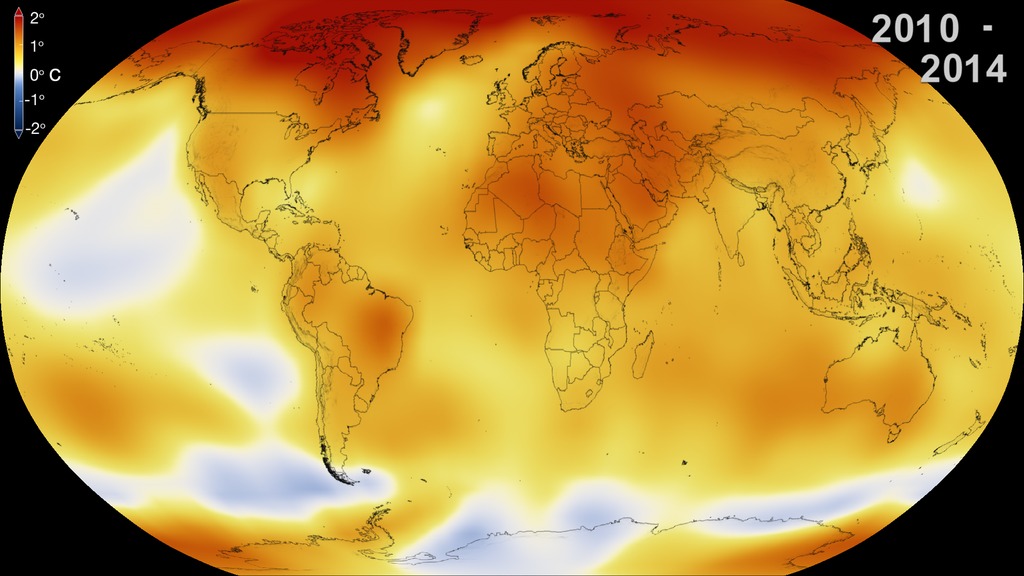
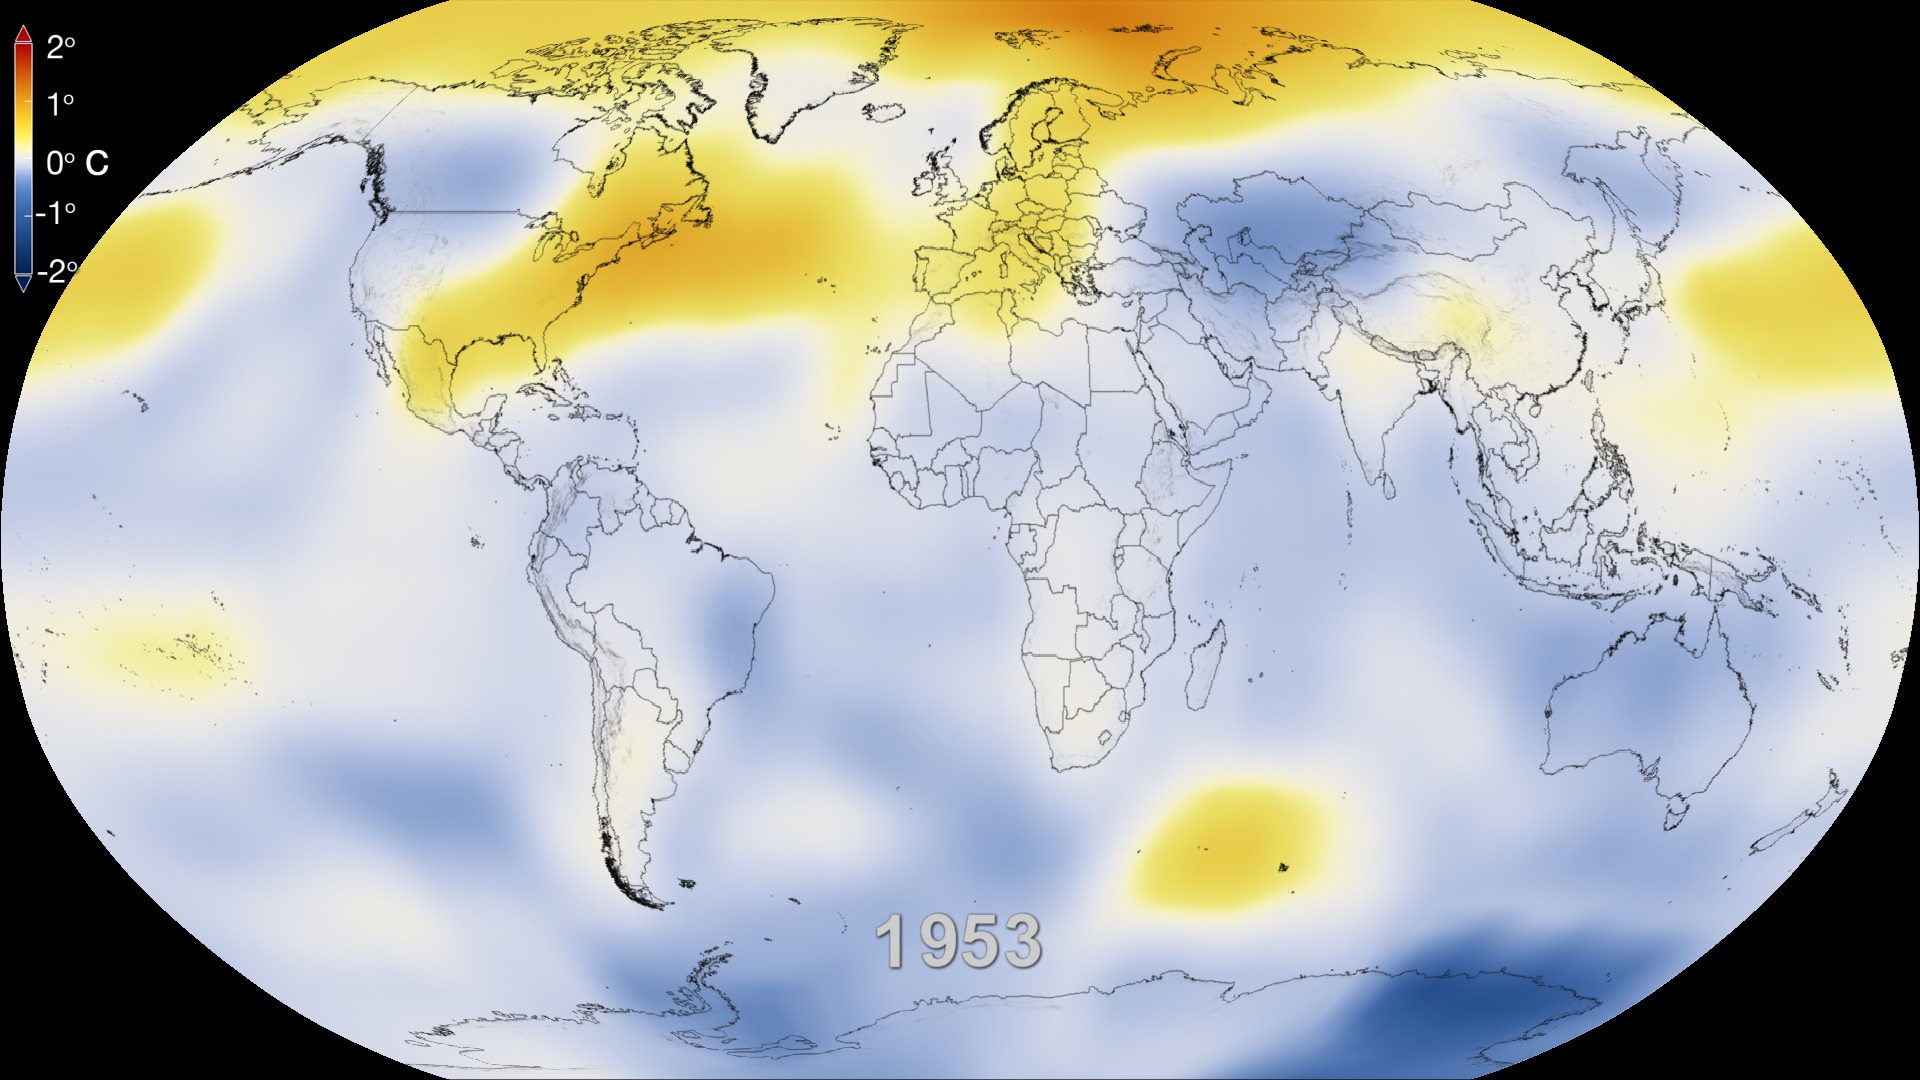
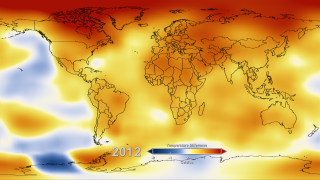
This color-coded map in Robinson projection displays a progression of changing global surface temperature anomalies. Normal temperatures are shown in white. Higher than normal temperatures are shown in red and lower than normal temperatures are shown in blue. Normal temperatures are calculated over the 30 year baseline period 1951-1980. The maps are averages over a running 24 month window. The final frame represents global temperature anomalies in 2024.
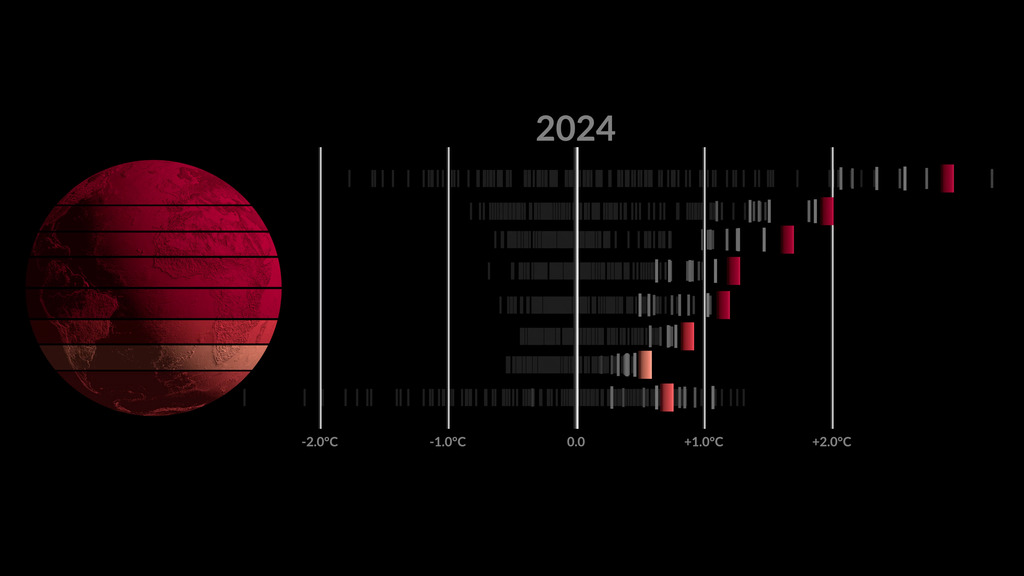
Earth’s average surface temperature in 2024 was the warmest on record, according to an analysis led by NASA scientists.
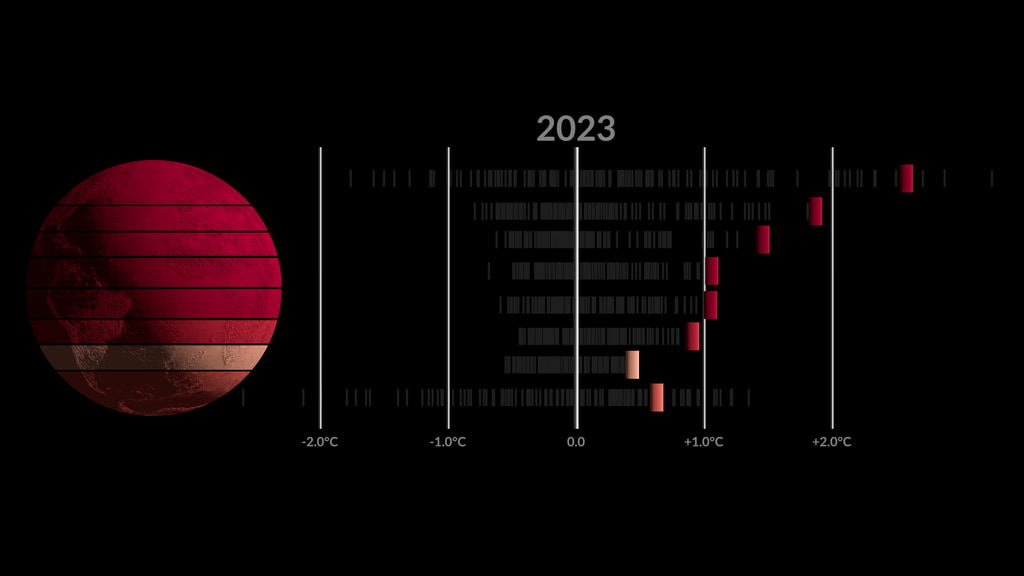
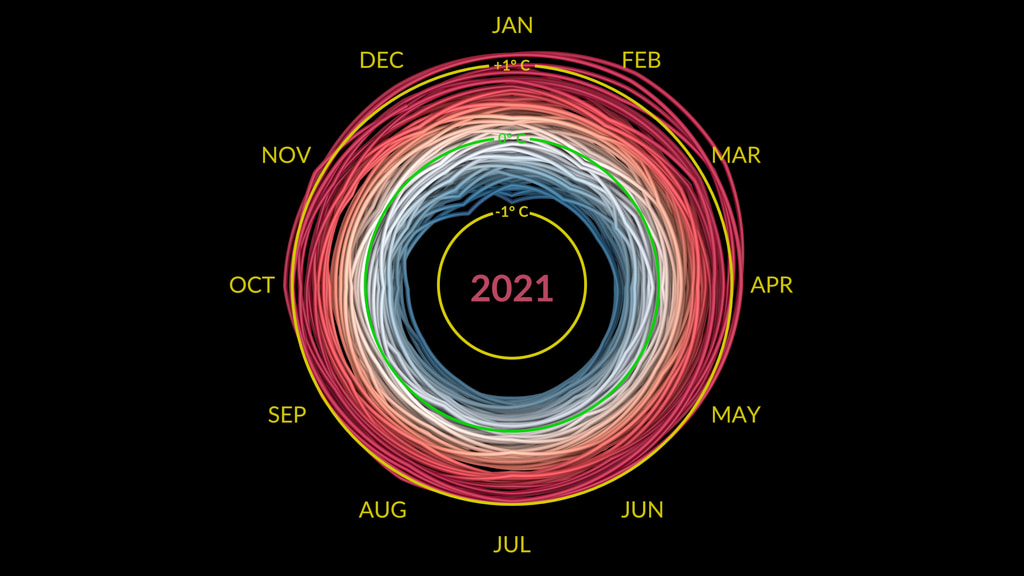
Global temperatures in 2024 were 2.30 degrees Fahrenheit (1.28 degrees Celsius) above the agency’s 20th-century baseline (1951-1980), which tops the record set in 2023. The new record comes after 15 consecutive months (June 2023 through August 2024) of monthly temperature records — an unprecedented heat streak.
NASA scientists further estimate Earth in 2024 was about 2.65 degrees Fahrenheit (1.47 degrees Celsius) warmer than the mid-19th century average (1850-1900). For more than half of 2024, average temperatures were more than 1.5 degrees Celsius above the baseline, and the annual average, with mathematical uncertainties, may have exceeded the level for the first time.
NASA's full dataset of global surface temperatures as well as full details with code of how NASA scientists conducted the analysis, are publicly available from GISS. GISS is a NASA laboratory managed by the Earth Sciences Division of the agency's Goddard Space Flight Center in Greenbelt, Maryland. The laboratory is affiliated with Columbia University's Earth Institute and School of Engineering and Applied Science in New York.
For more information about NASA's Earth science programs, visit: www.nasa.gov/earth
This color-coded map in Orthographic projection displays a progression of changing global surface temperature anomalies. Normal temperatures are shown in white. Higher than normal temperatures are shown in red and lower than normal temperatures are shown in blue. Normal temperatures are calculated over the 30 year baseline period 1951-1980. The maps are averages over a running 24 month window. The final frame represents global temperature anomalies in 2024.
Global Temperature Science On a Sphere Content
This map displays changing surface temperature anomalies from 1880 to 2024. It does not show absolute temperatures; instead, it shows how much warmer or cooler each region of Earth was compared to the average from 1951 to 1980. Average temperatures are shown in white, with higher-than-normal temperatures shown in red and lower-than-normal temperatures in blue. Earth’s global surface temperatures in 2024 were the warmest on record -- 1.28 degrees Celsius (2.30 degrees Fahrenheit) above the agency’s 20th-century baseline (1951–1980).

Colortable in both degrees Fahrenheit and degrees Celsius.
Credits
Please give credit for this item to:
NASA's Scientific Visualization Studio
Data provided by Robert B. Schmunk (NASA/GSFC GISS)
-
Scientists
-
Gavin A. Schmidt
(NASA/GSFC GISS)

-
Robert B Schmunk
(SIGMA Space Partners, LLC.)
-
Reto A. Ruedy
(SIGMA Space Partners, LLC.)
-
Gavin A. Schmidt
(NASA/GSFC GISS)
-
Public affairs officer
-
Peter H. Jacobs
(NASA/GSFC)
-
Peter H. Jacobs
(NASA/GSFC)
-
Visualizer
-
Mark SubbaRao
(NASA/GSFC)
-
Mark SubbaRao
(NASA/GSFC)
-
Writers
- Sally Younger (NASA/JPL)
- Jenny Marder Fadoul (Telophase)
Series
This page can be found in the following series:Datasets used
-
GISTEMP [GISS Surface Temperature Analysis (GISTEMP)]
ID: 585The GISS Surface Temperature Analysis version 4 (GISTEMP v4) is an estimate of global surface temperature change. Graphs and tables are updated around the middle of every month using current data files from NOAA GHCN v4 (meteorological stations) and ERSST v5 (ocean areas), combined as described in our publications Hansen et al. (2010), Lenssen et al. (2019), and Lenssen et al. (2024).
Credit: Lenssen, N., G.A. Schmidt, M. Hendrickson, P. Jacobs, M. Menne, and R. Ruedy, 2024: A GISTEMPv4 observational uncertainty ensemble. J. Geophys. Res. Atmos., 129, no. 17, e2023JD040179, doi:10.1029/2023JD040179.
This dataset can be found at: https://data.giss.nasa.gov/gistemp/
See all pages that use this dataset
Note: While we identify the data sets used on this page, we do not store any further details, nor the data sets themselves on our site.
Citing this page
Related
- ID: 5376
 Visualization
 - ID: 5451
 Visualization
 - ID: 5452
- ID: 14743
 Produced Video
 - ID: 5383
 Visualization
 - ID: 5311

- ID: 5327

- ID: 5209
 Visualization
 - ID: 5211
- ID: 5191
 Visualization
 - ID: 5161
 Visualization
 - ID: 5137
 Visualization
 - ID: 5065
- ID: 14327

- ID: 5057
 Visualization
 - ID: 5059
 Visualization
 - ID: 14273
 Produced Video
 - ID: 4978
 Visualization
 - ID: 4975
 Visualization
 - ID: 14069

- ID: 4961
 Visualization
 - ID: 4908
 Visualization
 - ID: 4891
- ID: 13791
 Produced Video
Newer Versions
- ID: 5603
 Visualization
Older Versions
- ID: 5207
 Visualization
 - ID: 5060
 Visualization
 - ID: 4964
 Visualization
 - ID: 4882
 Visualization
 - ID: 4626
 Visualization
 - ID: 4609
 Visualization
 - ID: 4252
 Visualization
 - ID: 4135
 Visualization
 - ID: 4030
 Visualization
Used as a Source In
- ID: 31168
 Hyperwall Visual
 - ID: 13909
 Produced Video
Release date
This page was originally published on Friday, January 10, 2025.
This page was last updated on Tuesday, January 20, 2026 at 12:19 AM EST.