New NASA Images Show Summer Melting In The Arctic Live Shots

Click HERE for quick link to audio soundbites.
Click for quick link to B-ROLL for these live shots
Click for quick link to canned interview with NASA Scientist Tom Neumann
Click for quick link to canned interview with NASA scientist Nathan Kurtz
Click for quick lin to canned interview in Spanish with NASA Scientist Edil Sepulveda
New NASA Images Show Melting As Summer Heat Bakes The Arctic
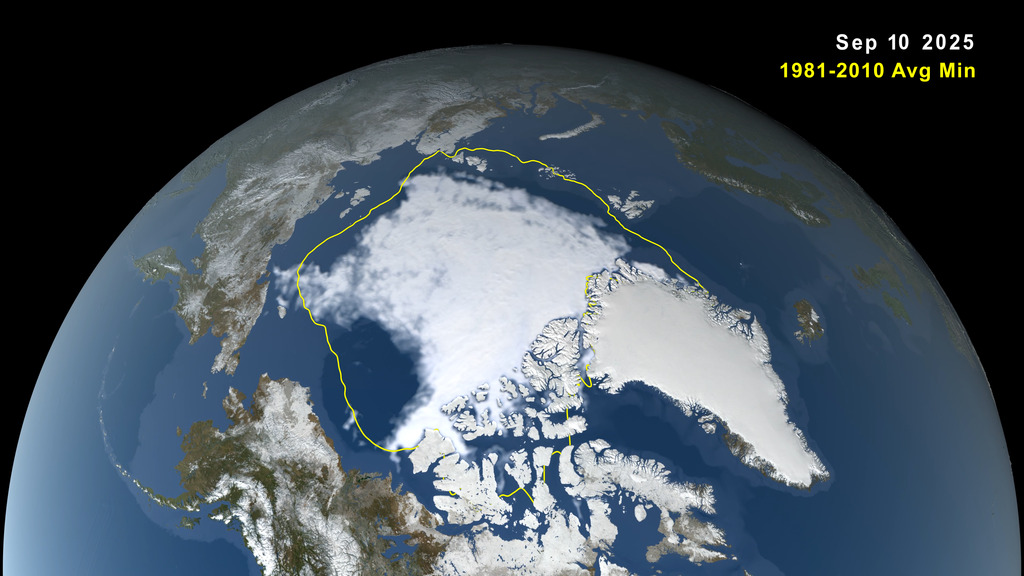
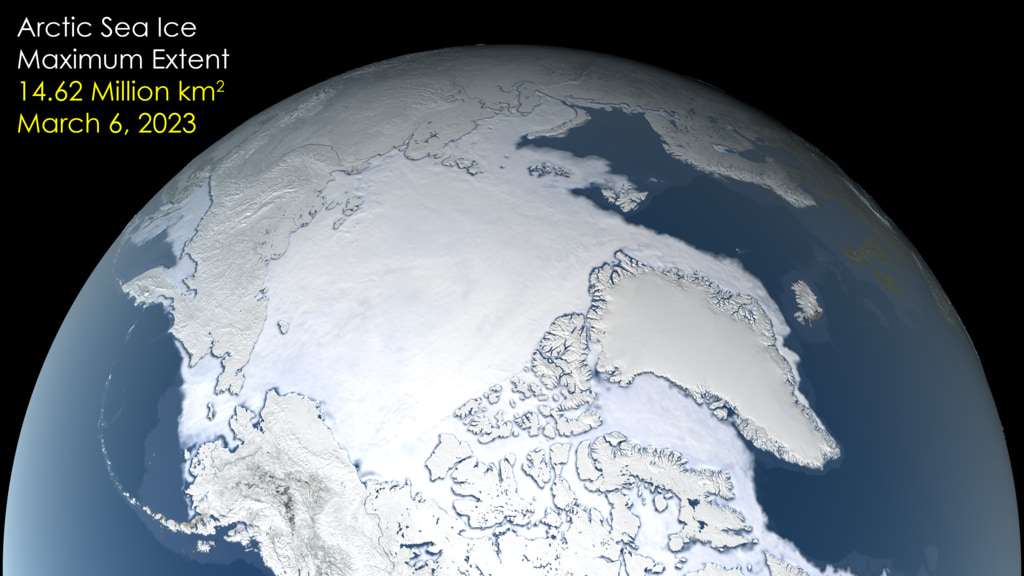
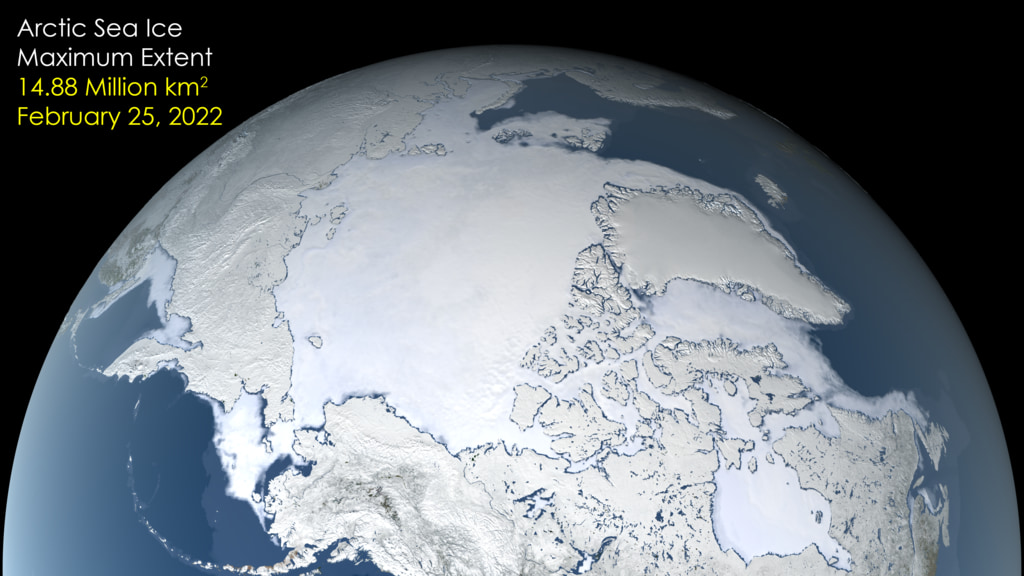
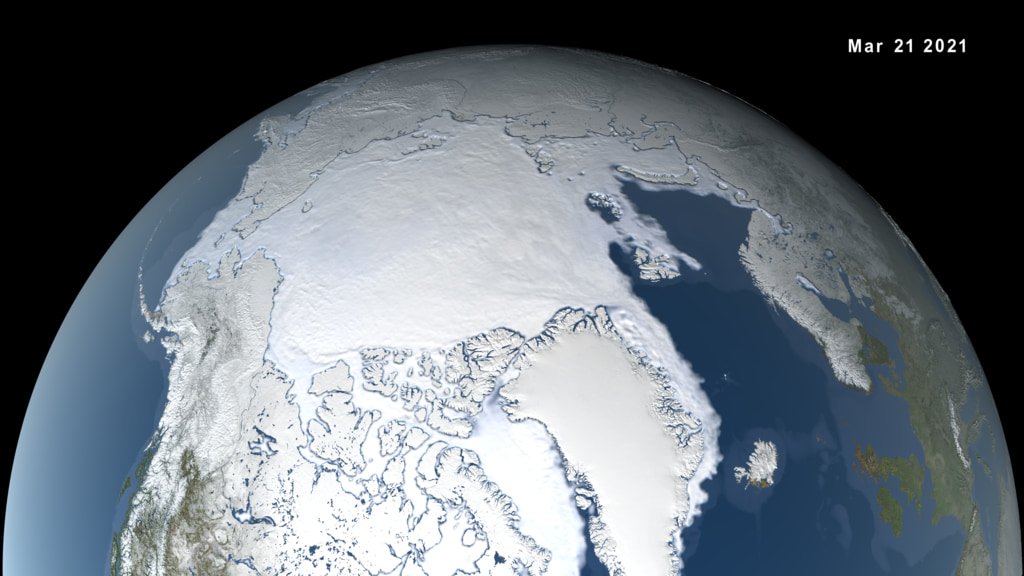
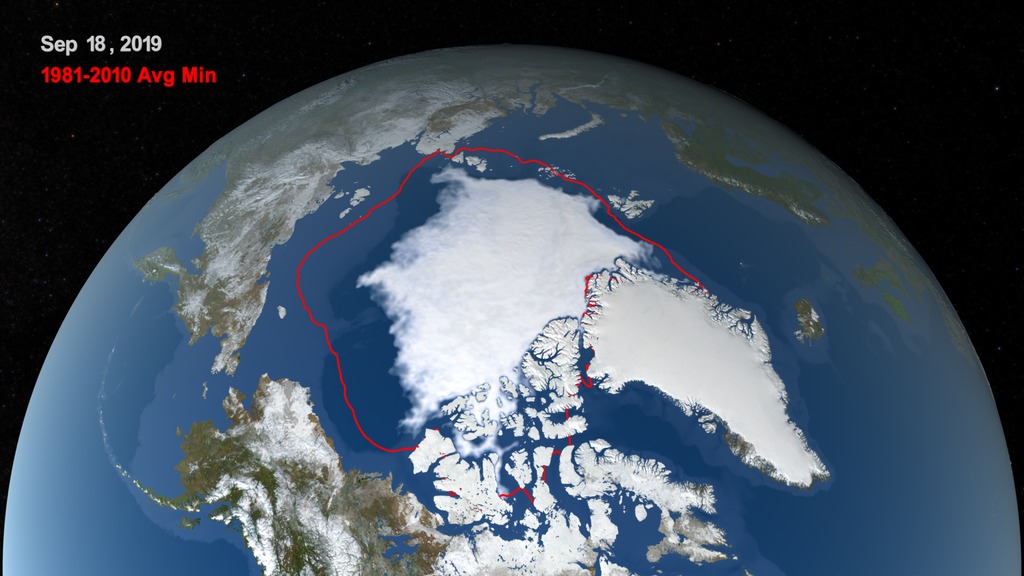
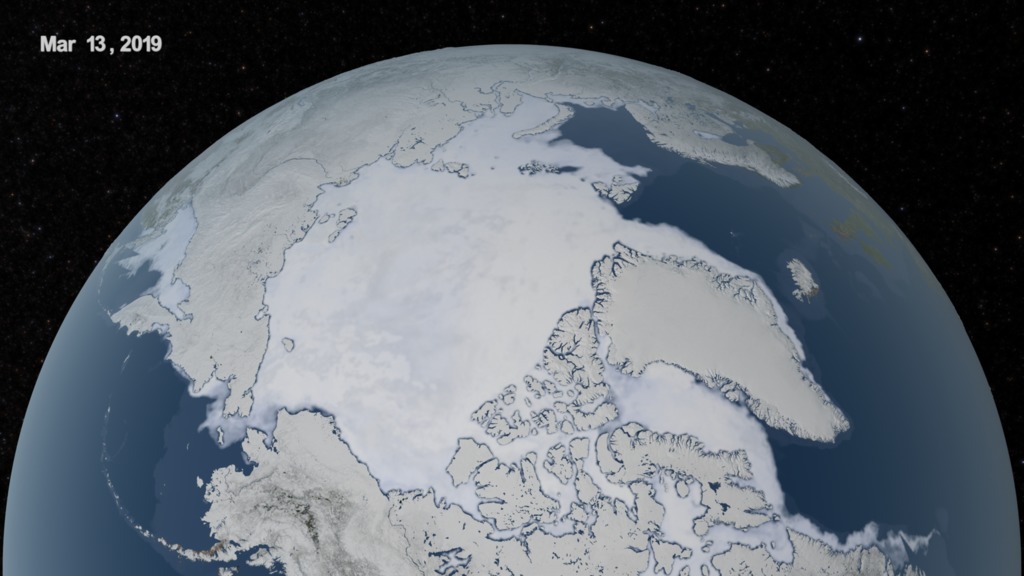
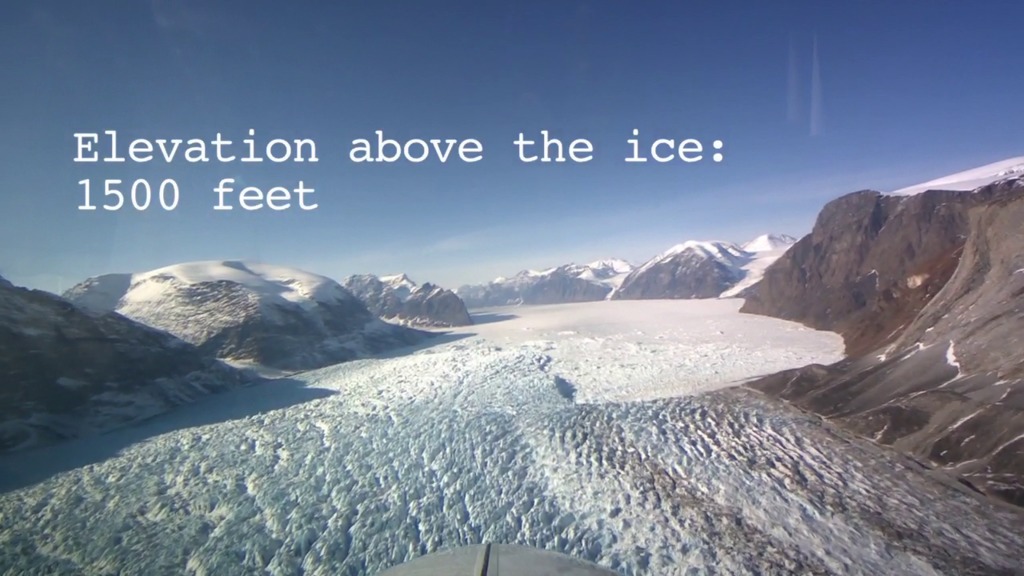
It’s been a summer of record temperatures — and even the world’s coldest places have felt the heat. As the high temperatures bake the Arctic, the Greenland ice sheet is experiencing extreme levels of ice loss. Ice on the sea surrounding the Arctic also continues to retreat.
Chat with NASA scientists on Friday, Sept. 6 from 6:00 a.m. to 12:00 p.m. EST to find out how the latest heatwave in Europe may impact the Arctic and how these dramatic changes in the Arctic can affect you.
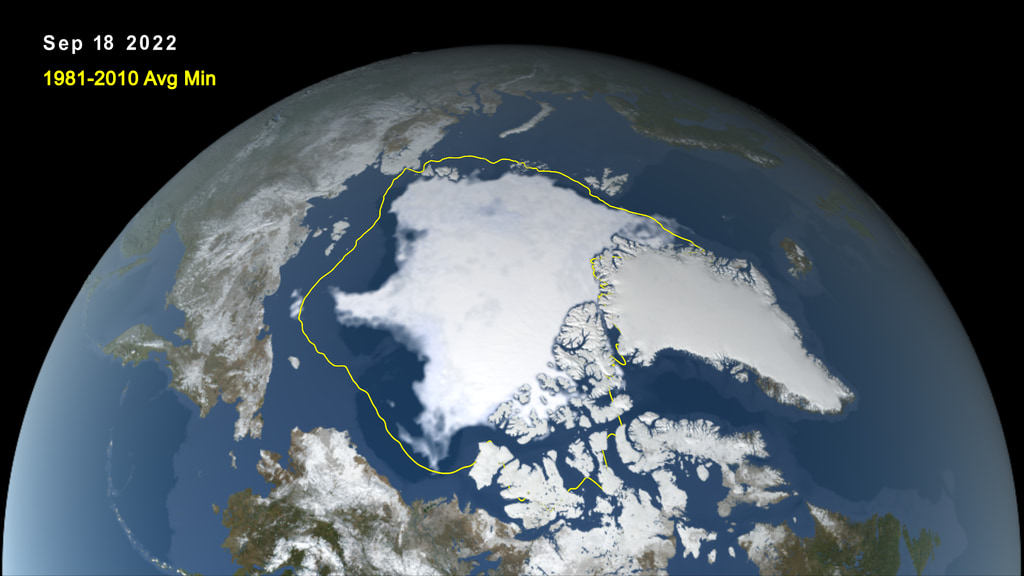
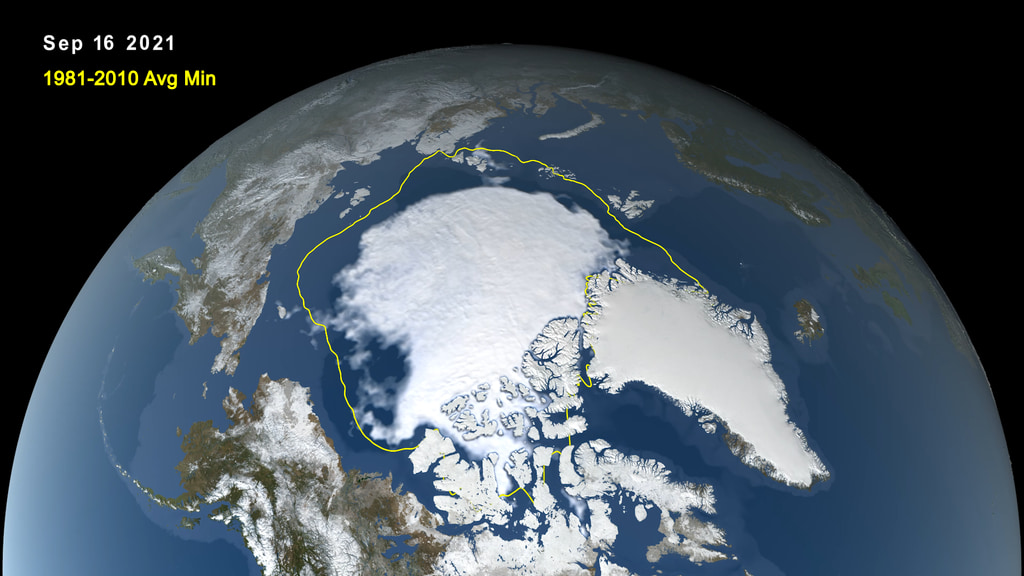
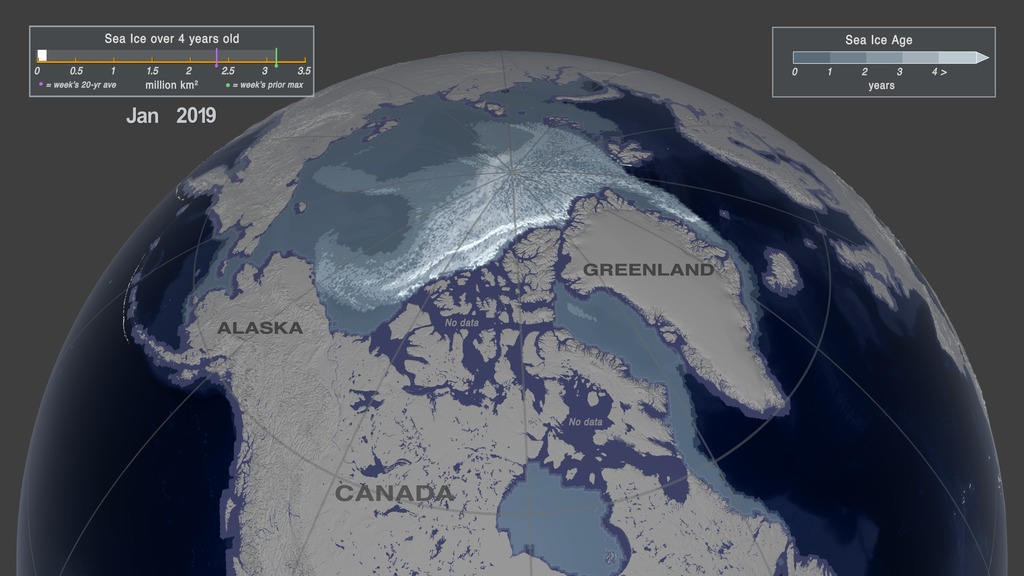
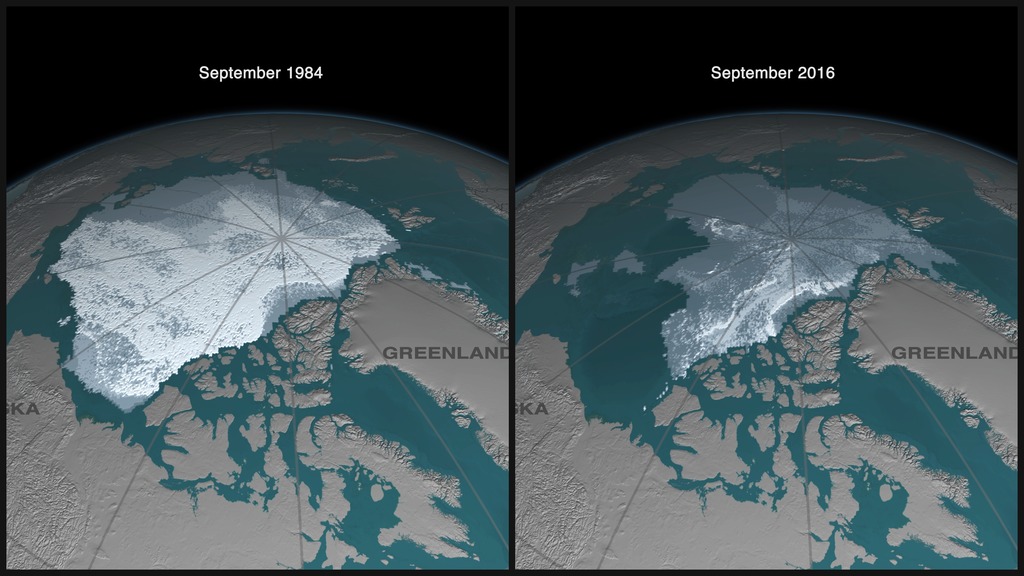
Arctic ice both on land and sea are melting at a rapid rate, and newer ice isn't sticking around for long. The rising temperatures are causing younger, thinner ice to cover less area than in the past. Since 1980, the Arctic has lost enough sea ice volume to equal all the water in Lake Superior — one of the largest lakes in the world.
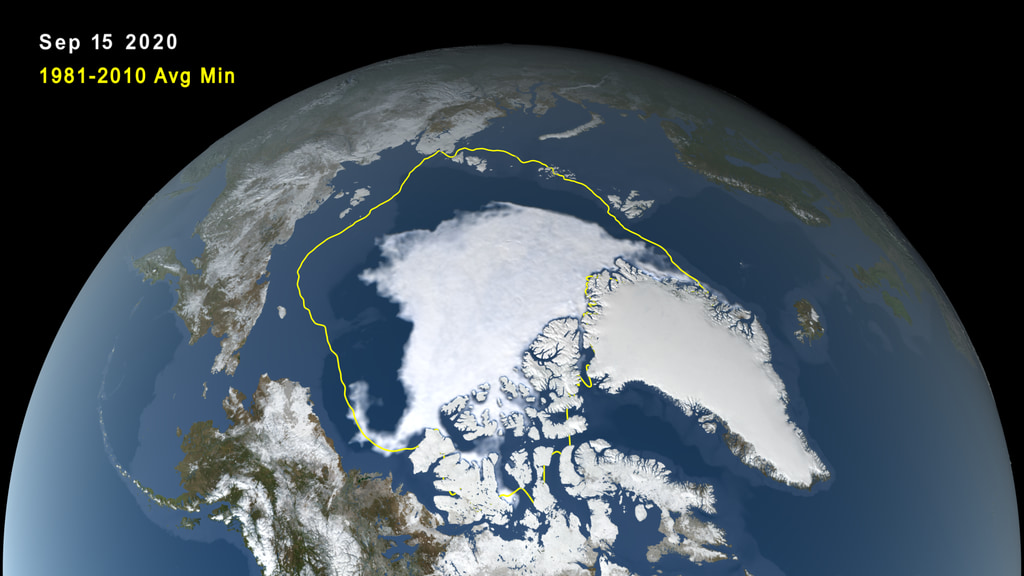
NASA is keeping a close eye on the Arctic from the ground, the air, and space to help understand how Arctic temperature change is affecting weather all around the globe. Whether 2019 will set a new record for Arctic ice loss remains to be seen, but it is tracking to be one of the top five lowest in the 40-year satellite record.
To schedule an interview, please fill out this form: https://forms.gle/x6CXSkYwAfZsPn1Z6
Interview Location: NASA’s Goddard Space Flight Center in Greenbelt, MD
Suggested Questions
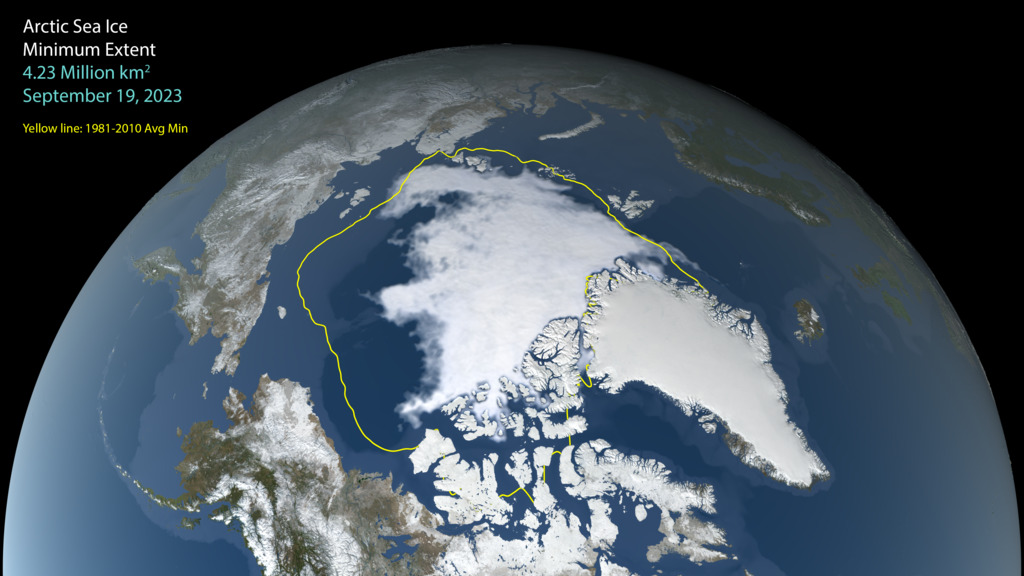
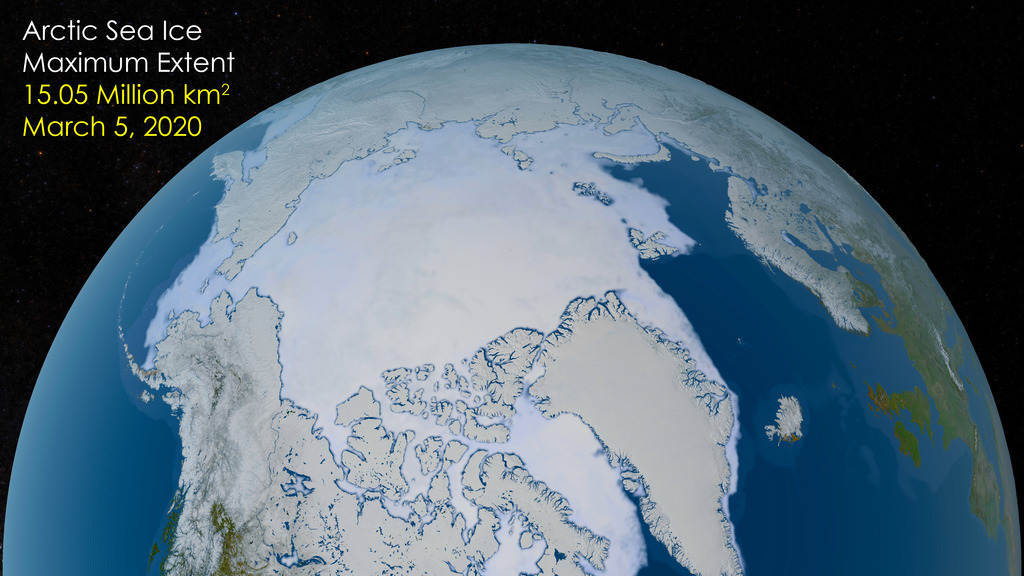
1. This summer has been unusually warm around the world, but particularly in the Arctic. What do the latest images show us about this year’s summer in the Arctic?
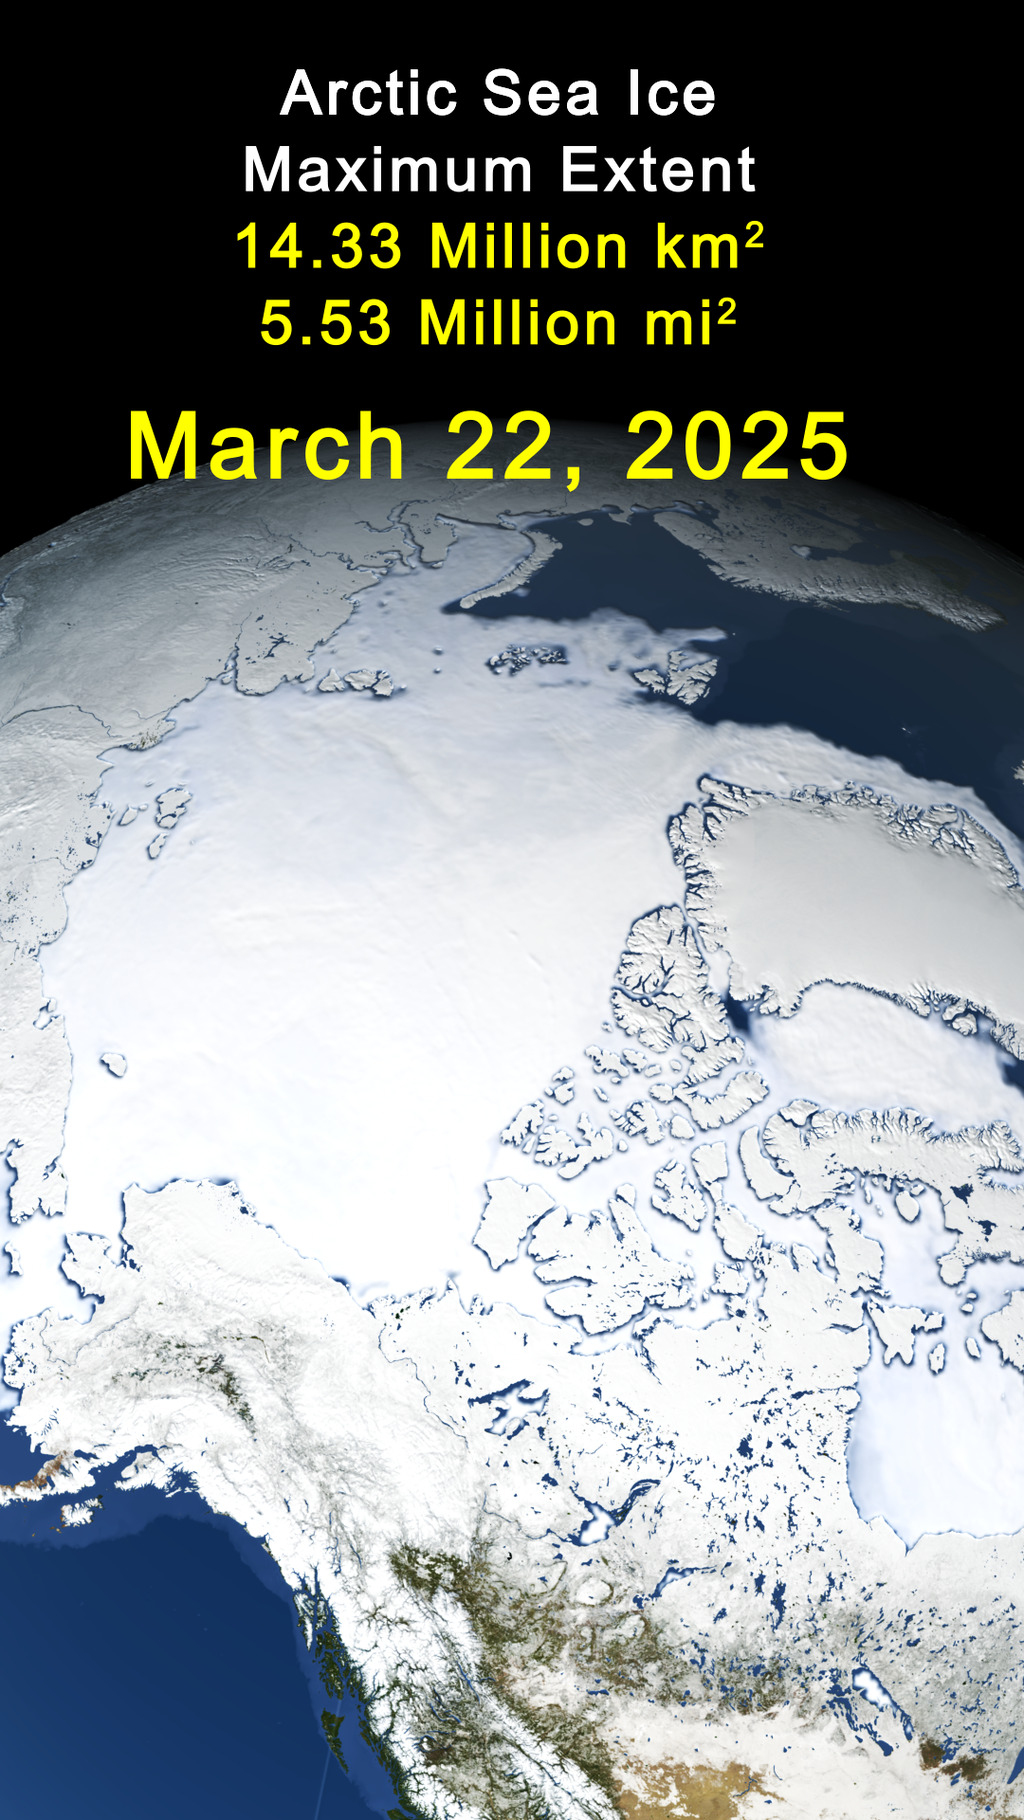
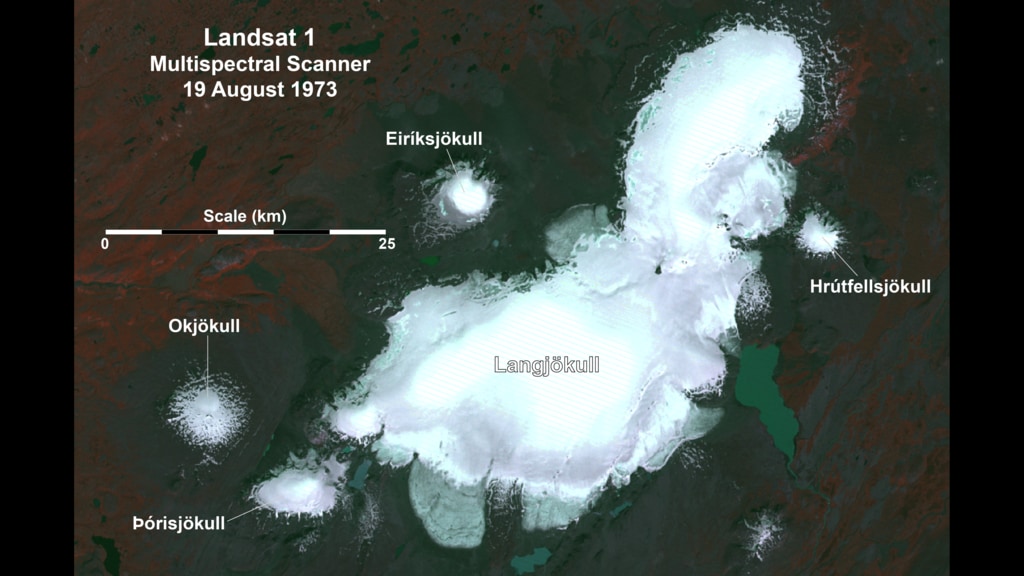
2. One of the biggest stories this summer was the extreme melting in Greenland. How unusual has this summer been for the glaciers on land?
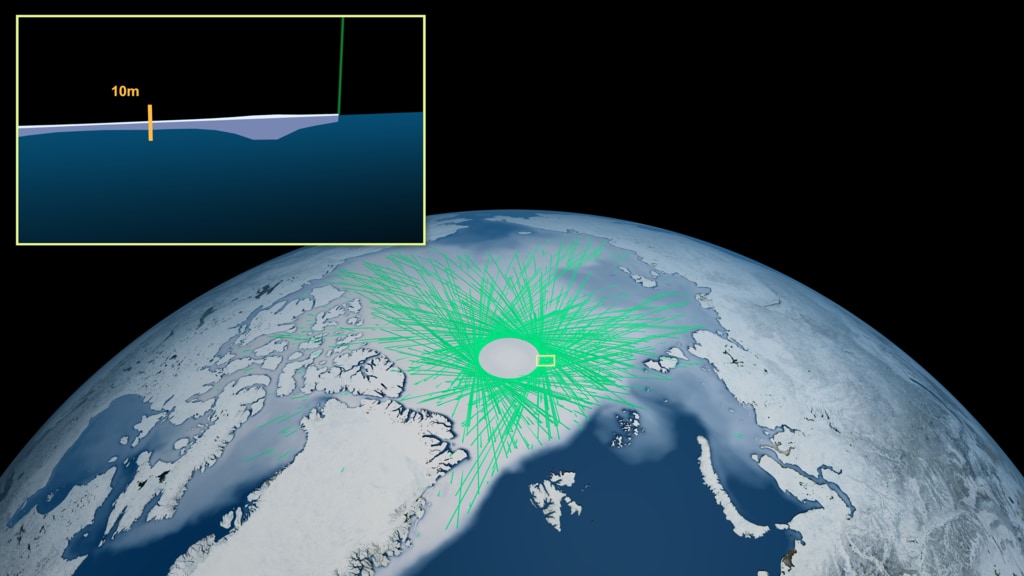
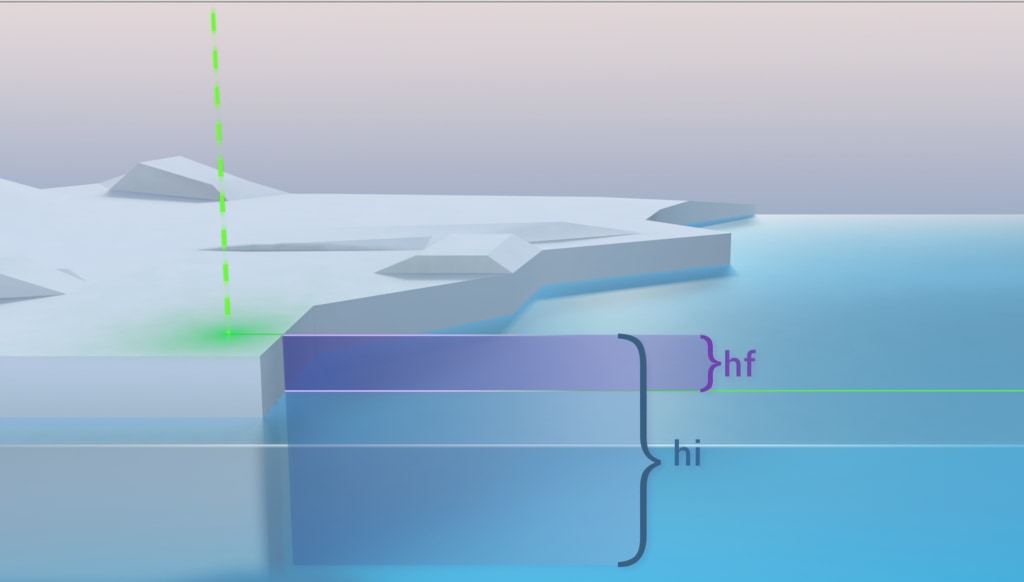
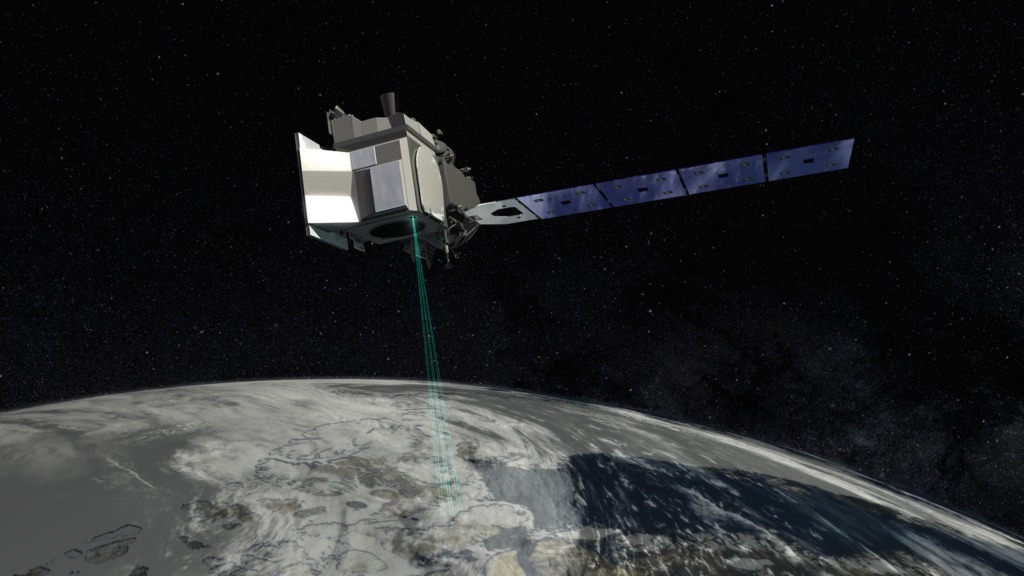
3. NASA’s newest Earth-observing satellite is measuring the sea ice thickness in the Arctic with unprecedented detail. What surprising things has it already discovered?
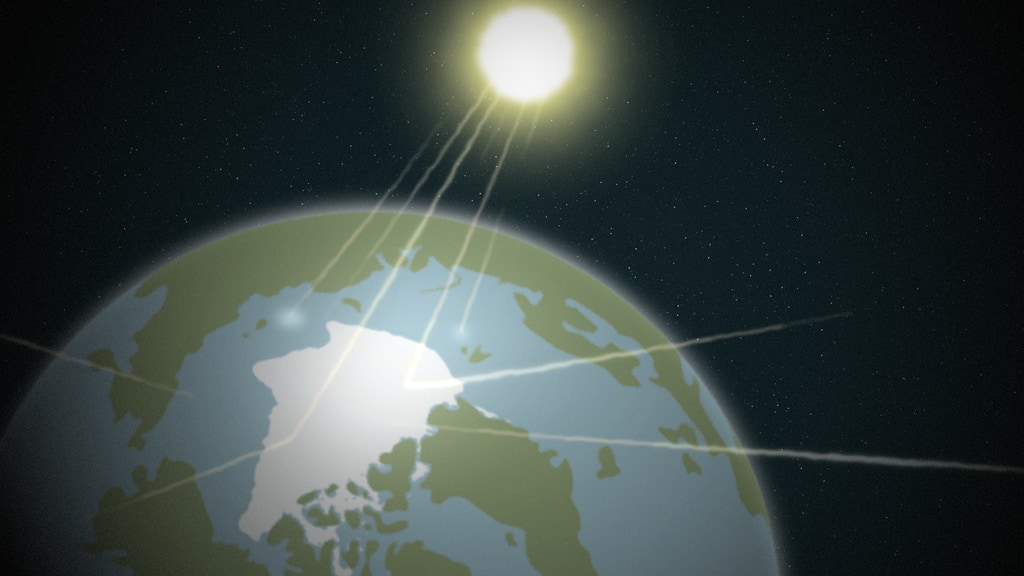
4.How do changes in the Arctic impact us when the Arctic is so far away?
5. Where can we learn more?
Satellite Coordinates: HD Satellite Coordinates for G17-K18/Lower:
Galaxy 17 Ku-band Xp 18 Slot Lower| 91.0 ° W Longitude | DL 12051.0 MHz | Vertical Polarity | QPSK/DVB-S | FEC 3/4 | SR 13.235 Mbps | DR 18.2954 MHz | HD 720p | Format MPEG2 | Chroma Level 4:2:0 | Audio Embedded
Questions? Contact michelle.z.handleman@nasa.gov or 301-286-0918
Check out this episode of NASA Explorers all about sea ice and why it's important.
Movies
- TomNeumannAudio.mp4 (1280x720) [7.5 MB]
- TomNeumannAudio.webm (1280x720) [14.8 MB]
Captions
- TomAudio.en_US.srt [2.9 KB]
- TomAudio.en_US.vtt [2.8 KB]
Images
- TomAudio.png (1280x720) [229.8 KB]
- TomNeumannAudio.00001_print.jpg (1024x576) [68.8 KB]
- TomNeumannAudio.00001_thm.png (80x40) [6.2 KB]
- TomNeumannAudio.00001_searchweb.png (320x180) [55.6 KB]
- TomNeumannAudio.00001_web.png (320x180) [55.6 KB]
NASA scientist Tom Neumann discusses sea ice loss in the Arctic.
Complete transcript available.
B-roll for Sea Ice Live Shot.
Canned interview with Tom Neumann TRT 4:45
Canned interview with Nathan Kurtz. TRT 4:24
Canned interview in Spanish with Edil Sepulveda
For More Information
Credits
Please give credit for this item to:
NASA's Goddard Space Flight Center
Producers
- Courtney A. Lee (ADNET)
- Isabelle Yan (NASA/GSFC)
- Katie Atkinson (ADNET)
- Madison Arnold (NASA/GSFC)
- Michelle Handleman (KBRwyle)
Series
This visualization can be found in the following series:Related pages
Arctic Sea Ice Maximum 2023
March 15th, 2023
Read moreArctic sea ice maximum, March 6, 2023 Animation of arctic sea ice from the September 18, 2022 minimum to the the March 6, 2023 maximum
Arctic Sea Ice Minimum 2022
Sept. 22nd, 2022
Read moreSatellite-based passive microwave images of the sea ice have provided a reliable tool for continuously monitoring changes in the Arctic ice since 1979. Every summer the Arctic ice cap melts down to what scientists call its "minimum" before colder weather begins to cause ice cover to increase. An analysis of satellite data by NASA and the National Snow and Ice Data Center (NSIDC) at the University of Colorado Boulder shows that the 2021 minimum extent, which was likely reached on Sept. 18, measured 1.80 million square miles (4.67 million square kilometers).The Japan Aerospace Exploration Agency (JAXA) provides many water-related products derived from data acquired by the Advanced Microwave Scanning Radiometer 2 (AMSR2) instrument aboard the Global Change Observation Mission 1st-Water "SHIZUKU" (GCOM-W1) satellite. Two JAXA datasets used in this animation are the 10-km daily sea ice concentration and the 10 km daily 89 GHz Brightness Temperature.In this animation, the daily Arctic sea ice and seasonal land cover change progress through time, from the yearly maximum ice extent on February 25 2022, through its minimum on September 18 2022. Over the water, Arctic sea ice changes from day to day showing a running 3-day minimum sea ice concentration in the region where the concentration is greater than 15%. The blueish white color of the sea ice is derived from a 3-day running minimum of the AMSR2 89 GHz brightness temperature. The yellow boundary shows the minimum extent averaged over the 30-year period from 1981 to 2010. Over the terrain, monthly data from the seasonal Blue Marble Next Generation fades slowly from month to month. Arctic Sea Ice Minimum 2022, Animation Arctic Sea Ice Minimum 2022, Print Resolution Still Related pages
Arctic Sea Ice Maximum 2022
March 22nd, 2022
Read moreArctic sea ice maximum, February 25, 2022 Animation of arctic sea ice from the September 16, 2021 minimum to the the February 25, 2022 maximum After growing through the fall and winter, sea ice in the Arctic appears to have reached its annual maximum extent. The image above shows the ice extent—defined as the total area in which the ice concentration is at least 15 percent—at its 2022 maximum, which occurred on February 25, tying with 2015 for the third earliest maximum on record. On this day the extent of the Arctic sea ice cover peaked at 14.88 million square kilometers (5.75 million square miles), making it the tenth lowest yearly maximum extent on record. Related pages
Arctic Sea Ice Minimum 2021
Sept. 22nd, 2021
Read moreArctic Sea Ice Minimum 2021, Animation Arctic Sea Ice Minimum 2021, 4K Animation Sea Ice Minimum 2021, Sept. 16 Only, 4K Animation Arctic Sea Ice Minimum 2021, Print-Resolution Still Satellite-based passive microwave images of the sea ice have provided a reliable tool for continuously monitoring changes in the Arctic ice since 1979. Every summer the Arctic ice cap melts down to what scientists call its "minimum" before colder weather begins to cause ice cover to increase. An analysis of satellite data by NASA and the National Snow and Ice Data Center (NSIDC) at the University of Colorado Boulder shows that the 2021 minimum extent, which was likely reached on Sept. 16, measured 1.82 million square miles (4.72 million square kilometers).The Japan Aerospace Exploration Agency (JAXA) provides many water-related products derived from data acquired by the Advanced Microwave Scanning Radiometer 2 (AMSR2) instrument aboard the Global Change Observation Mission 1st-Water "SHIZUKU" (GCOM-W1) satellite. Two JAXA datasets used in this animation are the 10-km daily sea ice concentration and the 10 km daily 89 GHz Brightness Temperature.In this animation, the daily Arctic sea ice and seasonal land cover change progress through time, from the yearly maximum ice extent on March 21 2021, through its minimum on September 16 2021. Over the water, Arctic sea ice changes from day to day showing a running 3-day minimum sea ice concentration in the region where the concentration is greater than 15%. The blueish white color of the sea ice is derived from a 3-day running minimum of the AMSR2 89 GHz brightness temperature. The yellow boundary shows the minimum extent averaged over the 30-year period from 1981 to 2010. Over the terrain, monthly data from the seasonal Blue Marble Next Generation fades slowly from month to month. The faint circle that appears periodically close to the pole is an artifact of the visualization process, and does not represent a real feature. Related pages
Arctic Sea Ice Maximum 2021
March 30th, 2021
Read more2021 Arctic Sea Ice Maximum Extent, Animation, With Dates 2021 Arctic Sea Ice Maximum Extent, Print-Size Image 2021 Arctic Sea Ice Maximum Extent, Animation, No Dates 2021 Arctic Sea Ice Maximum Extent, Animation, Dates Only After growing through the fall and winter, sea ice in the Arctic appears to have reached its annual maximum extent. The image above shows the ice extent—defined as the total area in which the ice concentration is at least 15 percent—at its 2021 maximum, which occurred on March 21. On this day the extent of the Arctic sea ice cover peaked at 14.77 million square kilometers (5.70 million square miles), making it the seventh lowest yearly maximum extent on record. Related pages
Arctic Sea Ice Minimum 2020
Sept. 21st, 2020
Read moreAnimation of Arctic sea ice extent from the Mar. 5, 2020 maximum to the Sept. 15, 2020 minimum, 30-year average extents in yellow Animation of Arctic sea ice extent from the Mar. 5, 2020 maximum to the Sept. 15, 2020 minimum, 30-year average extents in yellow, no text Animation of Arctic sea ice extent from the Mar. 5, 2020 maximum to the Sept. 15, 2020 minimum, no average, no text Animation of Arctic sea ice extent from the Mar. 5, 2020 maximum to the Sept. 15, 2020 minimum, 30-year average extents in red Arctic sea ice minimum, Sept. 15 2020, with labels, 30-year average extents in yellow, print resolution Arctic sea ice minimum, Sept. 15 2020, with labels, 30-year average extents in red, print resolution Arctic sea ice minimum, Sept. 15 2020, no labels, print resolution Satellite-based passive microwave images of the sea ice have provided a reliable tool for continuously monitoring changes in the Arctic ice since 1979. Every summer the Arctic ice cap melts down to what scientists call its "minimum" before colder weather begins to cause ice cover to increase. The extent of Arctic sea ice at the end of this summer was the second lowest since satellite monitoring began. An analysis of satellite data by NASA and the National Snow and Ice Data Center (NSIDC) at the University of Colorado Boulder shows that the 2020 minimum extent, which was likely reached on Sept. 15, measured 1.44 million square miles (3.74 million square kilometers).The Japan Aerospace Exploration Agency (JAXA) provides many water-related products derived from data acquired by the Advanced Microwave Scanning Radiometer 2 (AMSR2) instrument aboard the Global Change Observation Mission 1st-Water "SHIZUKU" (GCOM-W1) satellite. Two JAXA datasets used in this animation are the 10-km daily sea ice concentration and the 10 km daily 89 GHz Brightness Temperature.In this animation, the daily Arctic sea ice and seasonal land cover change progress through time, from the yearly maximum ice extent on March 5 2020, through its minimum on September 15 2020. Over the water, Arctic sea ice changes from day to day showing a running 3-day minimum sea ice concentration in the region where the concentration is greater than 15%. The blueish white color of the sea ice is derived from a 3-day running minimum of the AMSR2 89 GHz brightness temperature. The red boundary shows the minimum extent averaged over the 30-year period from 1981 to 2010. Over the terrain, monthly data from the seasonal Blue Marble Next Generation fades slowly from month to month. The faint circle that appears periodically close to the pole is an artifact of the visualization process, and does not represent a real feature. Related pages
Arctic Sea Ice Maximum 2020
March 20th, 2020
Read moreArctic Sea Ice Maximum Extent 2020, With Labels Arctic Sea Ice Maximum Extent 2020, No Labels After growing through the fall and winter, sea ice in the Arctic appears to have reached its annual maximum extent. The image above shows the ice extent—defined as the total area in which the ice concentration is at least 15 percent—at its 2020 maximum, which occurred on March 5. On this day the extent of the Arctic sea ice cover peaked at 15.05 million square kilometers (5.81 million square miles). While this maximum was the largest since 2013, it remained 590,000 square kilometers (230,000 square miles) below the average maximum for the 1981-2010 period. Related pages
Weekly Arctic Sea Ice Age with Graph of Ice Age By Area: 1984 - 2019
Sept. 30th, 2019
Read moreThis visualization shows the age of the Arctic sea ice between 1984 and 2019. Younger sea ice, or first-year ice, is shown in a dark shade of blue while the ice that is four years old or older is shown as white. A graph displayed in the upper left corner quantifies the area covered sea ice 4 or more years old in millions of square kilometers.This video is also available on our YouTube channel. This is the same visualization as above without the graph except that this animation has been updated through the end of August, 2019.This video is also available on our YouTube channel. Pair 1A: This image shows the Arctic sea ice age in September 2019 when the sea ice reached its annual minimum extent (week 38). During this week, the area covered by the sea ice that was 4 years of age or older extended 53,000 square kilometers. Pair 1B: This image shows the Arctic sea ice age in September 1984 (week 38). During this week, the area covered by the sea ice that was 4 years of age or older extended 2,687,000 square kilometers. Pair 2A: This image shows the Arctic sea ice age in August, 2019 (week 34). During this week, the area covered by the sea ice that was 4 years of age or older extended 59,000 square kilometers. Pair 2B: This image shows the Arctic sea ice age in August, 1987 (week 34). During this week, the area covered by the sea ice that was 4 years of age or older extended 2,639,000 square kilometers. Pair 3A: This image shows the Arctic sea ice age in the first week (week 1) of January, 2019. During this week, the area covered by the sea ice that was 4 years of age or older extended 116,000 square kilometers. Pair 3B: This image shows the Arctic sea ice age in the first week (week 1) of January, 1988. During this week, the area covered by the sea ice that was 4 years of age or older extended 3,121,000 square kilometers. Pair 4A: This image shows the Arctic sea ice age in April, 2019 (week 15). During this week, the area covered by the sea ice that was 4 years of age or older extended 89,000 square kilometers. Pair 4B: This image shows the Arctic sea ice age in April, 1986 (week 15). During this week, the area covered by the sea ice that was 4 years of age or older extended 2,791,000 square kilometers Pair 5A: This image shows the Arctic sea ice age in October, 2018 (week 42). During this week, the area covered by the sea ice that was 4 years of age or older extended 132,000 square kilometers. Pair 5B: This image shows the Arctic sea ice age in October, 1985 (week 42). During this week, the area covered by the sea ice that was 4 years of age or older extended 2,879,000 square kilometers. This layer shows only the sea ice age with transparency on the Earth with no text labels, dates, graph or colorbar. All of these components are in a separate layer below. The overlay layer with the graph, colorbar, date and text labels with transparency One significant change in the Arctic region in recent years has been the rapid decline in perennial sea ice. Perennial sea ice, also known as multi-year ice, is the portion of the sea ice that survives the summer melt season. Perennial ice may have a life-span of nine years or more and represents the thickest component of the sea ice; perennial ice can grow up to four meters thick. By contrast, first year ice that grows during a single winter is generally at most two meters thick.Above is a visualization of the weekly sea ice age between 1984 and 2019. The animation shows the seasonal variability of the ice, growing in the Arctic winter and melting in the summer. In addition, this also shows the changes from year to year, depicting the age of the sea ice in different colors. Younger sea ice, or first-year ice, is shown in a dark shade of blue while the ice that is over four years old is shown as white. A color scale identifies the age of the intermediary years.Note that data for the sea ice age is not available along the coastlines. The region where data is not available is shown in a dark lavender color.A graph in the upper left corner the quantifies the change over time by showing the area covered by sea ice that is 4 years old or older in millions of square kilometers. This graph also includes a memory bar - the green line that indicates the maximum value seen thus far in the animation for the given week being displayed. For example, when viewing the sea ice age for the first week in September, the memory bar will display the maximum value seen for the first week of September in all prior years from the beginning of the animation (1984). In addition, a violet bar indicates the average area covered by sea ice greater than 4 years of age during the the 20-year time period from 1984 through 2003.Below are matching pairs of images showing identical weeks in two different years, where one year is late in the time series and the other is early. These matched images are labeled Pair 1A and Pair 1B. The caption below the image provides additional details. Each image is available with and without the graph. Related pages
Arctic Sea Ice Minimum 2019
Sept. 23rd, 2019
Read moreArctic Sea Ice Minimum 2019, Animation Arctic Sea Ice Minimum 2019, Print Resolution Still Arctic Sea Ice Minimum 2019, No Labels, Animation Arctic Sea Ice Minimum 2019, Dates Only Satellite-based passive microwave images of the sea ice have provided a reliable tool for continuously monitoring changes in the Arctic ice since 1979. Every summer the Arctic ice cap melts down to what scientists call its "minimum" before colder weather begins to cause ice cover to increase. The extent of Arctic sea ice at the end of this summer was effectively tied with 2007 and 2016 for second lowest since satellite monitoring began. An analysis of satellite data by NASA and the National Snow and Ice Data Center (NSIDC) at the University of Colorado Boulder shows that the 2019 minimum extent, which was likely reached on Sept. 18, measured 1.60 million square miles (4.15 million square kilometers).The Japan Aerospace Exploration Agency (JAXA) provides many water-related products derived from data acquired by the Advanced Microwave Scanning Radiometer 2 (AMSR2) instrument aboard the Global Change Observation Mission 1st-Water "SHIZUKU" (GCOM-W1) satellite. Two JAXA datasets used in this animation are the 10-km daily sea ice concentration and the 10 km daily 89 GHz Brightness Temperature.In this animation, the daily Arctic sea ice and seasonal land cover change progress through time, from the yearly maximum ice extent on March 13, 2019, through its minimum on September 18, 2019. Over the water, Arctic sea ice changes from day to day showing a running 3-day minimum sea ice concentration in the region where the concentration is greater than 15%. The blueish white color of the sea ice is derived from a 3-day running minimum of the AMSR2 89 GHz brightness temperature. Over the terrain, monthly data from the seasonal Blue Marble Next Generation fades slowly from month to month. Related pages
Measuring Sea Ice Thickness with ICESat-2
Sept. 5th, 2019
Read moreThis visualization depicts sea ice thickness in the Arctic Ocean as measured by ICESat-2 over the course of several months. The visualization begins with a global view of the north pole as individual tracks are drawn over time representing each time the satellite passes overhead and collects sea ice data. A closeup view of one track is revealed, showing how the ICESat-2 laser can measure ice freeboard (height above sea level), which can be used to calculate total ice thickness. The visualization concludes by showing monthly average of sea ice thickness from November 2018 to March 2019. ICESat-2 tracks over the Arctic Ocean spanning from November 2018 to March 2019. A view of the Arctic Ocean with monthly average sea ice thickness spanning November 2018 to March 2019. Low values are depicted in light blue, and higher values (5 meters) are depicted in magenta. Close up view of a single ICESat-2 track. The light grey section of the track represented ice freeboard (height above sea level) and the darker grey represents sea ice below the ocean surface. A 10m orange line is shown for scale. One of the big challenges in polar science is measuring the thickness of the floating sea ice that blankets the Arctic and Southern Oceans. Newly formed sea ice might be only a few inches thick, whereas sea ice that survives several winter seasons can grow to several feet in thickness (over ten feet in some places). Sea ice thickness is typically estimated by first measuring sea ice freeboard - how much of the floating ice can be observed above sea level. Sea ice floats slightly above sea level because it is less dense than water. NASA’s ICESat-2 satellite measures the Earth’s surface height by firing green laser pulses towards Earth and timing how long it takes for those laser pulses to reflect back to the satellite. Ice freeboard is calculated by differencing the heights of the ice surface and areas of open water next to the ice. Additional information including the depth and density of the snow layer on top of the ice is needed to convert this freeboard measurement to sea ice thickness. New state-of-the-art snow accumulation models have been developed to provide this extra data in preparation for the launch of ICESat-2. The very high precision of the ICESat-2 laser has enabled us for to measure the thickness of very thin sea ice for the first time. As the Arctic warms rapidly it is becoming increasingly dominated by a younger and thinner ice cover, making these new measurements extremely invaluable for understanding our changing polar regions. Related pages
Albedo Animation
Sept. 5th, 2019
Read moreFull albedo sequence As this ice begins to melt, less sunlight gets reflected into space. It is instead absorbed into the oceans and land, raising the overall temperature, and fueling further melting. This is a conceptual animation showing how polar ice reflects light from the sun. Related pages
Landsat View of a Disappearing Glacier in Iceland
Aug. 13th, 2019
Read moreThe total loss of a small glacier atop a volcanic peak in west, central Iceland in 2014 led to the creation of this imagery series showing ice area changes during the past ~46 years. The loss of Okjökull (Ok Glacier) was announced by Oddur Sigurðsson in 2014 based on his many years observing the island’s glaciers and ice caps for the Icelandic Meteorological Office. On 18 August 2019, a memorial will be placed on top of the area where Okjökull’s ice once flowed.In the Landsat images here, you can see not only the disappearance of Okjökull but ice area losses to the other small ice caps nearby and also the retreat of larger glaciers flowing from the main ice cap in the area, Langjökull. The impact of ash deposition from eruptions two of Iceland’s many volcanoes is also evident (Hekla, February 2000 and Eyjafjallajökull, in April 2010). The highest point in the area is on the north side of Langjökull and is about 1,450 m (4,760 ft) above sea level.Location names from:Geographic Names of Iceland’s Glaciers: Historic and ModernBy Oddur Sigurðsson and Richard S. Williams, Jr.https://pubs.usgs.gov/pp/1746/pdf/PP1746_pg1-42_fig1-10_lowrez.pdf Ice loss from 1973 to 2019 locator map Related pages
Modeling the Future of the Greenland Ice Sheet
June 19th, 2019
Read moreMusic: Tides by Jon Cotton [PRS], Ben Niblett [PRS]Complete transcript available. Scientists at the University of Alaska Fairbanks’ Geophysical Institute used data from NASA’s Operation IceBridge to develop a more accurate model of how the Greenland Ice Sheet might respond to climate change in the future, finding that it could generate more sea level rise than previously thought.In the next 50 years, the model shows that melting at the present rate could contribute one to four inches to global sea level rise. This number jumps to five to13 inches by 2100 and 19 to 63 inches by 2200. These numbers are considerably higher than previous estimates, which forecasted up to 35 inches of sea level rise by 2200The updated model is the first to include outlet glaciers — river-like bodies of ice that connect to the ocean. Outlet glaciers play a key role in how ice sheets melt, but previous models lacked the data to adequately represent their complex flow patterns. The study found that melting outlet glaciers could account for up to 40% of the ice mass lost from Greenland in the next 200 years.By incorporating ice thickness data from IceBridge and identifying sources of statistical uncertainty within the model, the study creates a more accurate picture of how human-generated greenhouse gas emissions and a warming climate may affect Greenland in the future Related pages
Arctic Sea Ice Maximum 2019
March 20th, 2019
Read moreAnimation of Arctic sea ice extent between its minimum on September 23, 2018 and its maximum on March 13, 2019. Animation of Arctic sea ice extent between its minimum on September 23, 2018 and its maximum on March 13, 2019, no dates Dates only After growing through the fall and winter, sea ice in the Arctic appears to have reached its annual maximum extent. The 2019 wintertime extent ties with 2007’s as the 7th smallest extent of winter sea ice in the satellite record, according to scientists at the NASA-supported National Snow and Ice Data Center (NSIDC) and NASA. On March 13, the extent of the Arctic sea ice cover peaked at 5.71 million square miles (14.78 million square kilometers). This winter’s maximum extent is 332,000 square miles (860,000 square kilometers) below the 1981 to 2010 average maximum – equivalent to missing an area of ice larger than the state of Texas. Related pages
Arctic Sea Ice Cover Is the Thinnest and Youngest It's Been in 60 Years
Oct. 11th, 2018
Read moreMusic: Galore by Lee Groves [PRS], Peter George Marett [PRS]Complete transcript available. Working from a combination of satellite records and declassified submarine sonar data, NASA scientists have constructed a 60-year record of Arctic sea ice thickness. Right now, Arctic sea ice is the youngest and thinnest its been since we started keeping records. More than 70 percent of Arctic sea ice is now seasonal, which means it grows in the winter and melts in the summer, but doesn't last from year to year. This seasonal ice melts faster and breaks up easier, making it much more susceptible to wind and atmospheric conditions. Related pages
ICESat-2 Measures Sea Ice Thickness
Aug. 22nd, 2018
Read moreAnimation showing how ICESat-2 will measure the height of sea ice freeboard (hf) – the portion of sea ice floating above the water – to estimate sea ice thickness (hi). ICESat-2 will measure heights or elevations. In order to derive sea ice thickness from those measurements, it will compare the height of the ice with the height of the adjacent open water. The difference is height is the portion of the ice that is above the sea level, called freeboard. Because roughly 1/10 of the ice floe is above water we can calculate its thickness. Very often the only open water nearby is from cracks in the ice (leads) that open and close quickly as the ice drifts about in the polar oceans pushed by ocean currents and winds. Related pages
Disappearing Ice
March 12th, 2018
Read moreThis visualization begins by showing the dynamic beauty of the Arctic sea ice as it responds to winds and ocean currents. Research into the behavior of the Arctic sea ice for the last 30 years has led to a deeper understanding of how this ice survives from year to year. In the animation that follows, age of the sea ice is visible, showing the younger ice in darker shades of blue and the oldest ice in brighter white. This visual representation of the ice age clearly shows how the quantity of older and thicker ice has changed between 1984 and 2016.Complete transcript available.This video is also available on our YouTube channel. The same as the above visualization without the title and arrow overlays. This version has no audio. An image showing how the Arctic sea ice used to circulate for many years in the Beaufort Gyre north of Alaska getting older and thicker over time. An image showing how the sea ice moves out of the Arctic Ocean through the Fram Strait and into the North Atlantic where it melts. This image shows the difference in the quantity of the older sea ice from September 1984 to September 2016. An image showing the Arctic sea ice age in September 1984. An image showing the Arctic sea ice age in September 2016. The initial visualization showing the dynamic beauty of the sea ice without dates. The dates that correspond with the visualization above. Data may encapsulate the events of a single second or many years; it may span a small patch of Earth or entire systems of suns and planets. Visualizing data within its natural environment maximizes the potential for learning and discovery. Scientific visualization can clarify data’s relationships in time and space. In this visualization, the issue of the declining sea ice near the North Pole is set in its natural configuration. An analysis of the age of the Arctic sea ice indicates that it traditionally became older while circulating in the Beaufort Sea north of Alaska and was then primarily lost in the warmer regions along the eastern coast of Greenland. In recent years, however, warmer water in the Beaufort Sea, possibly from the Bering Strait, often melts away the sea ice in the summer before it can get older. Related pages
ICESat-2 Beauty Pass
Oct. 15th, 2014
Read moreAnimation showing the deployment of the spacecraft and a beauty pass with the beams on. High resolution print graphic of the spacecraft above the Earth. The Ice, Cloud and land Elevation Satellite-2, or ICESat-2, is a laser altimeter that will measure the heights of Earth’s surfaces. With ICESat-2’s high-resolution data, scientists will track changes to Earth’s ice-covered poles, which is witnessing dramatic temperature increases. The mission will also take stock of forests, map ocean surfaces, characterize clouds and more.ICESat-2 carries a single instrument called the Advanced Topographic Laser Altimeter System (ATLAS), equipped with a multiple-beam laser, which sends 10,000 pulses of light to the ground each second. A small fraction of the light photons bounce off Earth’s surface and return to the instrument, where a photon-counting detector times their flight. Knowing this time, and the satellite’s position and orientation in space, scientists can calculate Earth’s elevation below.ICESat-2 continues key elevation observations begun by the original ICESat satellite (2003 to 2009) and Operation IceBridge (2009 through present), to provide a portrait of change in the beginning of the 21st century. Related pages
From the Cockpit: <p><p>The Best of IceBridge Arctic 2013
Aug. 16th, 2013
Read moreThis video is a compilation of some of the best footage taken by the forward and nadir cameras mounted to NASA's P-3B aircraft during the Operation IceBridge Arctic 2013 airborne science campaign. The raw video from this piece, with titles, music, and transitions removed. Arctic Sea Ice with Commentary: You've seen the great cockpit footage from Best of IceBridge Arctic '13, now go behind the scenes for 9 minutes of scientific commentary with Operation IceBridge Project Scientist Michael Studinger and NASA sea ice researcher Nathan Kurtz, as they discuss the science behind the mission's study of Arctic sea ice.For complete transcript, click here. The views from the cockpit of NASA's P-3B aircraft on an Operation IceBridge campaign are truly stunning. The mission doesn't travel to both ends of the Earth for the scenery of course — the airborne mission is there to collect radar, laser altimetry, and other data on the changing ice sheets, glaciers, and sea ice of the Arctic and Antarctic. But for those of us who aren't polar pilots, here's a selection of some of the best footage from the forward and nadir cameras mounted to the aircraft taken during IceBridge's spring deployment over Greenland and the Arctic Ocean. Related pages