ICESat-2
Overview
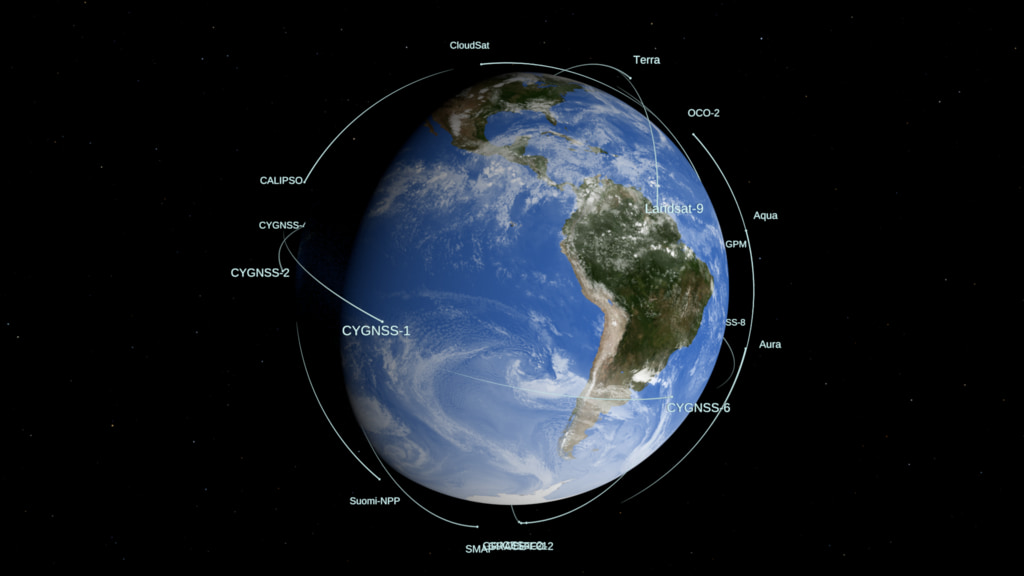
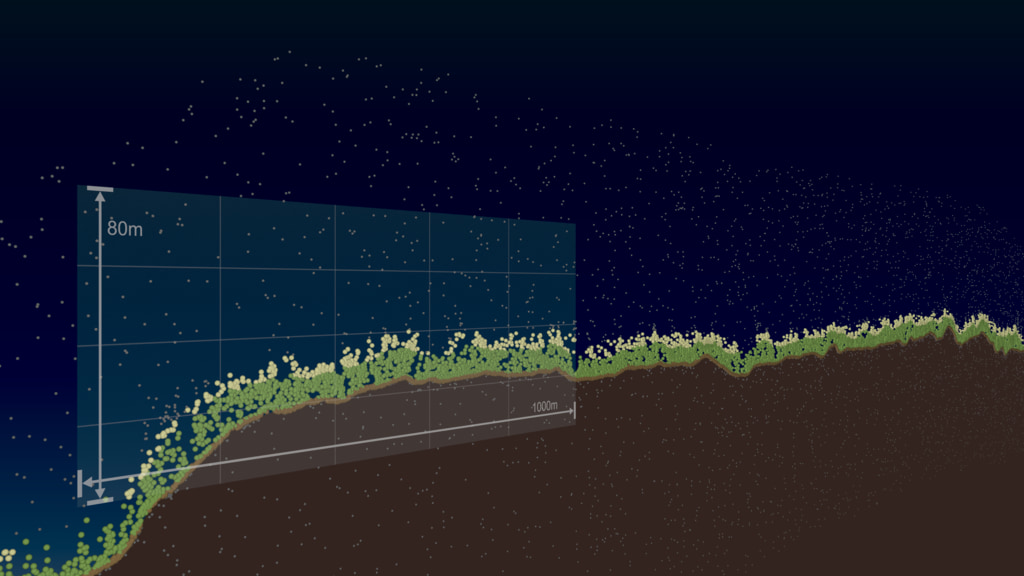
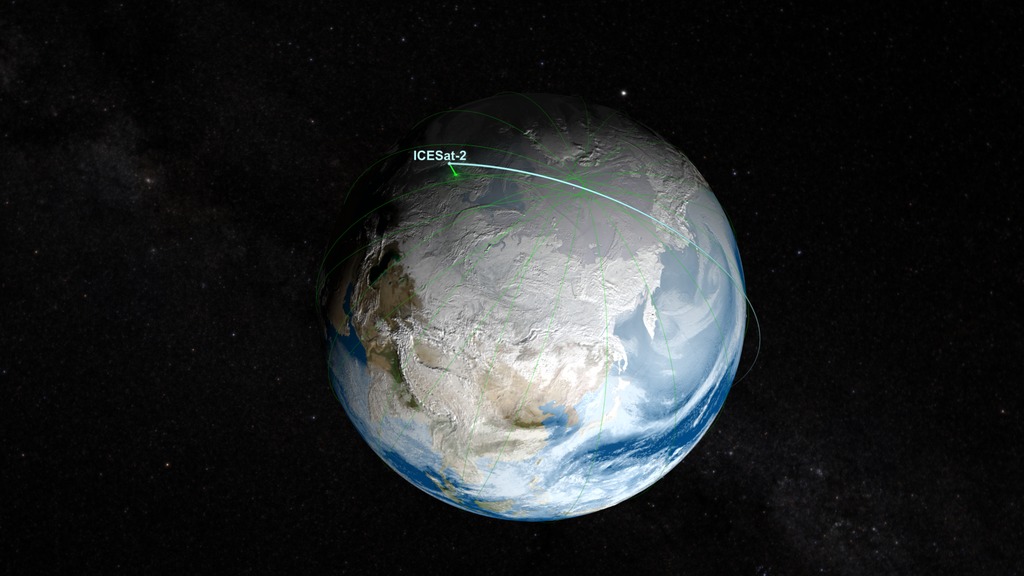
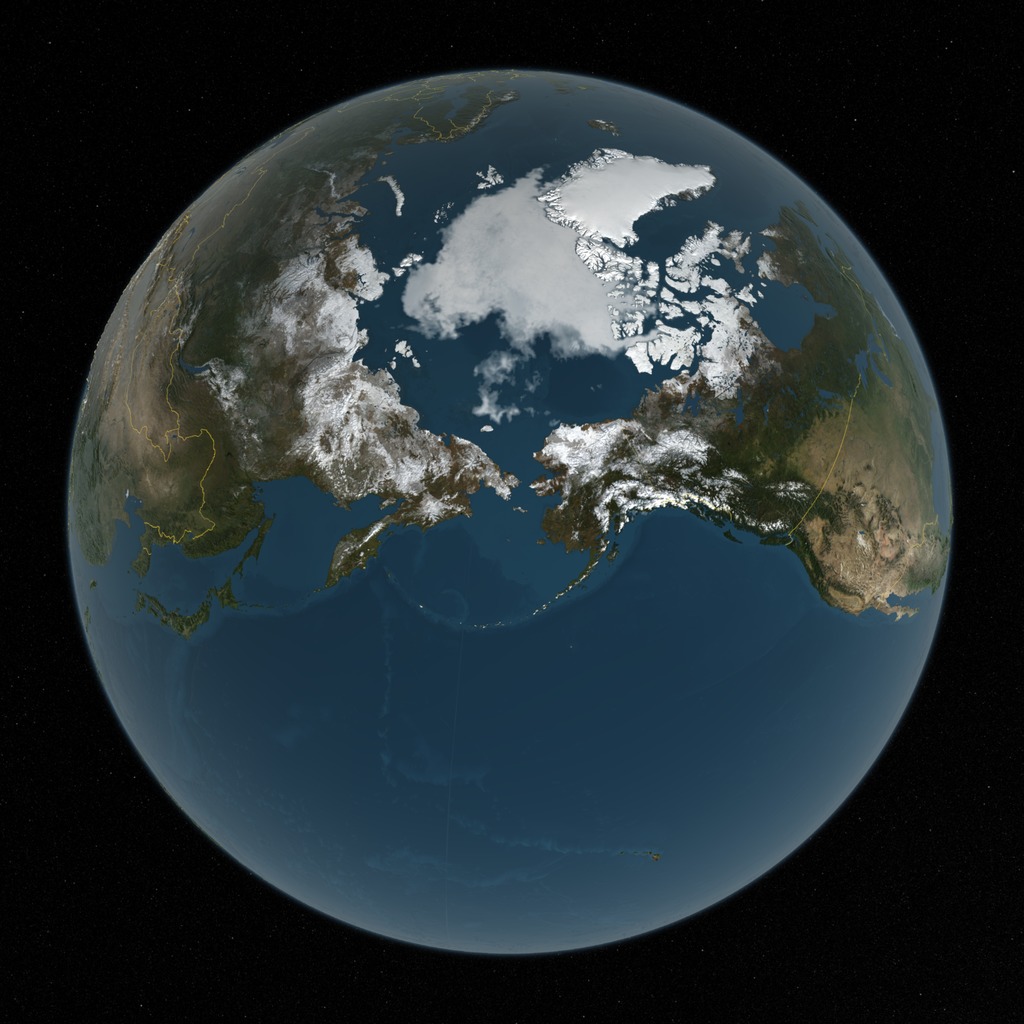
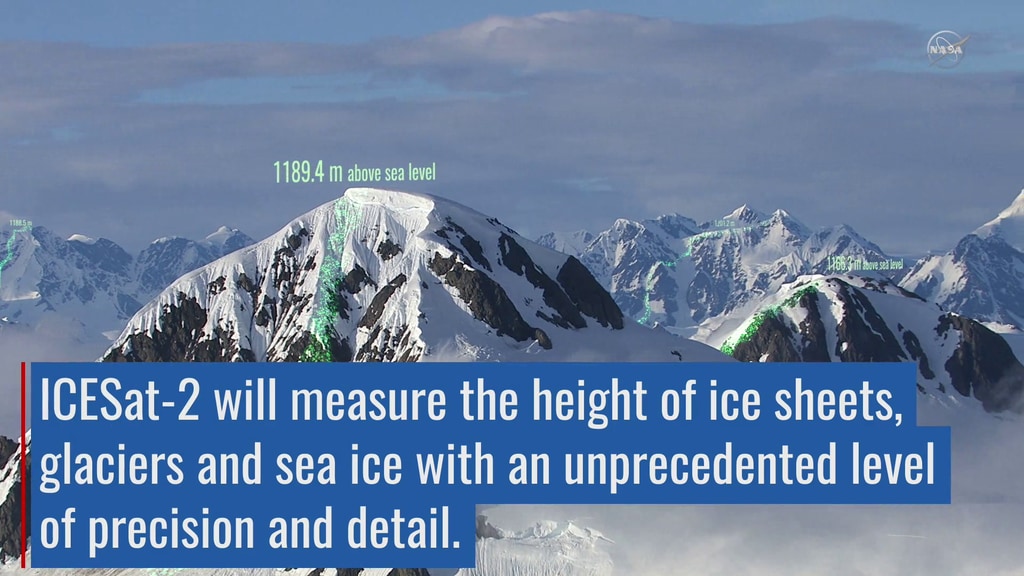
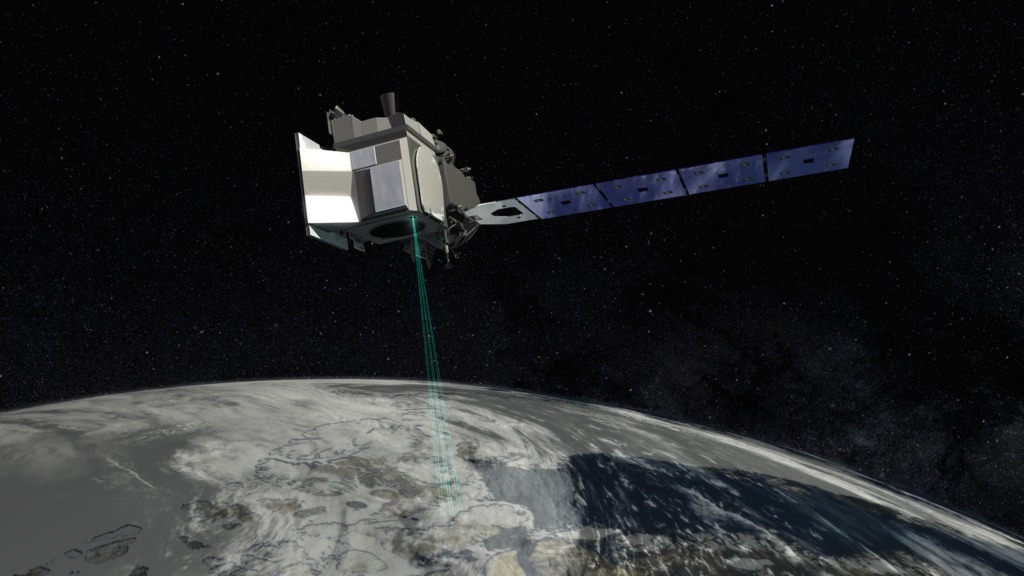
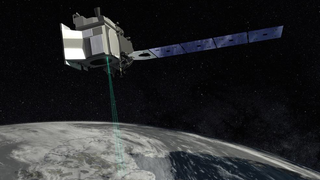
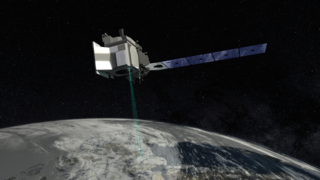
The Ice, Cloud and land Elevation Satellite-2 will measure the height of Earth from space, creating a record of the planet’s elevation in unprecedented detail and precision. With high-resolution data from ICESat-2’s laser altimeter, scientists will track changes to Earth’s polar ice caps – regions that are a harbinger of warming temperatures worldwide. The mission will also take stock of forests, map ocean surfaces, track the rise of cities and measure everything in between. ICESat-2 continues key elevation observations begun by ICESat-1 (2003 to 2009) and Operation IceBridge (2009 through present), to provide a portrait of change in the beginning of the 21st century.
For more information, please visit the ICESat-2 website.
Data Visualizations
- ID: 5616
 Visualization
 - ID: 5592
 Visualization
 - ID: 5591
 Visualization
 - ID: 5532
 Visualization
 - ID: 5100
 Visualization
 - ID: 4988
 Visualization
 - ID: 4984
 Visualization
 - ID: 4848
 Visualization
 - ID: 4995
 Visualization
 - ID: 4478
 Visualization
 - ID: 5002
 Visualization
 - ID: 4985
 Visualization
 - ID: 4928
 Visualization
 - ID: 4936
 Visualization
 - ID: 4889
- ID: 13666
 Produced Video
 - ID: 4796
 Visualization
 - ID: 4734
 Visualization
 - ID: 4678
 Visualization
 - ID: 4455
 Visualization
 - ID: 4373
 Visualization
 - ID: 4562
 Visualization
 - ID: 4566
- ID: 4564
- ID: 4578
 Visualization
 - ID: 4577
 Visualization
 - ID: 4492
 Visualization
 - ID: 3658
Edited Features
- ID: 14936
 Animation
 - ID: 14854
 Produced Video
 - ID: 14795
 Produced Video
 - ID: 14261
 Produced Video
 - ID: 13877
- ID: 13824
 Produced Video
 - ID: 13779
 Produced Video
 - ID: 13600
 Produced Video
 - ID: 13735
 Produced Video
 - ID: 13525
 Produced Video
 - ID: 13301
 Produced Video
 - ID: 13206
 Produced Video
 - ID: 13173
 Produced Video
 - ID: 12810
![Music: "Pizzicato Piece," Andrew Michael Britton [PRS], David Stephen Goldsmith [PRS]](/vis/a010000/a012800/a012810/ICESat-2_Results_AGU_YouTube.00190_print.jpg)

- ID: 13065
 Produced Video
- ID: 12905
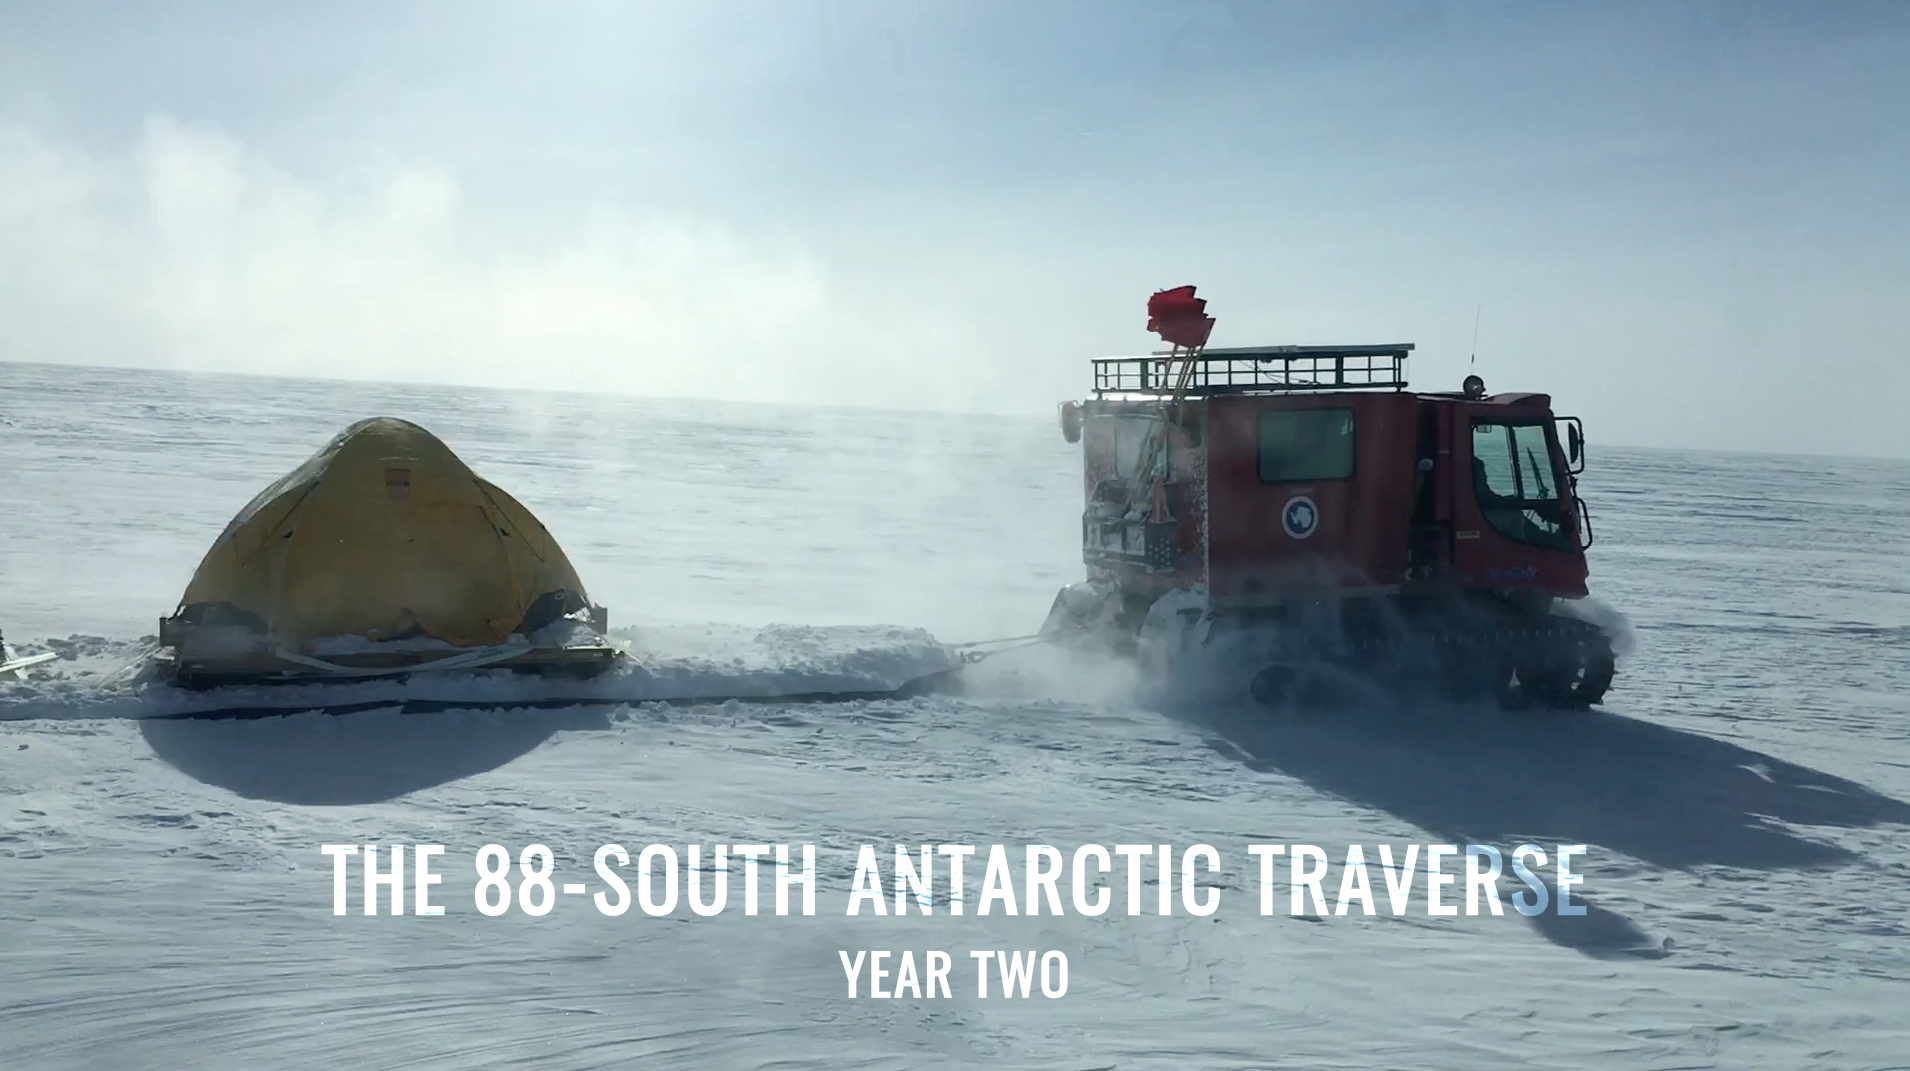
![NASA cryospheric scientist Kelly Brunt and ICESat-2 Deputy Project Scientist Tom Neumann recall some of the highlights and challenges from the recent 88-South Antarctic Traverse.Music: "Lights," Alexius Tschallener [SUISA], Dominik Johnson [PRS]; "Vulnerable Moment," John Ashton Thomas [PRS]Complete transcript available.](/vis/a010000/a012900/a012905/12905_thumbstill_print.jpg) Produced Video
Produced Video - ID: 12809
 Produced Video
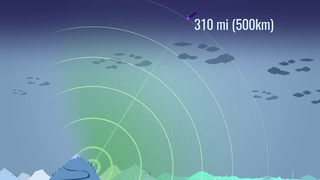
 Section
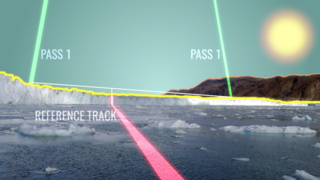 Section
 Section
 Section
- ID: 12663
 Produced Video
 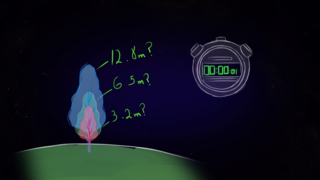 Section
- ID: 12525
 Produced Video
 - ID: 12418
 Animation
 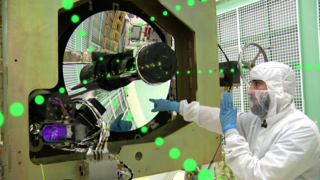 Section
- ID: 11944
 Produced Video
  Section
- ID: 10757
 Produced Video
Raw Media for Broadcast
HD broadcast-quality footage of the ICESat-2 spacecraft and ATLAS instrument.
- ID: 11709 B-Roll
ICESat-2 Testing and Integration B-roll
Go to this pageDolly shots of the ATLAS instrument inside the cleanroom. || ATLAS_dolly_selects_youtube_hq.00500_print.jpg (1024x576) [165.5 KB] || ATLAS_dolly_selects_youtube_hq.00500_searchweb.png (320x180) [108.4 KB] || ATLAS_dolly_selects_youtube_hq.00500_thm.png (80x40) [7.4 KB] || ATLAS_dolly_selects_prores.webm (1280x720) [26.9 MB] || ATLAS_dolly_selects_large.mp4 (1280x720) [201.6 MB] || ATLAS_dolly_selects_youtube_hq.mov (1280x720) [868.8 MB] || GSFC_20141015_ATLAS_m11709_Dolly_Selects.en_US.srt [50 bytes] || GSFC_20141015_ATLAS_m11709_Dolly_Selects.en_US.vtt [62 bytes] || ATLAS_dolly_selects_prores.mov (1280x720) [2.7 GB] ||
Animations
- Section

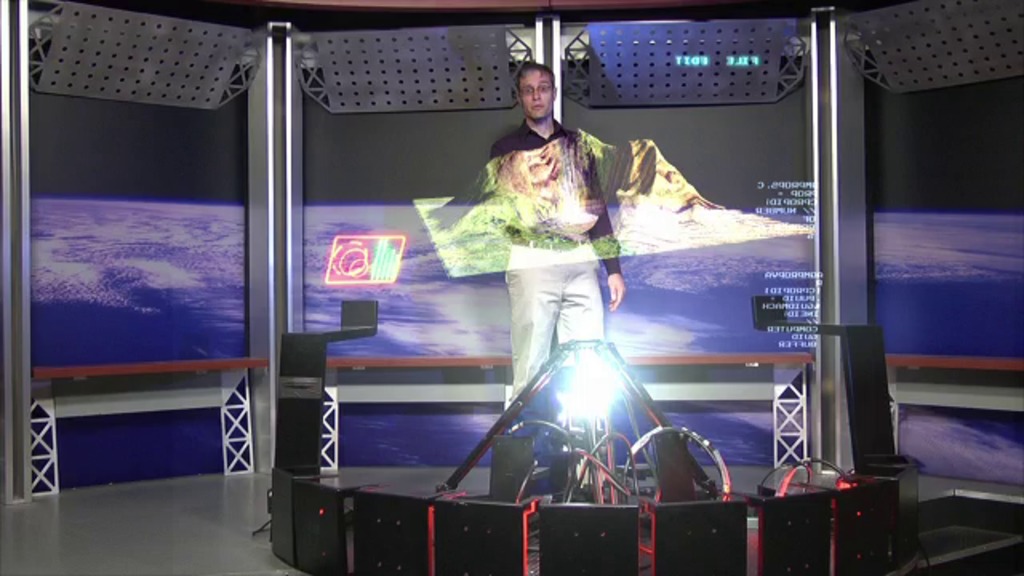
Intro to LIDAR 3D
Go to this sectionWant to know the 3D shape of terrain on another planet? Want to study the height and density of Earth's forests? An amazing tool called LIDAR can help. Learn more in this video!This video is presented in stereoscopic 3D for those who can view it. We've included left and right eye clips, a side-by-side version, and an anaglyph (red/blue) version. Download any of them below!
- Section
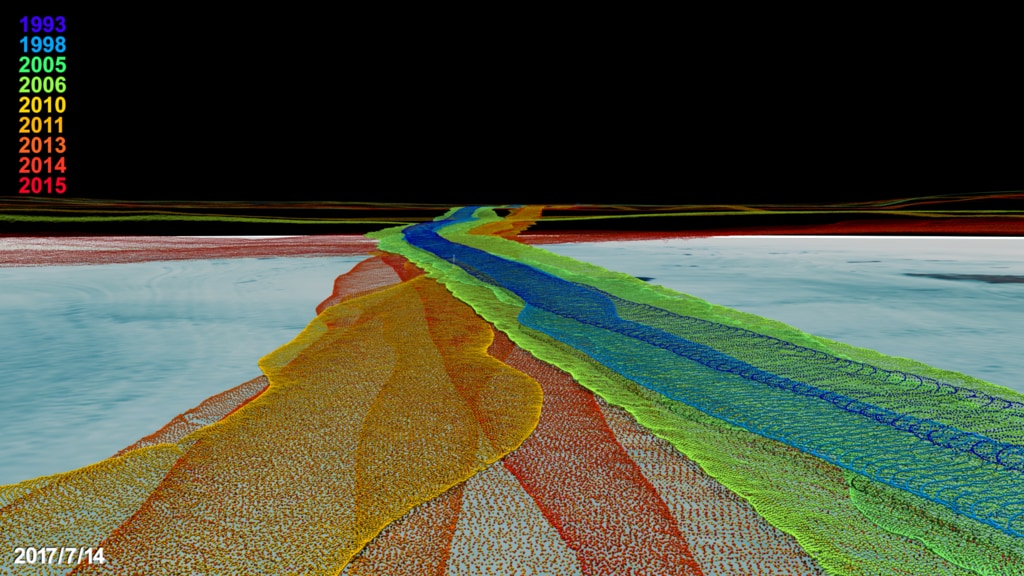
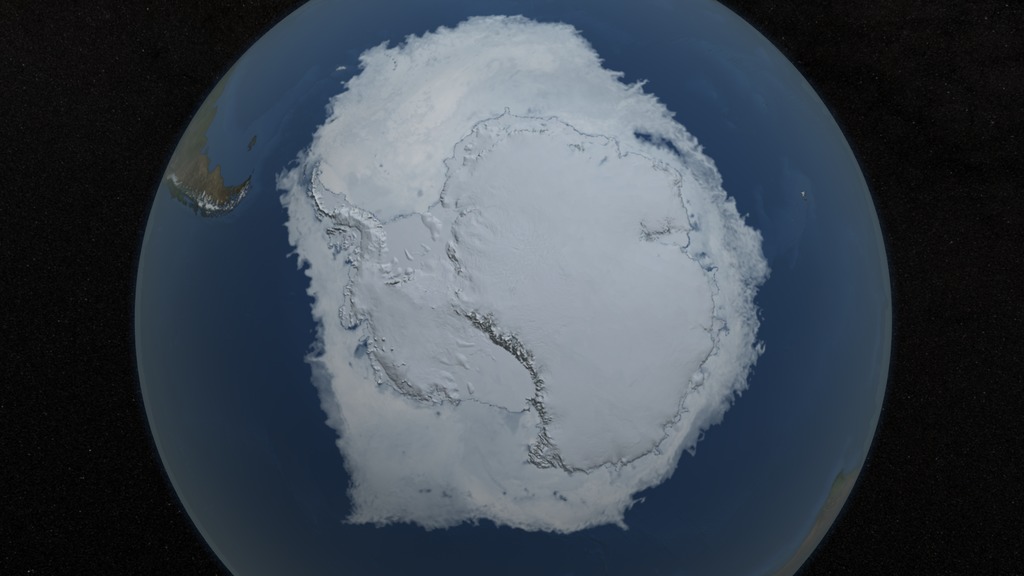
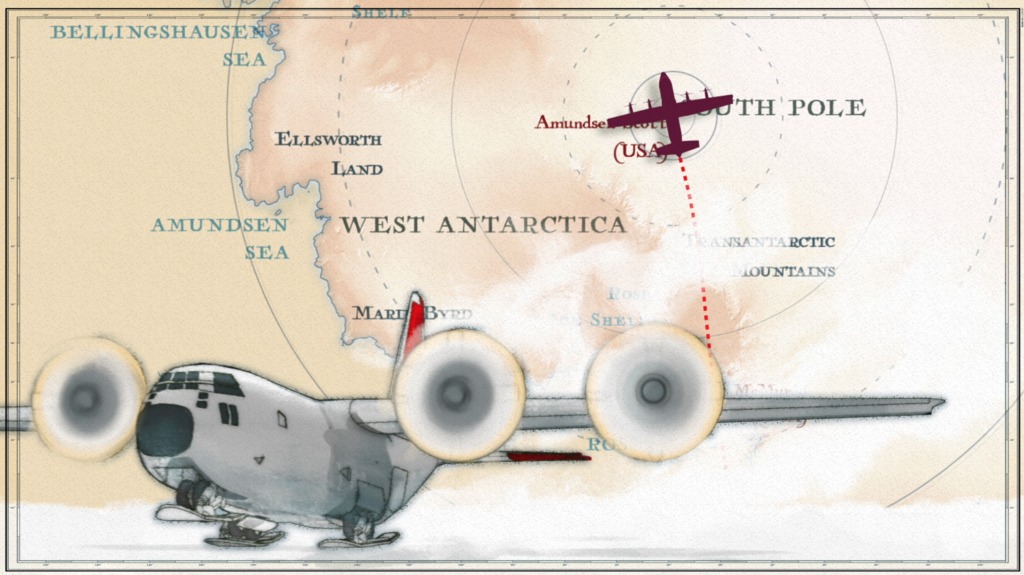
Snow Accumulation
Go to this sectionAntarcticaMusic: "Distant Echoes," Adam Salkeld, Atmosphere Music Ltd. PRS; "Evolution of Life," David Stephen Goldsmith, Atmosphere Music Ltd. PRSComplete transcript available.
- Section

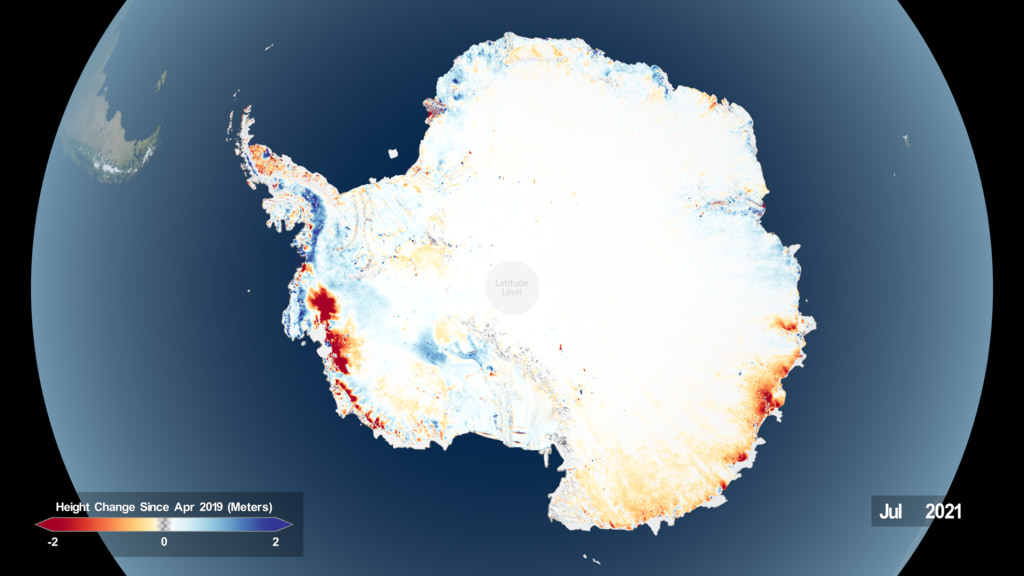
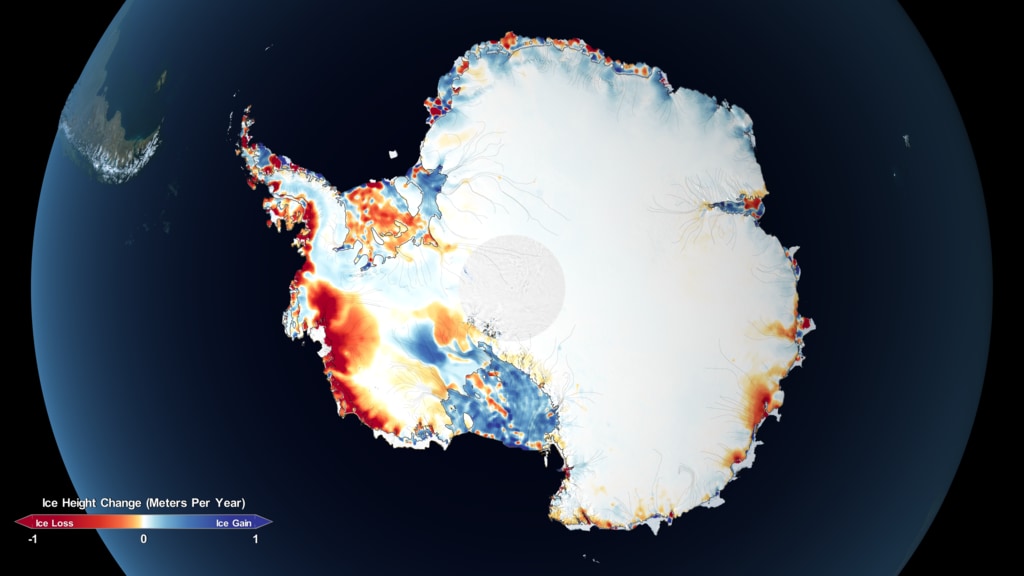
Mass Balance of Ice Sheets
Go to this sectionAntarcticaMusic: "Distant Echoes," Adam Salkeld, Atmosphere Music Ltd. PRS; "Evolution of Life," David Stephen Goldsmith, Atmosphere Music Ltd. PRSComplete transcript available.
- ID: 13049 Produced Video
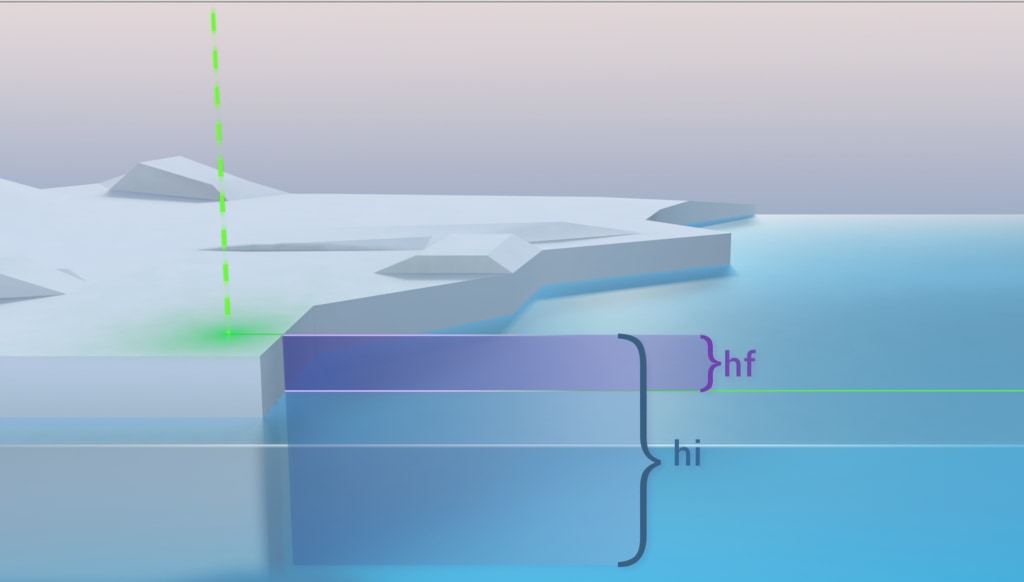
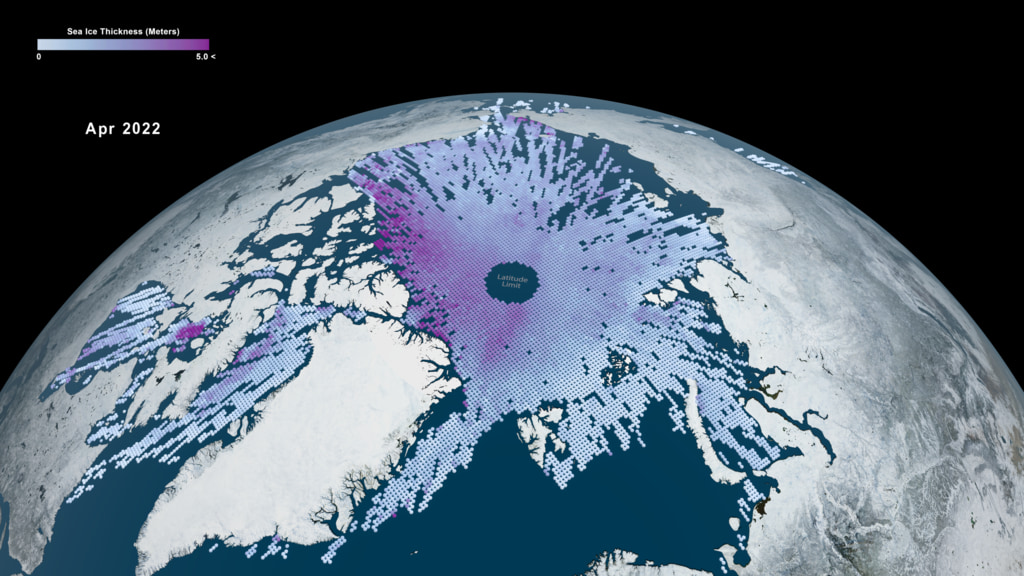
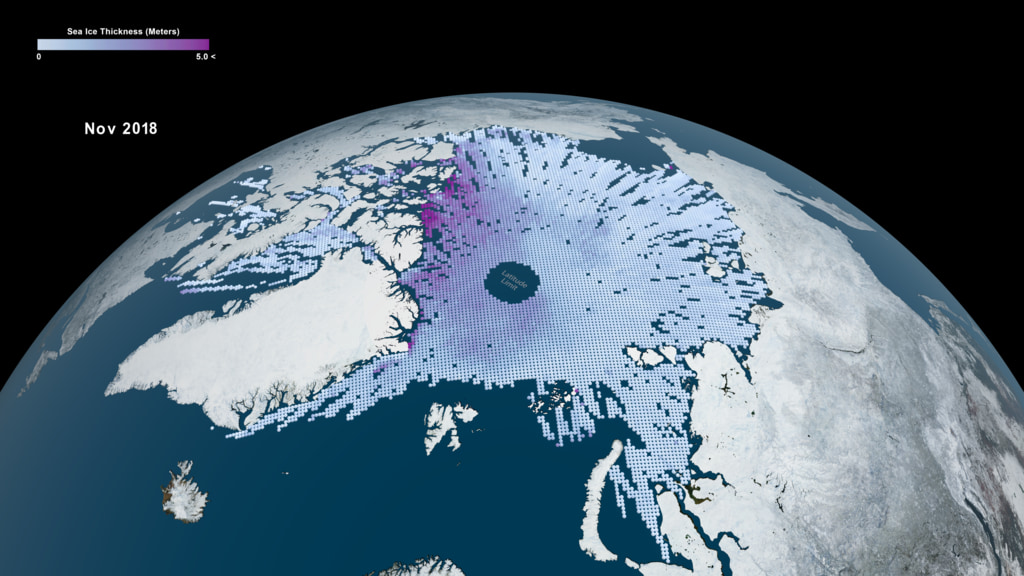
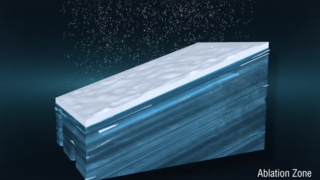
ICESat-2 Measures Sea Ice Thickness
Go to this pageAnimation showing how ICESat-2 will measure the height of sea ice freeboard (hf) – the portion of sea ice floating above the water – to estimate sea ice thickness (hi). || freeboard_thumb_print.jpg (1024x582) [32.0 KB] || freeboard_thumb_searchweb.png (320x180) [40.1 KB] || freeboard_thumb_thm.png (80x40) [3.5 KB] || SEA_ICE_V06.webm (1920x1080) [5.5 MB] || SEA_ICE_V06_facebook_720.mp4 (1280x720) [70.8 MB] || SEA_ICE_V06_youtube_1080.mp4 (1920x1080) [93.8 MB] || 1920x1080_16x9_60p (1920x1080) [0 Item(s)] || GSFC_20180822_ICESat2_m13049_SEAICE.en_US.vtt [64 bytes] || SEA_ICE_V06_prores.mov (1920x1080) [2.5 GB] ||
- ID: 12041 Produced Video
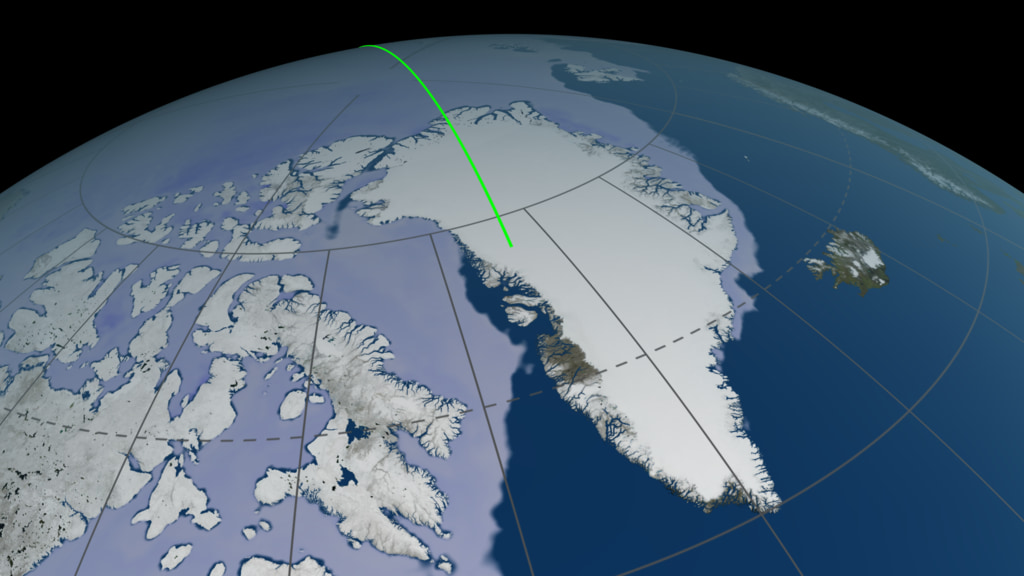
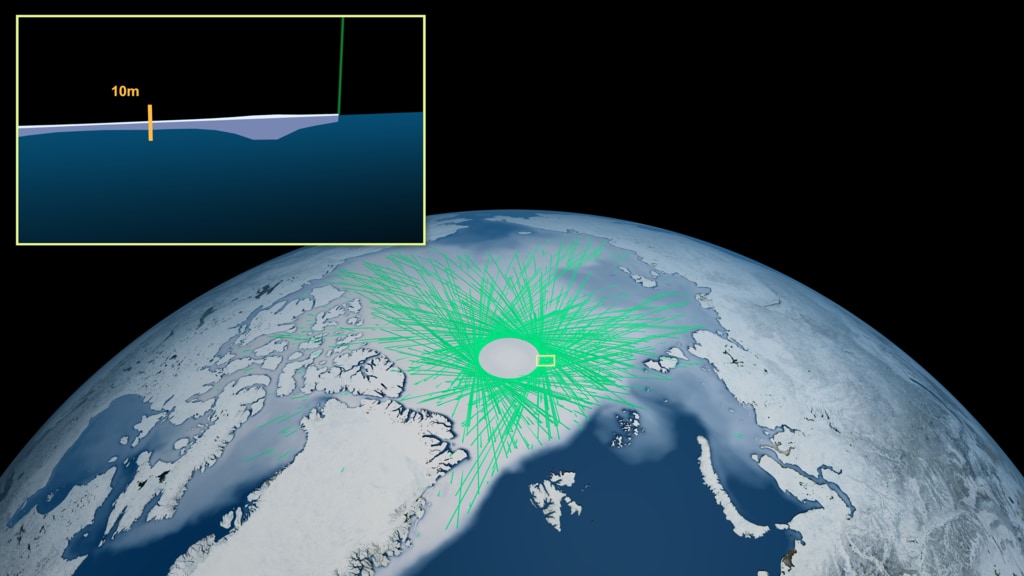
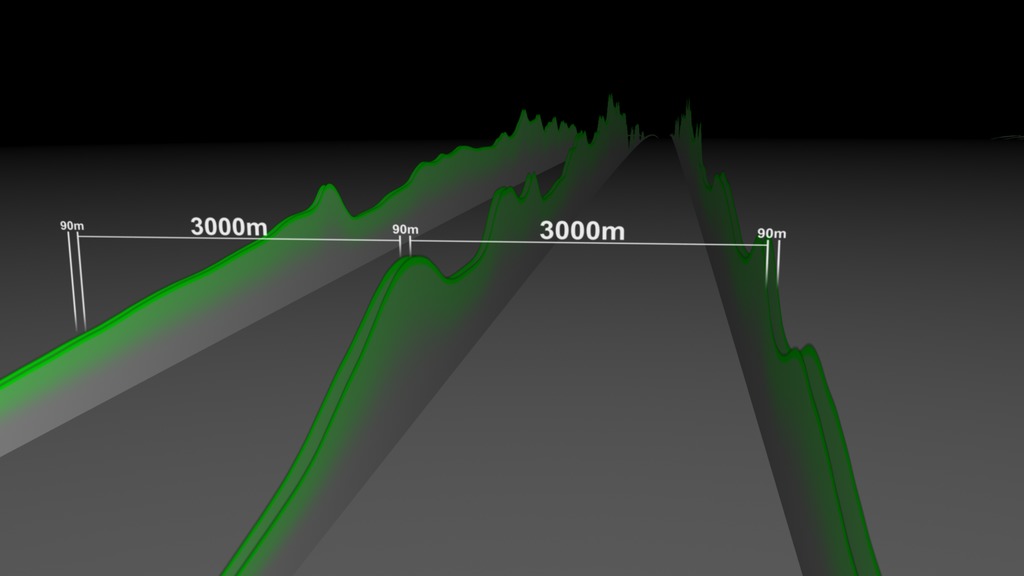
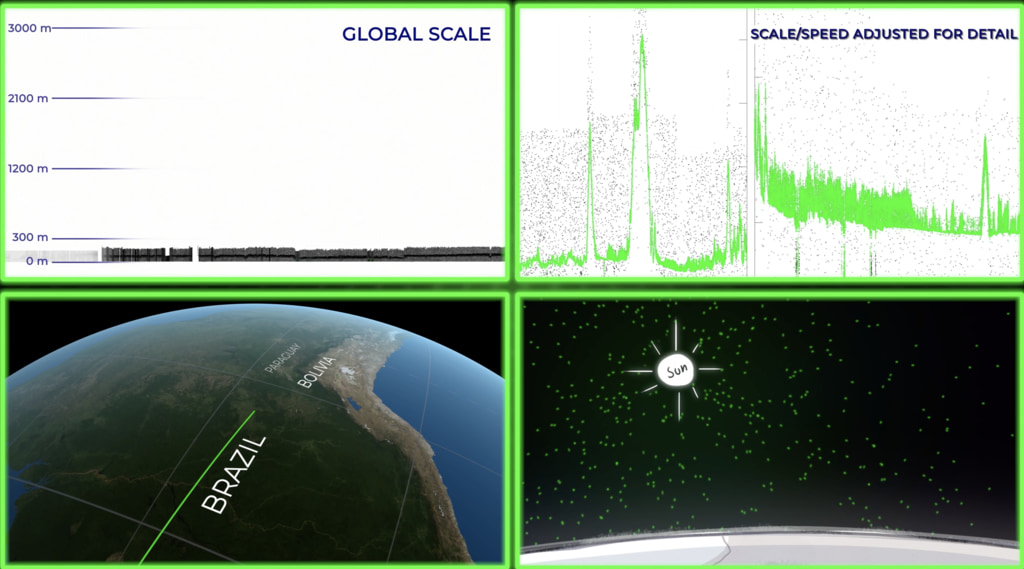
ICESat-2 Measures Slope
Go to this pageAnimation with info key. || icesat_tracks_still.png (1919x1076) [2.8 MB] || icesat_tracks_still_print.jpg (1024x574) [146.6 KB] || icesat_tracks_still_searchweb.png (320x180) [102.8 KB] || icesat_tracks_still_web.png (320x179) [102.4 KB] || icesat_tracks_still_thm.png (80x40) [9.3 KB] || IceSatTracks.mp4 (1920x1080) [80.7 MB] || IceSatTracks.webm (1920x1080) [6.6 MB] || key (1920x1080) [0 Item(s)] || IceSatTracks.mov (1920x1080) [1.8 GB] ||
- ID: 12141 Produced Video
ICESat-2 Beam Pairs
Go to this pageSide view of the beam pairs. || ICESat-2_beams_side_print.jpg (1024x576) [121.7 KB] || ICESat-2_beams_side_searchweb.png (320x180) [92.0 KB] || ICESat-2_beams_side_thm.png (80x40) [6.9 KB] || ICESat-2_beams_side.mp4 (1920x1080) [19.9 MB] || ICESat-2_beams_side.webm (1920x1080) [1.6 MB] || sideview (1920x1080) [0 Item(s)] || ICESat-2_beams_side.mov (1920x1080) [221.5 MB] ||
- ID: 11712 Produced Video
ICESat-2 Beauty Pass
Go to this pageAnimation showing the deployment of the spacecraft and a beauty pass with the beams on. || ICESat2__deploy_beauty_youtube_hq_print.jpg (1024x576) [176.2 KB] || ICESat2__deploy_beauty_youtube_hq_searchweb.png (320x180) [90.3 KB] || ICESat2__deploy_beauty_youtube_hq_web.png (320x180) [90.3 KB] || ICESat2__deploy_beauty_youtube_hq_thm.png (80x40) [4.9 KB] || 1920x1080_16x9_30p (1920x1080) [0 Item(s)] || ICESat2__deploy_beauty_1280x720.wmv (1280x720) [31.3 MB] || ICESat2__deploy_beauty_appletv.m4v (960x540) [25.5 MB] || ICESat2__deploy_beauty_youtube_hq.mov (1920x1080) [95.5 MB] || ICESat2__deploy_beauty_prores.mov (1280x720) [454.4 MB] || ICESat2__deploy_beauty_720x480.webm (720x480) [6.2 MB] || ICESat2__deploy_beauty_720x480.wmv (720x480) [30.4 MB] || ICESat2__deploy_beauty_nasaportal.mov (640x360) [25.6 MB] || ICESat2__deploy_beauty_ipod_lg.m4v (640x360) [9.6 MB] || GSFC_20141015_ICESat2_m11712_Deploy_Beauty.en_US.vtt [64 bytes] || ICESat2__deploy_beauty_ipod_sm.mp4 (320x240) [4.8 MB] || icesat-2-beauty-pass-and-deployment.hwshow ||
- ID: 20021 Animation
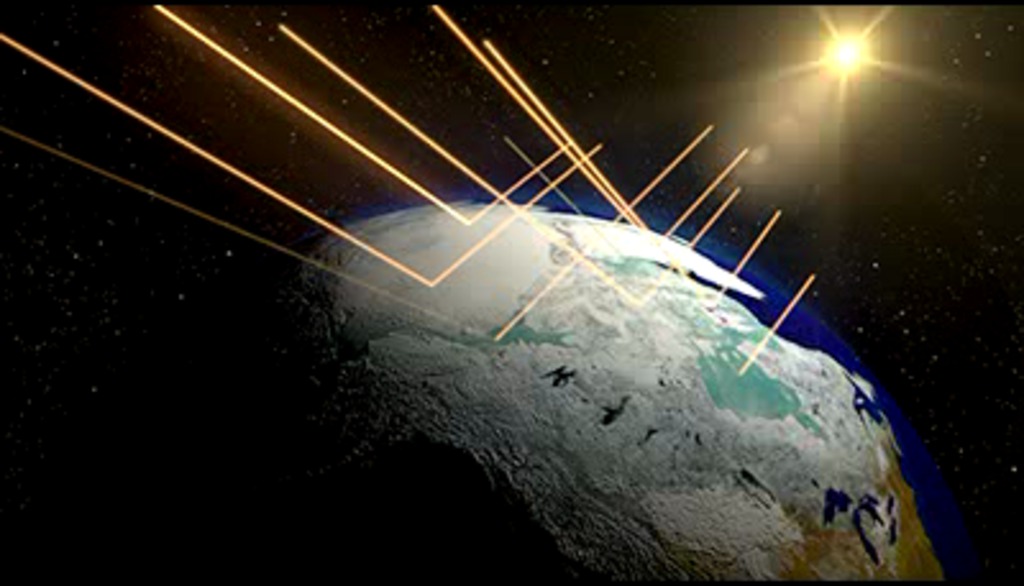
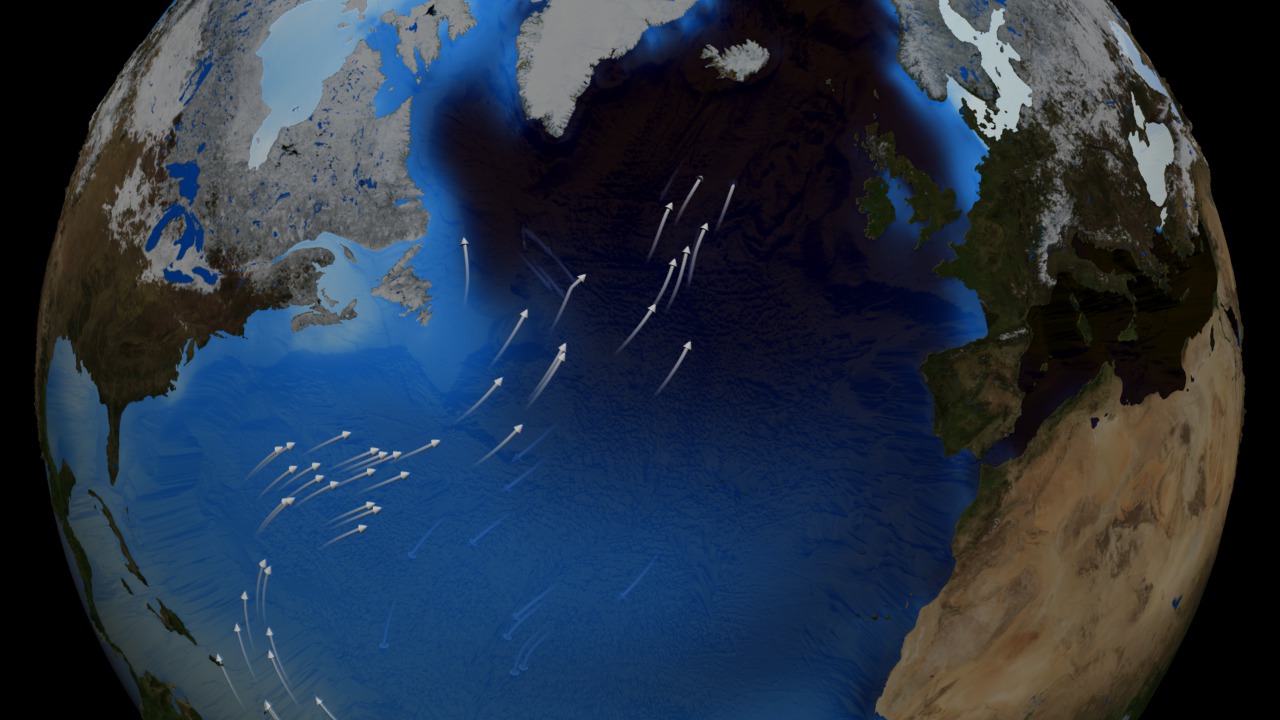
Ice Albedo - Global View
Go to this pageThis is a conceptual animation showing how polar ice reflects light from the sun. As this ice begins to melt, less sunlight gets reflected into space. It is instead absorbed into the oceans and land, raising the overall temperature, and fueling further melting. ||
- ID: 20022 Animation
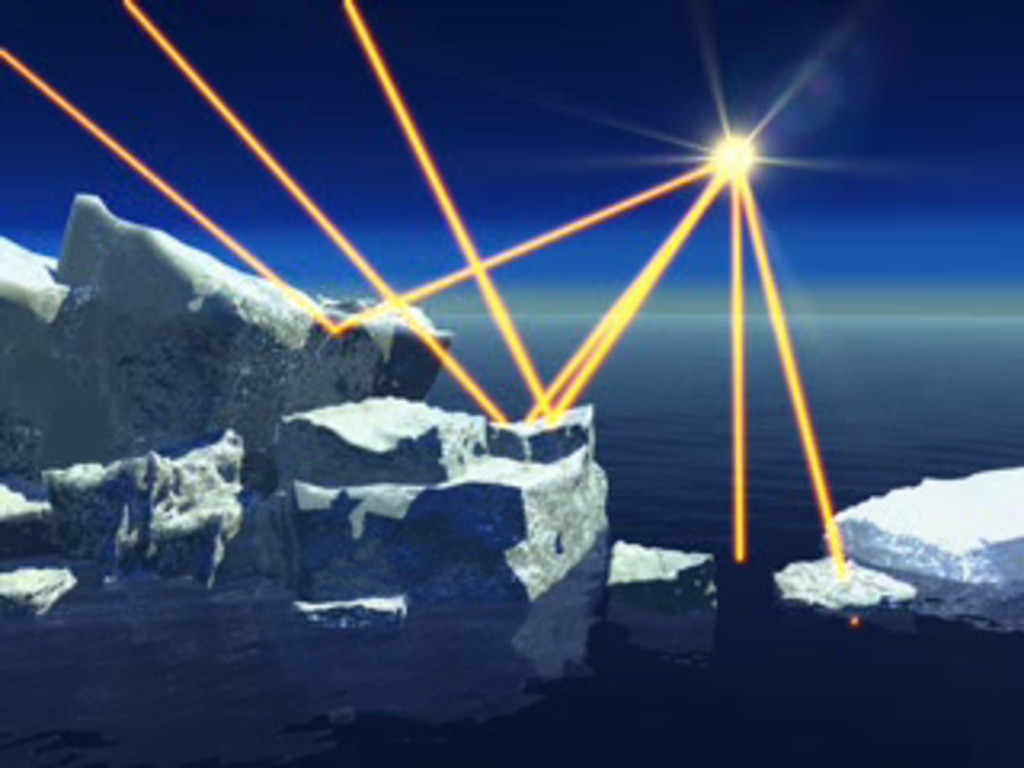
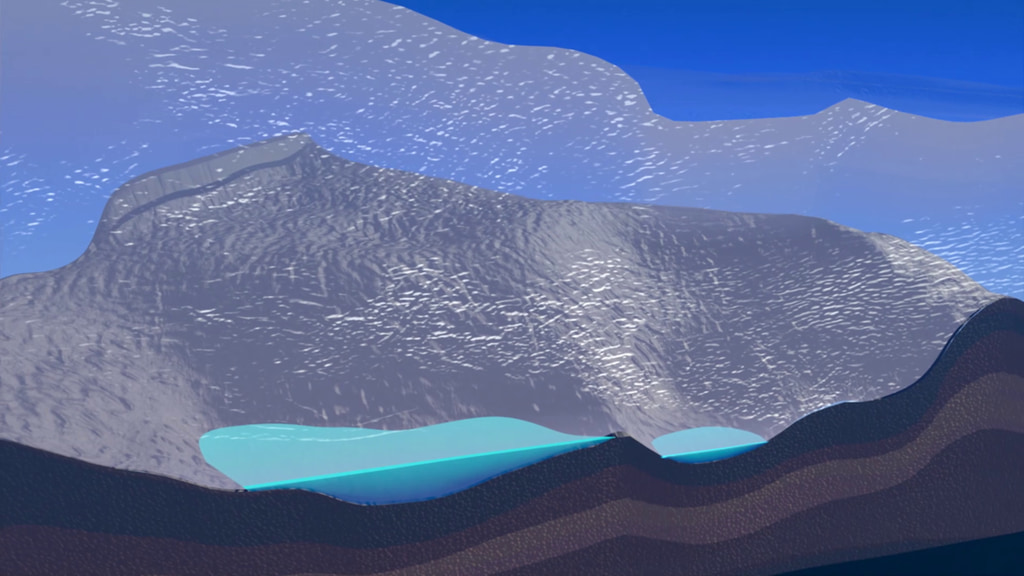
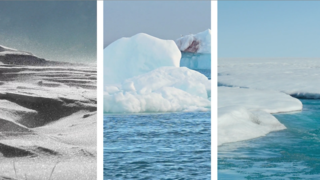
Ice Albedo: Bright White Reflects Light
Go to this pageThis animation provides a close perspective of the relationship between ice and solar reflectivity. As glaciers, the polar caps, and icebergs (shown here) melt, less sunlight gets reflected into space. Instead, the oceans and land absorb the light, thus raising the overall temperature and adding energy to a vicious circle. ||
- ID: 20204 Animation
ICESat 2014 Spacecraft Animations
Go to this pageA four-shot beauty pass of ICESat on orbit || beaa075000752_print.jpg (1024x576) [90.0 KB] || beaa0750_web.png (320x180) [56.9 KB] || beaa0750_thm.png (80x40) [5.2 KB] || IceSat-Beauty1 (1280x720) [0 Item(s)] || Icesat-Beauty-1.webmhd.webm (960x540) [11.2 MB] || Icesat-Beauty-1.mov (1280x720) [335.6 MB] ||
L-30 Science Briefing Graphics
- ID: 13044 Produced Video
ICESat-2 L-30 Science Briefing Graphics
Go to this pageNext month, NASA will launch into space the most advanced laser instrument of its kind, beginning a mission to measure – in unprecedented detail – changes in the heights of Earth’s polar ice.NASA’s Ice, Cloud and land Elevation Satellite-2 (ICESat-2) will measure the average annual elevation change of land ice covering Greenland and Antarctica to within the width of a pencil, capturing 60,000 measurements every second.“ICESat-2’s new observational technologies will advance our knowledge of how the ice sheets of Greenland and Antarctica contribute to sea level rise while also helping us understand the connection of sea ice loss to the global system,” said Thomas Wagner, cryosphere program scientist in NASA’s Science Mission Directorate.ICESat-2 will extend and improve upon NASA's 15-year record of monitoring the change in polar ice heights, which started in 2003 with the first ICESat mission and continued in 2009 with NASA’s Operation IceBridge, an airborne research campaign that monitors the accelerating rate of change.ICESat-2 represents a major technological leap in our ability to measure changes in ice height. Its Advanced Topographic Laser Altimeter System (ATLAS) measures height by timing how long it takes individual light photons to travel from the spacecraft to Earth and back.NASA will host a media teleconference at 1 p.m. EDT Wednesday, Aug. 22, to discuss the upcoming launch of the Ice, Cloud and land Elevation Satellite (ICESat-2), which will fly NASA's most advanced laser altimeter to measure Earth’s changing ice. The teleconference will stream live on NASA's website.ICESat-2 is scheduled to launch Sept. 15 from Vandenberg Air Force Base.The briefing participants are: • Tom Wagner, cryosphere program scientist in the Science Mission Directorate (SMD) at NASA Headquarters • Richard Slonaker, ICESat-2 program executive in SMD • Doug McLennan, ICESat-2 project manager at NASA’s Goddard Space Flight Center • Donya Douglas-Bradshaw, Advanced Topographic Laser Altimeter System (ATLAS) instrument project manager at Goddard • Tom Neumann, ICESat-2 deputy project scientist at GoddardFor more information:Media AdvisoryICESat-2 Video Resources ||
Facebook Live Broadcasts
 Link
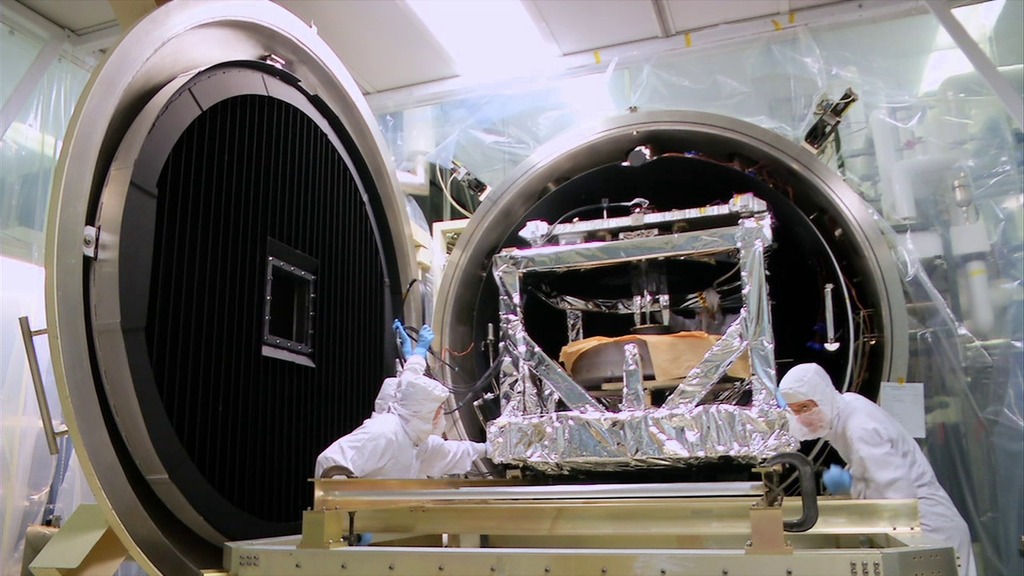
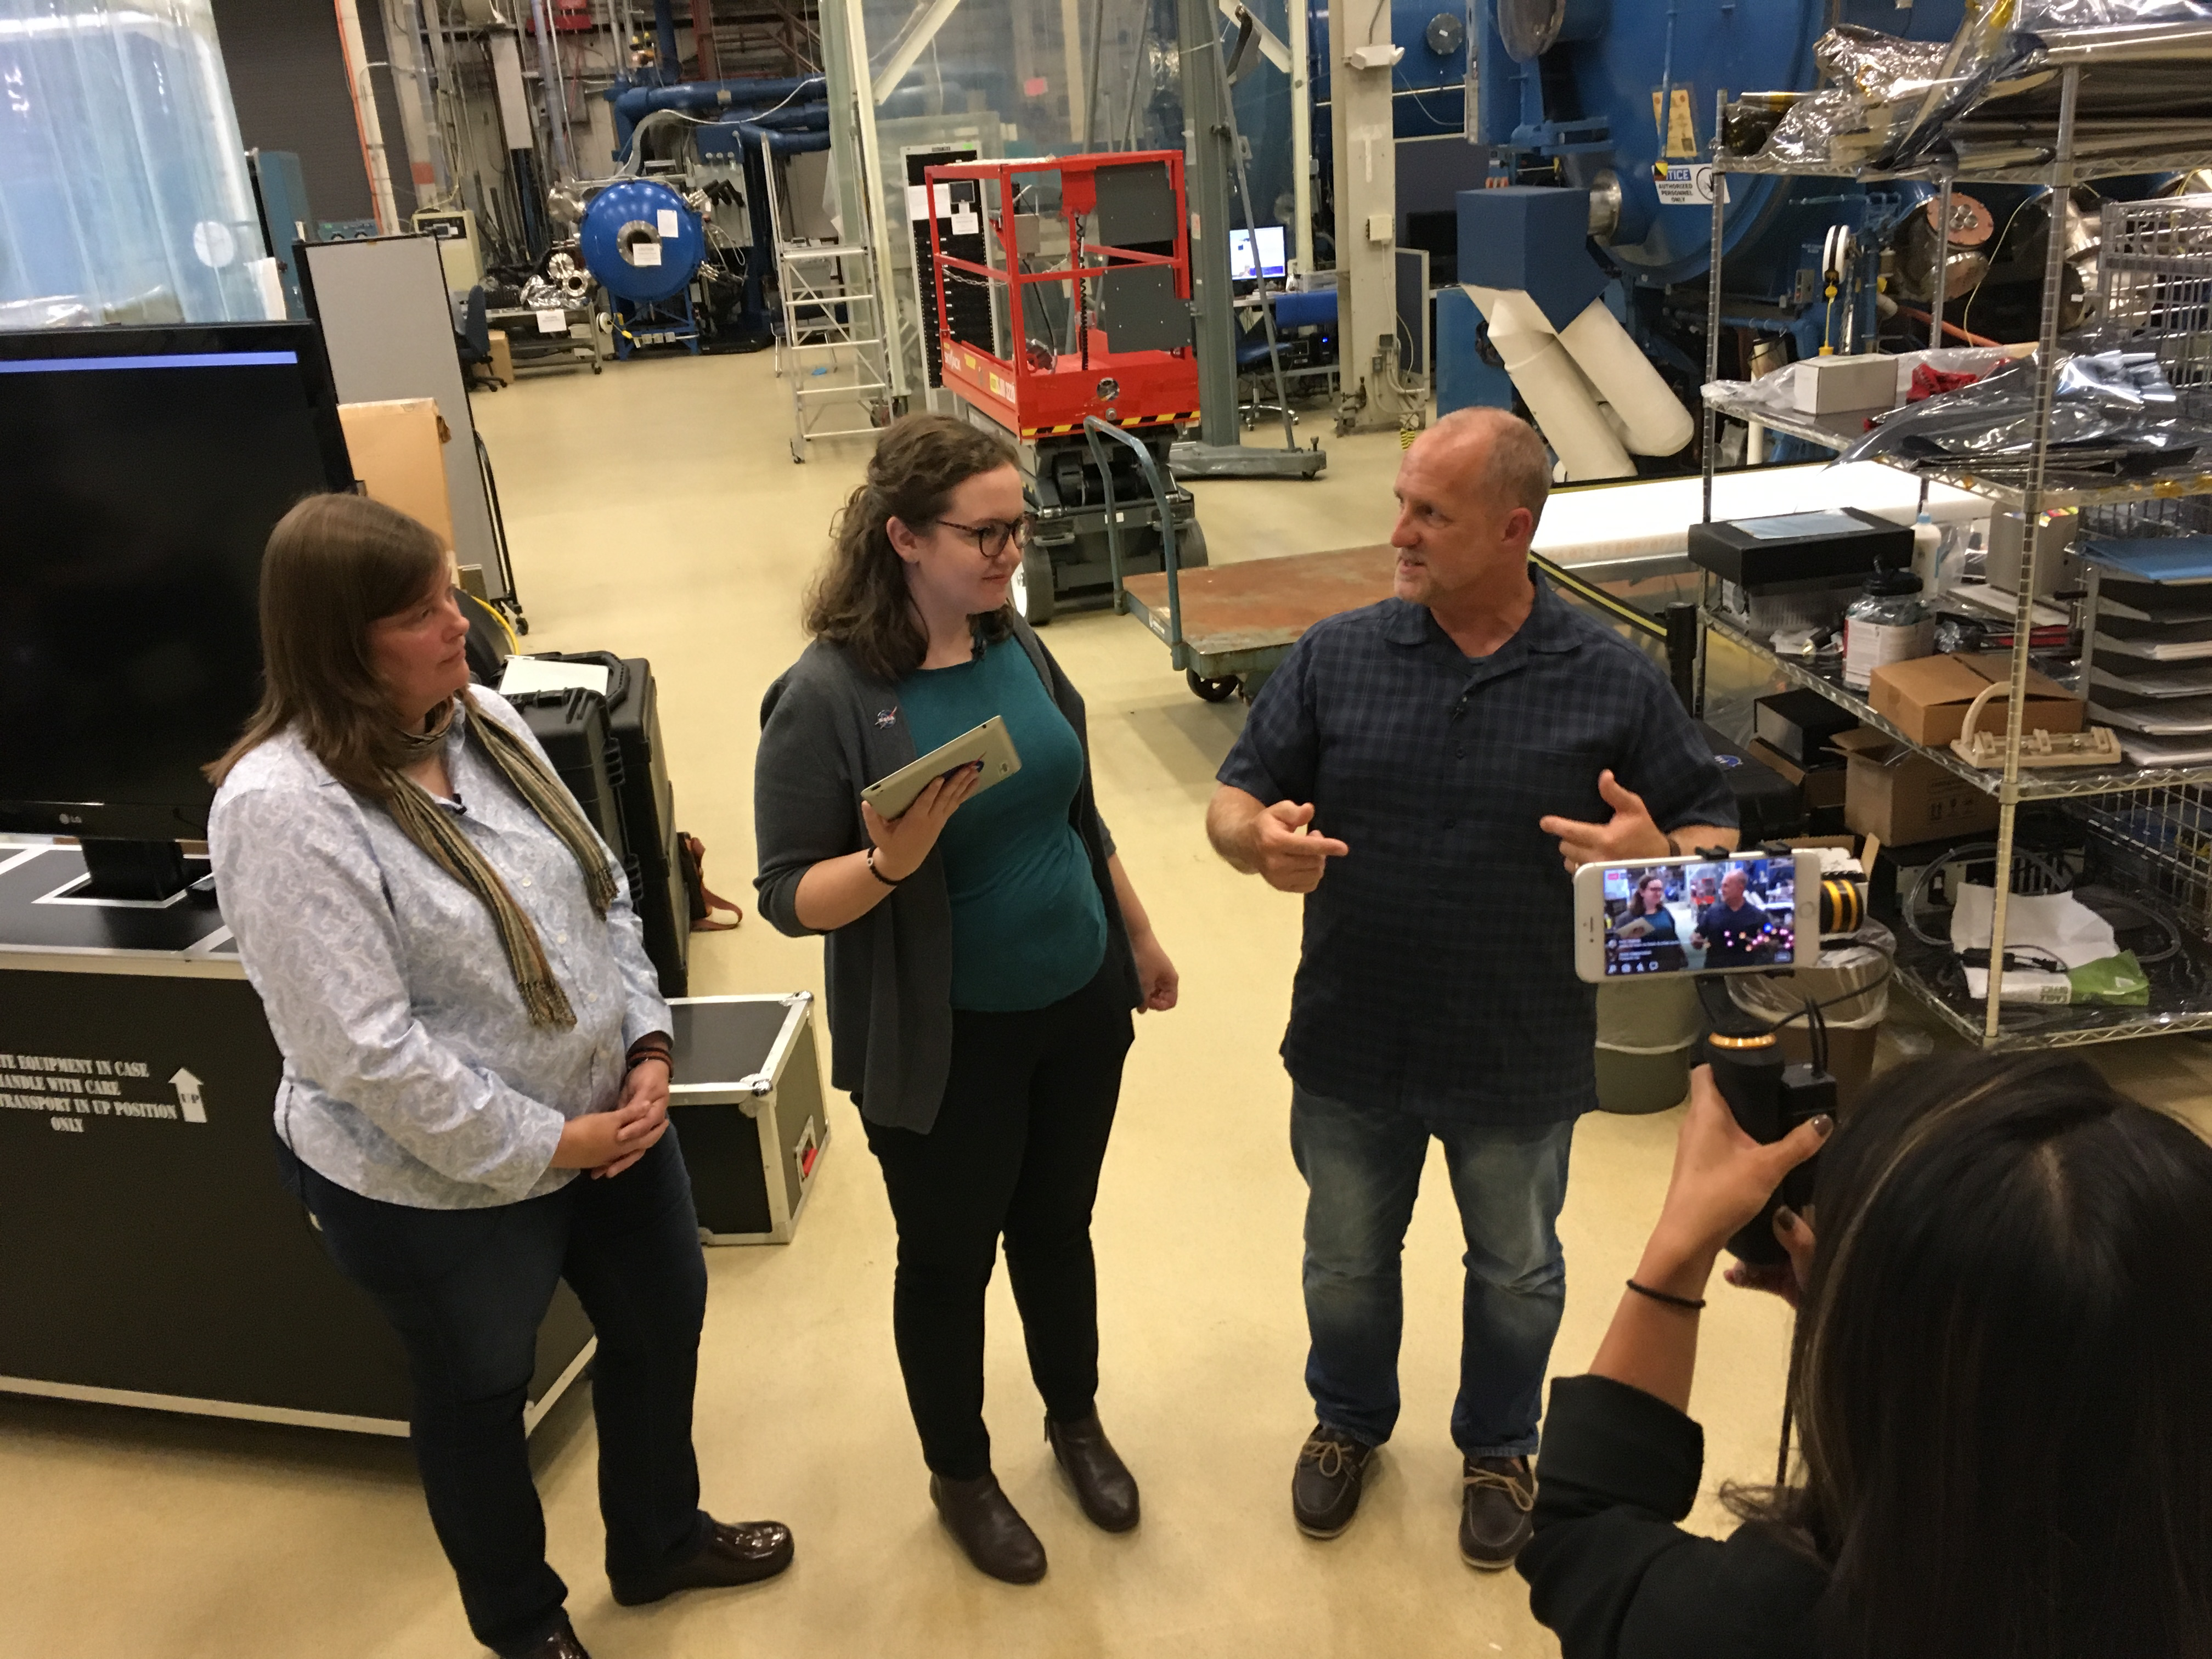
LinkInside the ATLAS Cleanroom
Time to suit up! We’re taking you into a clean room at NASA’s Goddard Space Flight Center where the ICESat-2 satellite is currently being monitored. Here engineers and technicians take special precautions to make sure the instrument’s lasers, mirrors, and other components stay perfectly clean. ICESat-2’s sole instrument, called the Advanced Topographic Laser Altimeter System (ATLAS), is being put to the test in this clean room and in a nearby thermal vacuum chamber, before engineers attach it to the rest of the ICESat-2 spacecraft.
Go to this link
High Resolution Still Graphics
- ID: 13068 Infographic
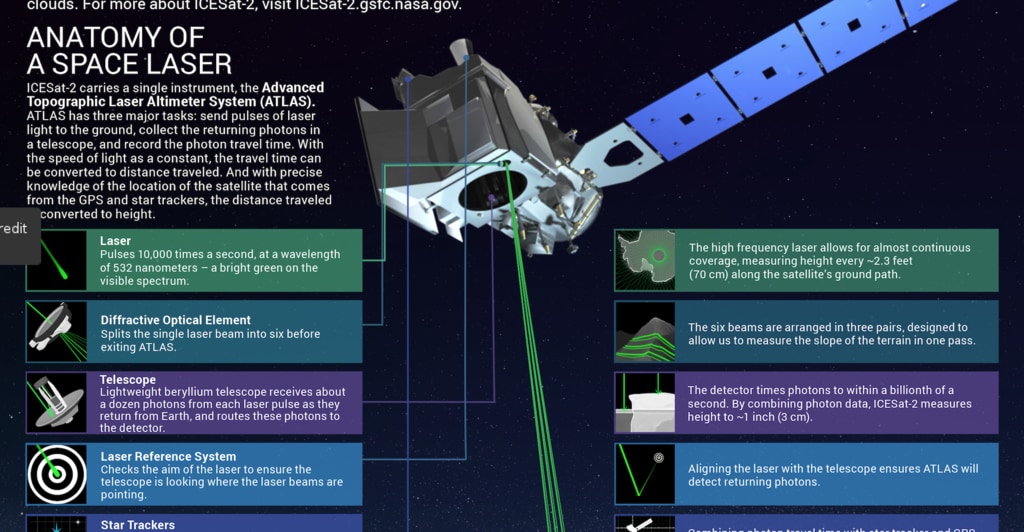
ICESat-2 Infographic
Go to this pageInfographic || infographic_thumb_print.jpg (1024x532) [141.4 KB] || ICESat2_Infographic.png (2625x3375) [6.8 MB] || infographic_thumb_searchweb.png (320x180) [87.7 KB] || infographic_thumb_thm.png (80x40) [6.3 KB] || Downloadable high-resolution infographic illustrating the major technology and science objectives of the Ice, Cloud and land Elevation Satellite-2. ||
- ID: 12209 Produced Video
ICESat-2 Print Material
Go to this pageVery high resolution banner graphic of the ICESat-2 spacecraft, laser pairs and sea ice. || Clean_Room_Banner_print.jpg (1024x1367) [161.0 KB] || Clean_Room_Banner.png (4493x6000) [25.5 MB] || Clean_Room_Banner_searchweb.png (320x180) [47.0 KB] || Clean_Room_Banner_thm.png (80x40) [4.2 KB] || These illustrations are an outcome of the ICESat-2/SCAD Collaborative Student Project. ||
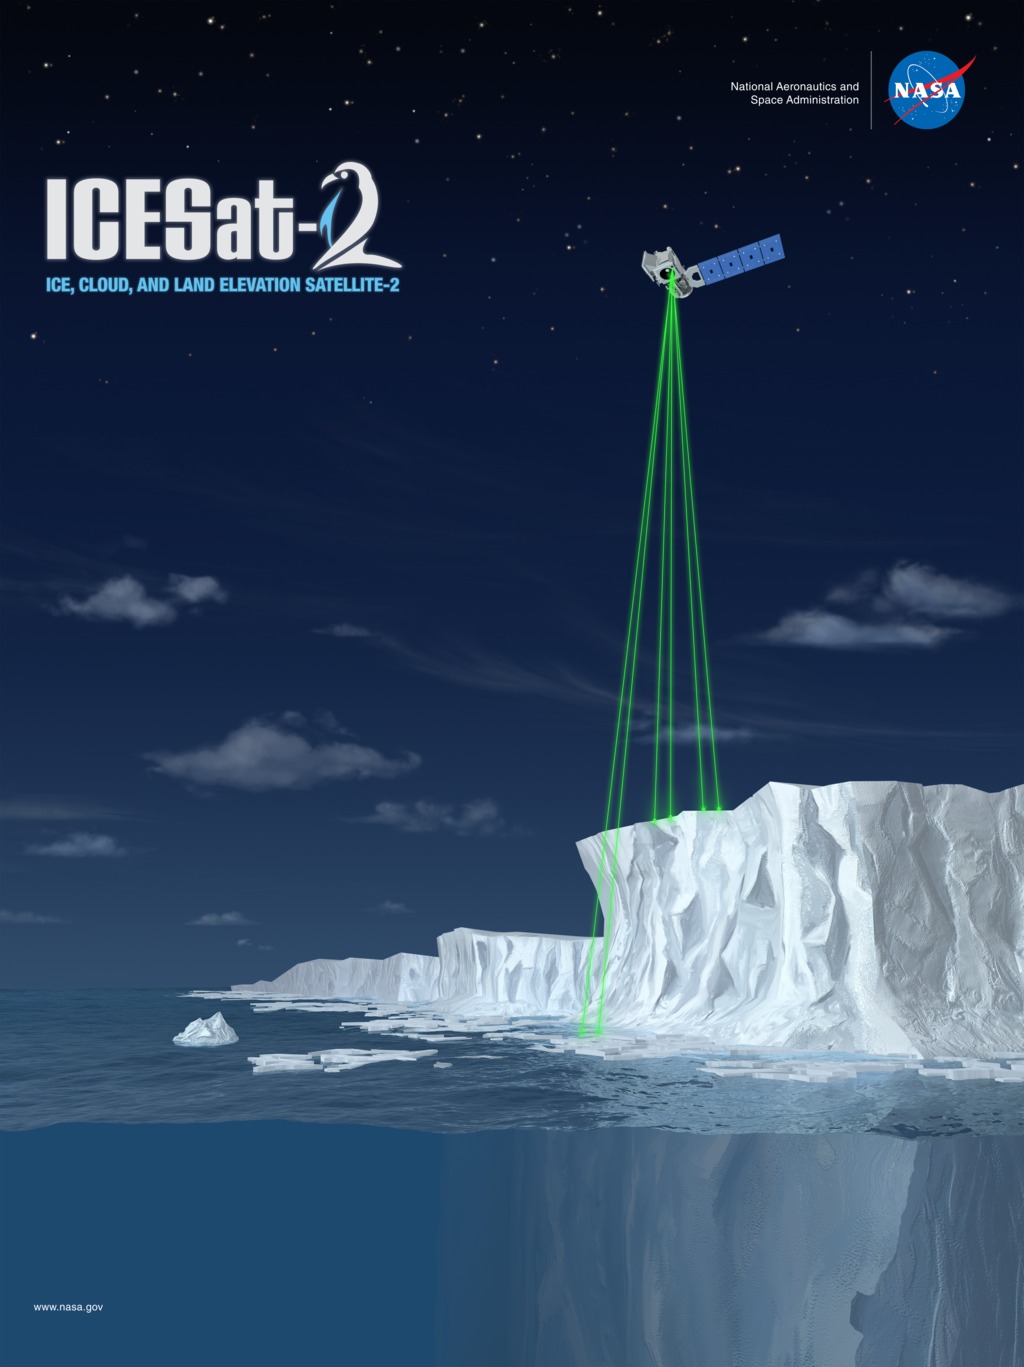
- Section
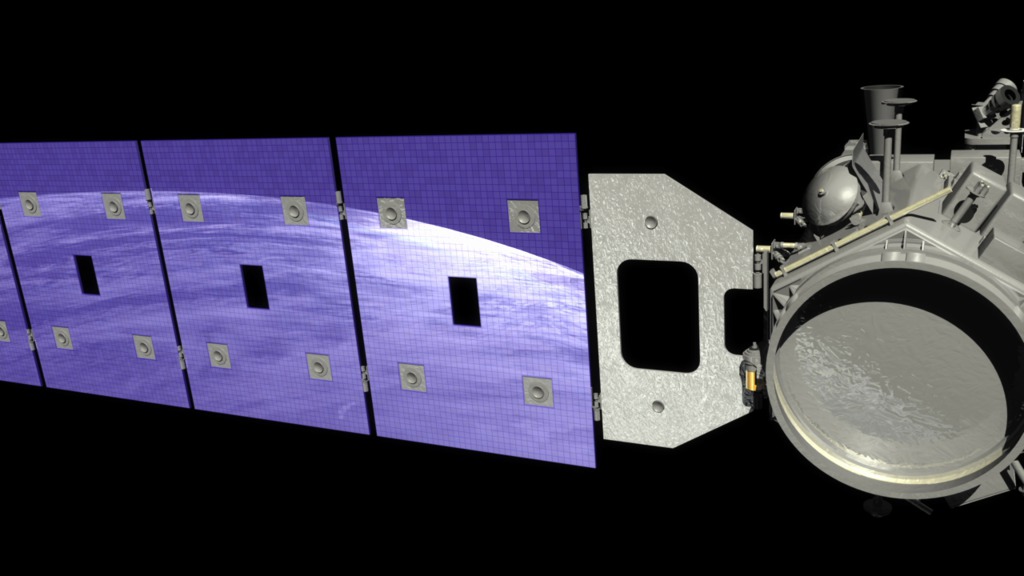
Spacecraft Poster Still
Go to this sectionThe Ice, Cloud and land Elevation Satellite-2, or ICESat-2, is a laser altimeter that will measure the heights of Earth’s surfaces. With ICESat-2’s high-resolution data, scientists will track changes to Earth’s ice-covered poles, which is witnessing dramatic temperature increases. The mission will also take stock of forests, map ocean surfaces, characterize clouds and more. ICESat-2 carries a single instrument called the Advanced Topographic Laser Altimeter System (ATLAS), equipped with a multiple-beam laser, which sends 10,000 pulses of light to the ground each second. A small fraction of the light photons bounce off Earth’s surface and return to the instrument, where a photon-counting detector times their flight. Knowing this time, and the satellite’s position and orientation in space, scientists can calculate Earth’s elevation below. ICESat-2 continues key elevation observations begun by the original ICESat satellite (2003 to 2009) and Operation IceBridge (2009 through present), to provide a portrait of change in the beginning of the 21st century. ICESat-2 is slated for launch on a Delta-II rocket in 2017.