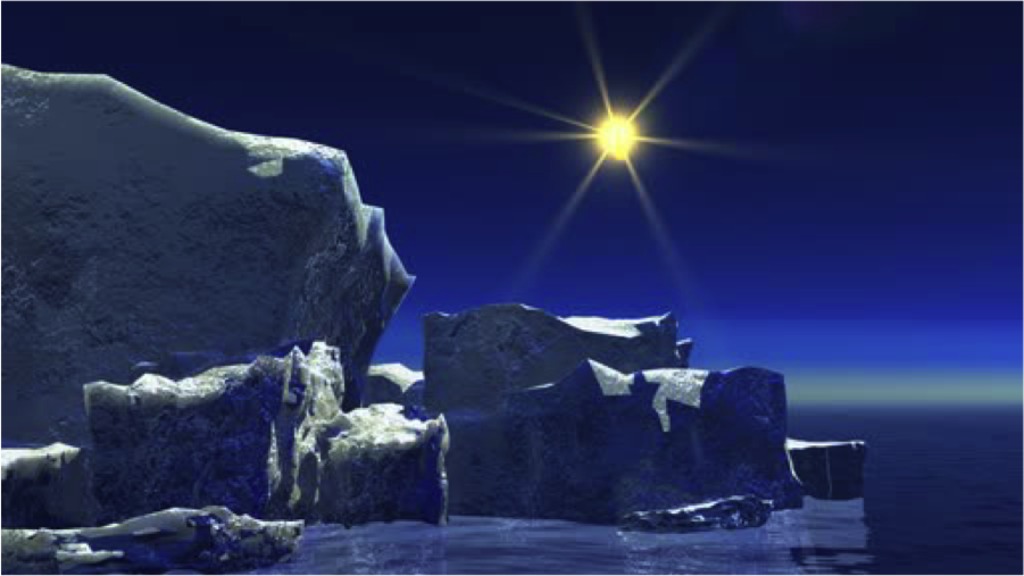
Sept. 28th, 2015
(updated May 3rd, 2023)
This gallery was created for Earth Science Week 2015 and beyond. It includes a quick start guide for educators and first-hand stories (blogs) for learners of all ages by NASA visualizers, scientists and educators. We hope that your understanding and use of NASA's visualizations will only increase as your appreciation grows for the beauty of the science they portray, and the communicative power they hold. Read all the blogs and find educational resources for all ages at: the Earth Science Week 2015 page.It all began with my fourth grade teacher, Mrs. Benner. Back then my school had a weather station and one day she had asked me to collect wind speed and temperature data. I soon found myself in charge of the morning weather forecast and soon this was my favorite part of the day. Little did I know that in the years that would follow, I’d pursue my passion for clouds and meteorology to become a research scientist at NASA. Working at NASA is every bit as cool as it sounds! Everyday is different and I always find myself working with new scientific tools to uncover mysteries about our planet Earth. Lately I’ve been studying the cryosphere, or the world’s frozen places, where I’m using scientific visualizations to understand the impacts of climate change in the Arctic. In particular I’m focusing on melting sea ice to understand how it affects Arctic cloud formation.Arctic clouds are made up of tiny liquid droplets and ice particles that form from condensation and then freezing of water vapor. Water vapor is a necessary ingredient for Arctic cloud formation, and evaporation from the Arctic Ocean can serve as an important source of water vapor. But when sea ice sits on the Arctic Ocean it acts as a lid that prevents evaporation and may limit Arctic cloud formation. Over the past decade the amount of Arctic sea ice has declined dramatically and we think this trend may be influencing Arctic cloud formation.I created a visualization showing the hypothesized response of clouds to melting in sea ice (below). The difference between the left panel, "Current Conditions," and the right panel, "Future Conditions," is that less sea ice in the future leads to more evaporation, and more evaporation leads to more water vapor and increased cloudiness. This hypothesis is where I base my research, using state-of-the-art NASA satellite instruments including CALIPSO and CloudSAT. ||
Read more