Global Snow Cover and Sea Ice Cycle at Both Poles
Visualization showing the changes in snow cover and sea ice with the seasons, for the years 2019-2021.
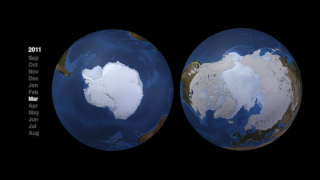
Global snow cover and sea ice waxes and wanes with the seasons, as the axial tilt of the Earth with respect to the Sun oscillates throughout the year. As can be seen in this visualization, the cycles of ice and snow are about six months out of phase between the Northern and Southern Hemispheres, since the north is tilted towards the Sun when the nouth is tilted away, and vice versa.
Snow cover and sea ice, north only
Snow cover and sea ice, south only
Date bar only
Credits
Please give credit for this item to:
NASA's Scientific Visualization Studio
-
Visualizers
- Trent L. Schindler (USRA)
-
Alex Kekesi
(Global Science and Technology, Inc.)

Datasets used
-
BMNG (Blue Marble: Next Generation) [Terra and Aqua: MODIS]
ID: 508Credit: The Blue Marble data is courtesy of Reto Stockli (NASA/GSFC).
This dataset can be found at: http://earthobservatory.nasa.gov/Newsroom/BlueMarble/
See all pages that use this dataset -
IMS Daily Northern Hemisphere Snow and Ice Analysis (IMS Daily Northern Hemisphere Snow and Ice Analysis - 24 km Resolution) [Interactive Multisensor Snow and Ice Mapping System (IMS)]
ID: 778This dataset can be found at: http://nsidc.org/data/docs/noaa/g02156_ims_snow_ice_analysis/
See all pages that use this dataset -
10 km Daily Sea Ice Concentration [SHIZUKU (GCOM-W1): AMSR2]
ID: 795Credit: AMSR2 data courtesy of the Japan Aerospace Exploration Agency (JAXA).
See all pages that use this dataset -
10 km Daily 89 GHz Brightness Temperature [SHIZUKU (GCOM-W1): AMSR2]
ID: 796Credit: AMSR2 data courtesy of the Japan Aerospace Exploration Agency (JAXA).
See all pages that use this dataset
Note: While we identify the data sets used on this page, we do not store any further details, nor the data sets themselves on our site.
Older Versions
- ID: 3944
 Visualization
Release date
This page was originally published on Friday, April 22, 2022.
This page was last updated on Monday, January 6, 2025 at 12:24 AM EST.