ICESat-2 Land Ice Height Change
At the whole ice sheet scale, this visualization shows the continued draw down of the major outlet glaciers in West Antarctica and in parts of East Antarctica between April 2019 and July 2021. Some areas show hints of blue, indicating places where the ice sheet surface has gone up, reflecting either increased snowfall or changes in ice dynamics.
NASA’s ICESat-2 satellite measures the elevation of Earth’s surfaces – and two data products from the mission map the height of Antarctic and Greenland ice sheets, as well as how those ice sheets change over time. The ICESat-2 ATL14 data product provides a reference ice sheet surface corresponding to the ice sheet elevation in April 2019, while ATL15 provides elevation changes to that surface through time. These products are re-generated every 91 days, which is how long it takes ICESat-2 to complete its 1,387 unique orbits and collect a complete grid of measurements. Every time ATL14 and 15 are regenerated, all of the data over the life of the mission is used to improve the April 2019 standard, and best represent how the ice sheets are changing. ATL14 is posted at 100m resolution, and ATL15 is posted at 1 km resolution at one month time resolution.
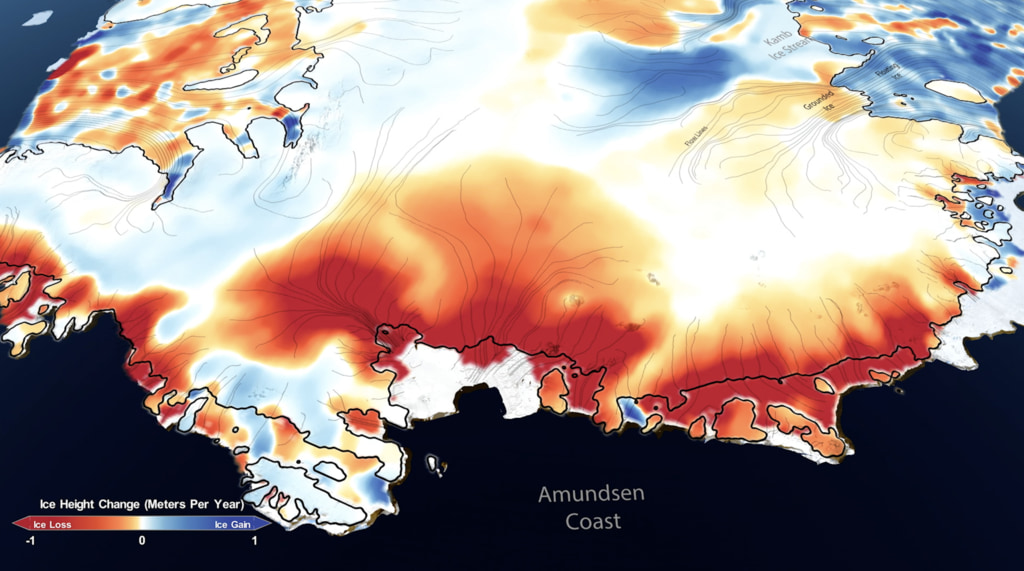
Along the Siple Coast of West Antarctica, the Mercer, Whillans, and Kamb ice streams feed into the larger floating Ross Ice Shelf. This visualization of ICESat-2 data products shows that elevations are increasing in this sector, due to the long-term slowdown of these ice streams, while small subglacial lakes are evident in bright contrast to the larger scale changes.
Zooming into Antarctica’s Pine Island Glacier, this visualization of the ICESat-2 elevation data reinforces the well-studied loss of ice in this sector. Pine Island is one of the fastest-retreating glaciers in the continent, as relatively warm water melts the base of the ice where it meets the ocean.
ICESat-2 ground tracks converge at the 88 degrees north and south latitudes. In Antarctica, some of the most subtle elevation changes are in the ice sheet interior, near 88 degrees south latitude. By aggregating data through time, ICESat-2 can resolve elevation changes to a fraction of an inch.
In Greenland, ICESat-2 data shows the loss of ice around the margins of the ice sheet between April 2019 and July 2021. Note that the color scale in Greenland spans from a loss of 6 meters (20 feet) to 0 meters, showing that very little of the ice sheet is gaining mass.
The ATL14 and 15 data products are also produced over the peripheral ice caps in the Arctic, such as these in Svalbard, Norway, and Russian islands. Here we see elevation losses of up to 20 meters between April 2019 and July 2021, visualizing the ongoing collapse of these smaller ice caps.

Diverging red/blue color bar with range of -2m to 2m. Values near 0 are transparent.
Diverging red/blue color bar with range of -10m to 10m. Values near 0 are transparent.
Diverging red/blue color bar with range of -0.35m to 0.35m. Values near 0 are transparent.
Black, red, and white color bar with range of -6m to 0.
Black, red, and white color bar with range of -20m to 0.
Credits
Please give credit for this item to:
NASA's Scientific Visualization Studio
-
Visualizer
- Kel Elkins (USRA)
-
Producer
- Ryan Fitzgibbons (KBR Wyle Services, LLC)
-
Scientists
- Benjamin E. Smith (University of Washington Applied Physics Lab Polar Science Center)
- Thomas A. Neumann (NASA/GSFC)
-
Writer
- Kate Ramsayer (Telophase)
-
Technical support
- Ian Jones (ADNET Systems, Inc.)
- Laurence Schuler (ADNET Systems, Inc.)
Release date
This page was originally published on Sunday, May 15, 2022.
This page was last updated on Monday, January 6, 2025 at 12:20 AM EST.
Datasets used
-
[ICESat-2: Advanced Topographic Laser Altimeter System (ATLAS)]
ID: 1112
Note: While we identify the data sets used on this page, we do not store any further details, nor the data sets themselves on our site.
Related
- ID: 13600
 Produced Video