Global Precipitation Measurement
Overview
The Global Precipitation Measurement (GPM) mission is an international network of satellites that provide the next-generation global observations of rain and snow. Building upon the success of the Tropical Rainfall Measuring Mission (TRMM), the GPM concept centers on the deployment of a "Core" satellite carrying an advanced radar / radiometer system to measure precipitation from space and serve as a reference standard to unify precipitation measurements from a constellation of research and operational satellites. Through improved measurements of precipitation globally, the GPM mission helps to advance our understanding of Earth's water and energy cycle, improve forecasting of extreme events that cause natural hazards and disasters, and extend current capabilities in using accurate and timely information of precipitation to directly benefit society. GPM, initiated by NASA and the Japan Aerospace Exploration Agency (JAXA) as a global successor to TRMM, comprises a consortium of international space agencies, including the Centre National d'Études Spatiales (CNES), the Indian Space Research Organization (ISRO), the National Oceanic and Atmospheric Administration (NOAA), the European Organization for the Exploitation of Meteorological Satellites (EUMETSAT), and others. The GPM Core Observatory launched from Tanegashima Space Center, Japan, at 1:37 PM EST on February 27, 2014.
For more information and resources please visit the Precipitation Measurement Missions web site.
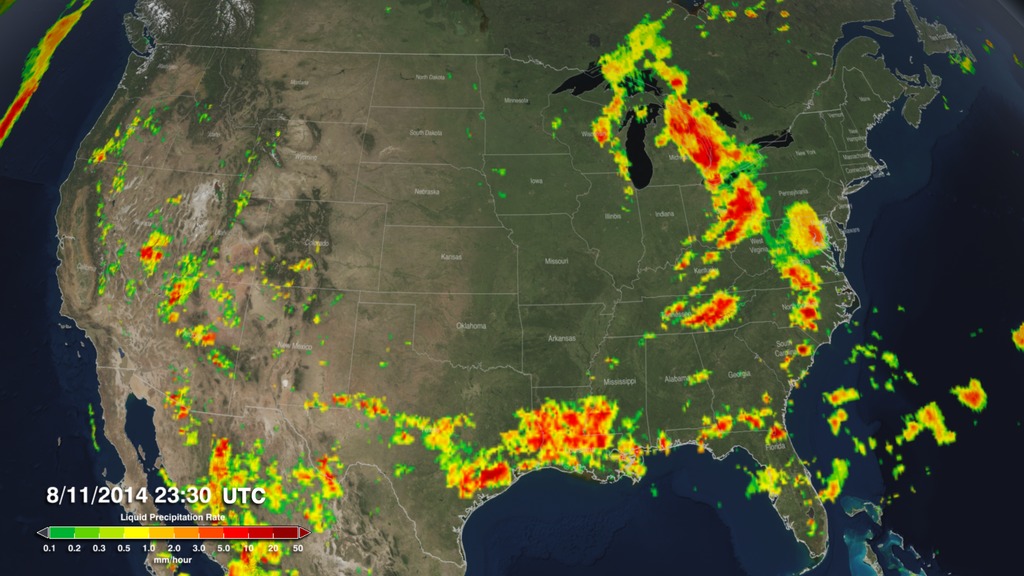
Near Real-Time IMERG
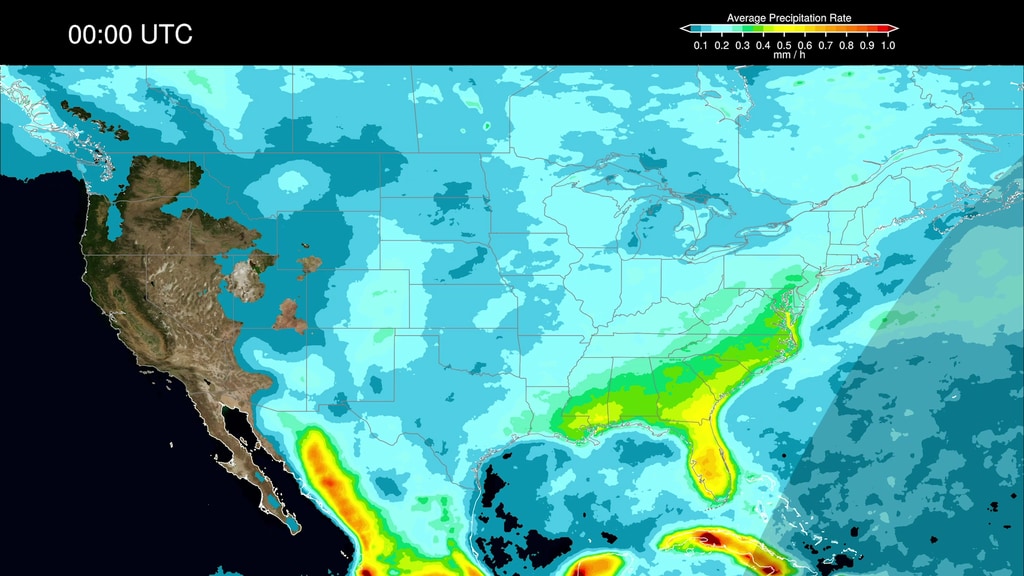
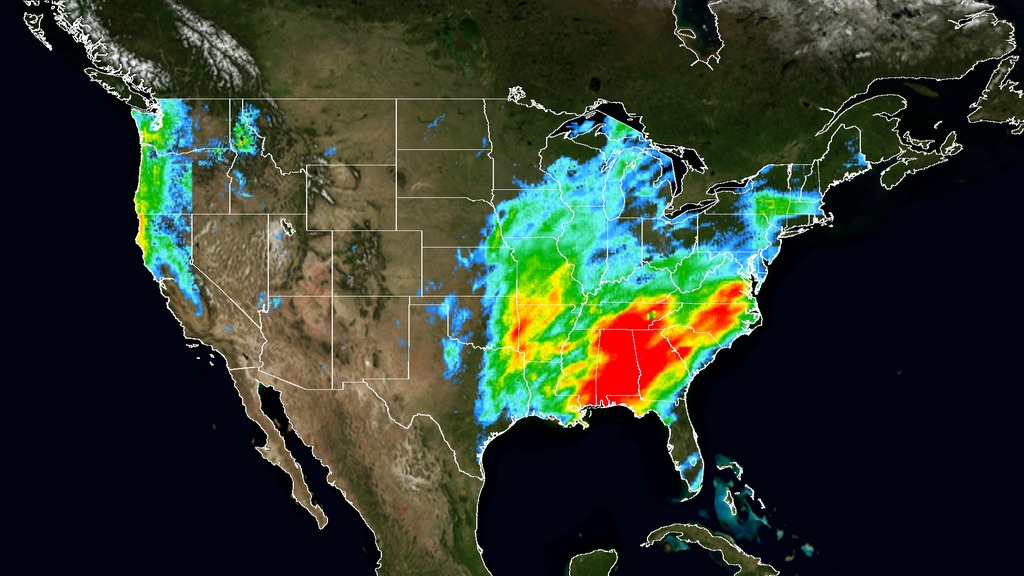
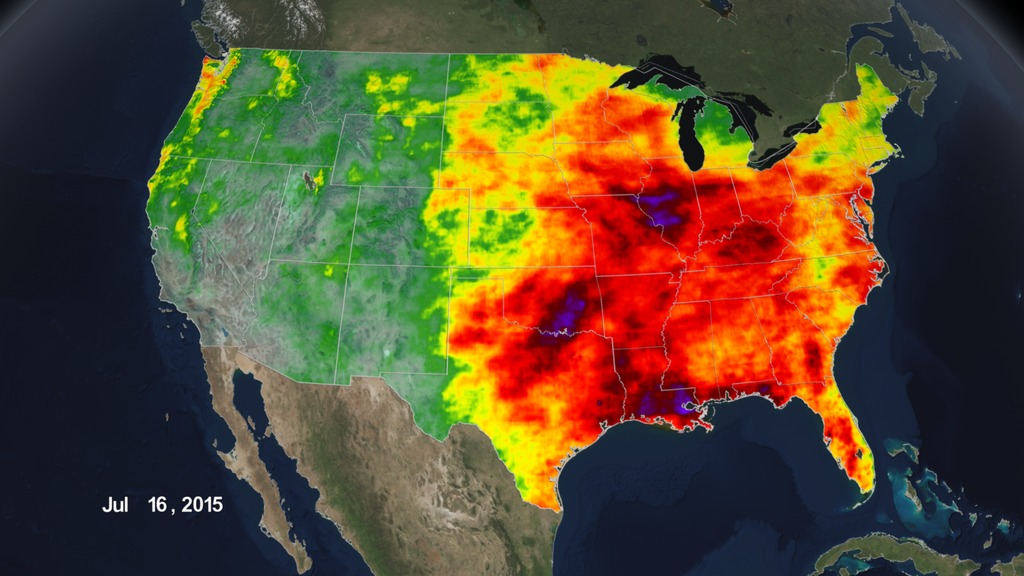
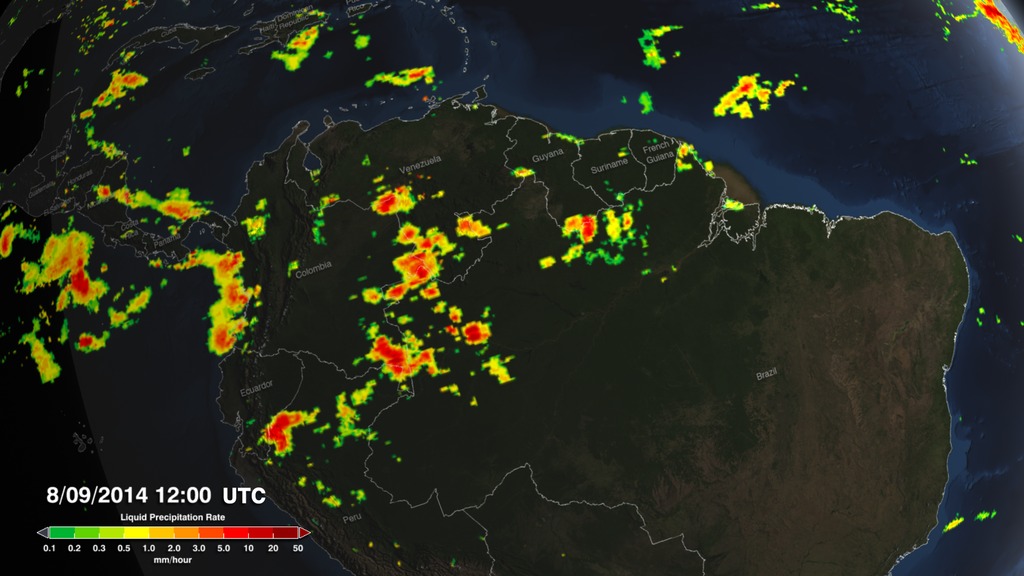
The global IMERG precipitation dataset provides rainfall rates for the entire world every thirty minutes.
- ID: 4285 Visualization
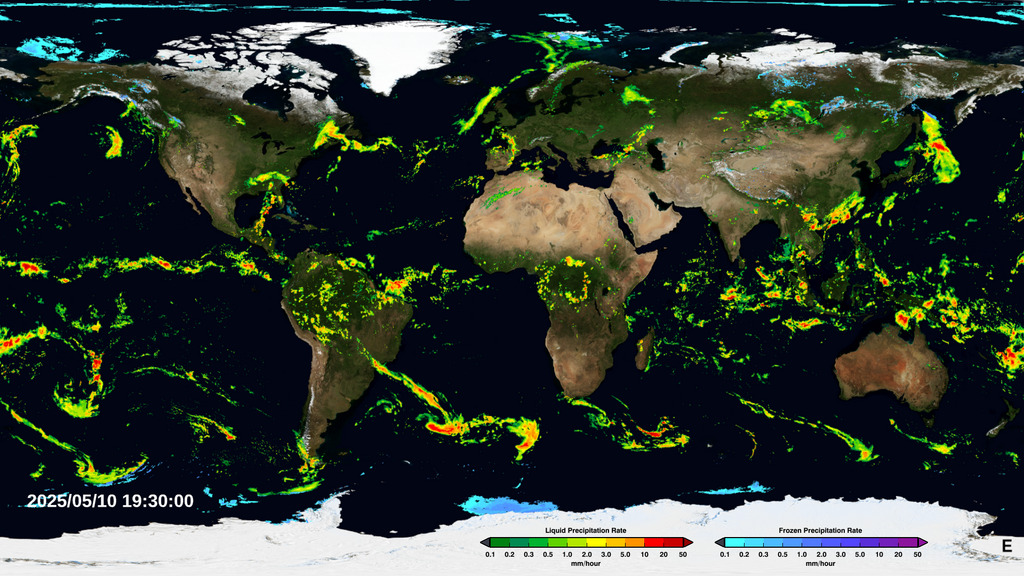
Near Real-Time Global Precipitation from the Global Precipitation Measurement Constellation
Go to this pageAn animation of the most currently available global precipitation data from IMERG.
Hurricane Seasons
- ID: 5468 Visualization
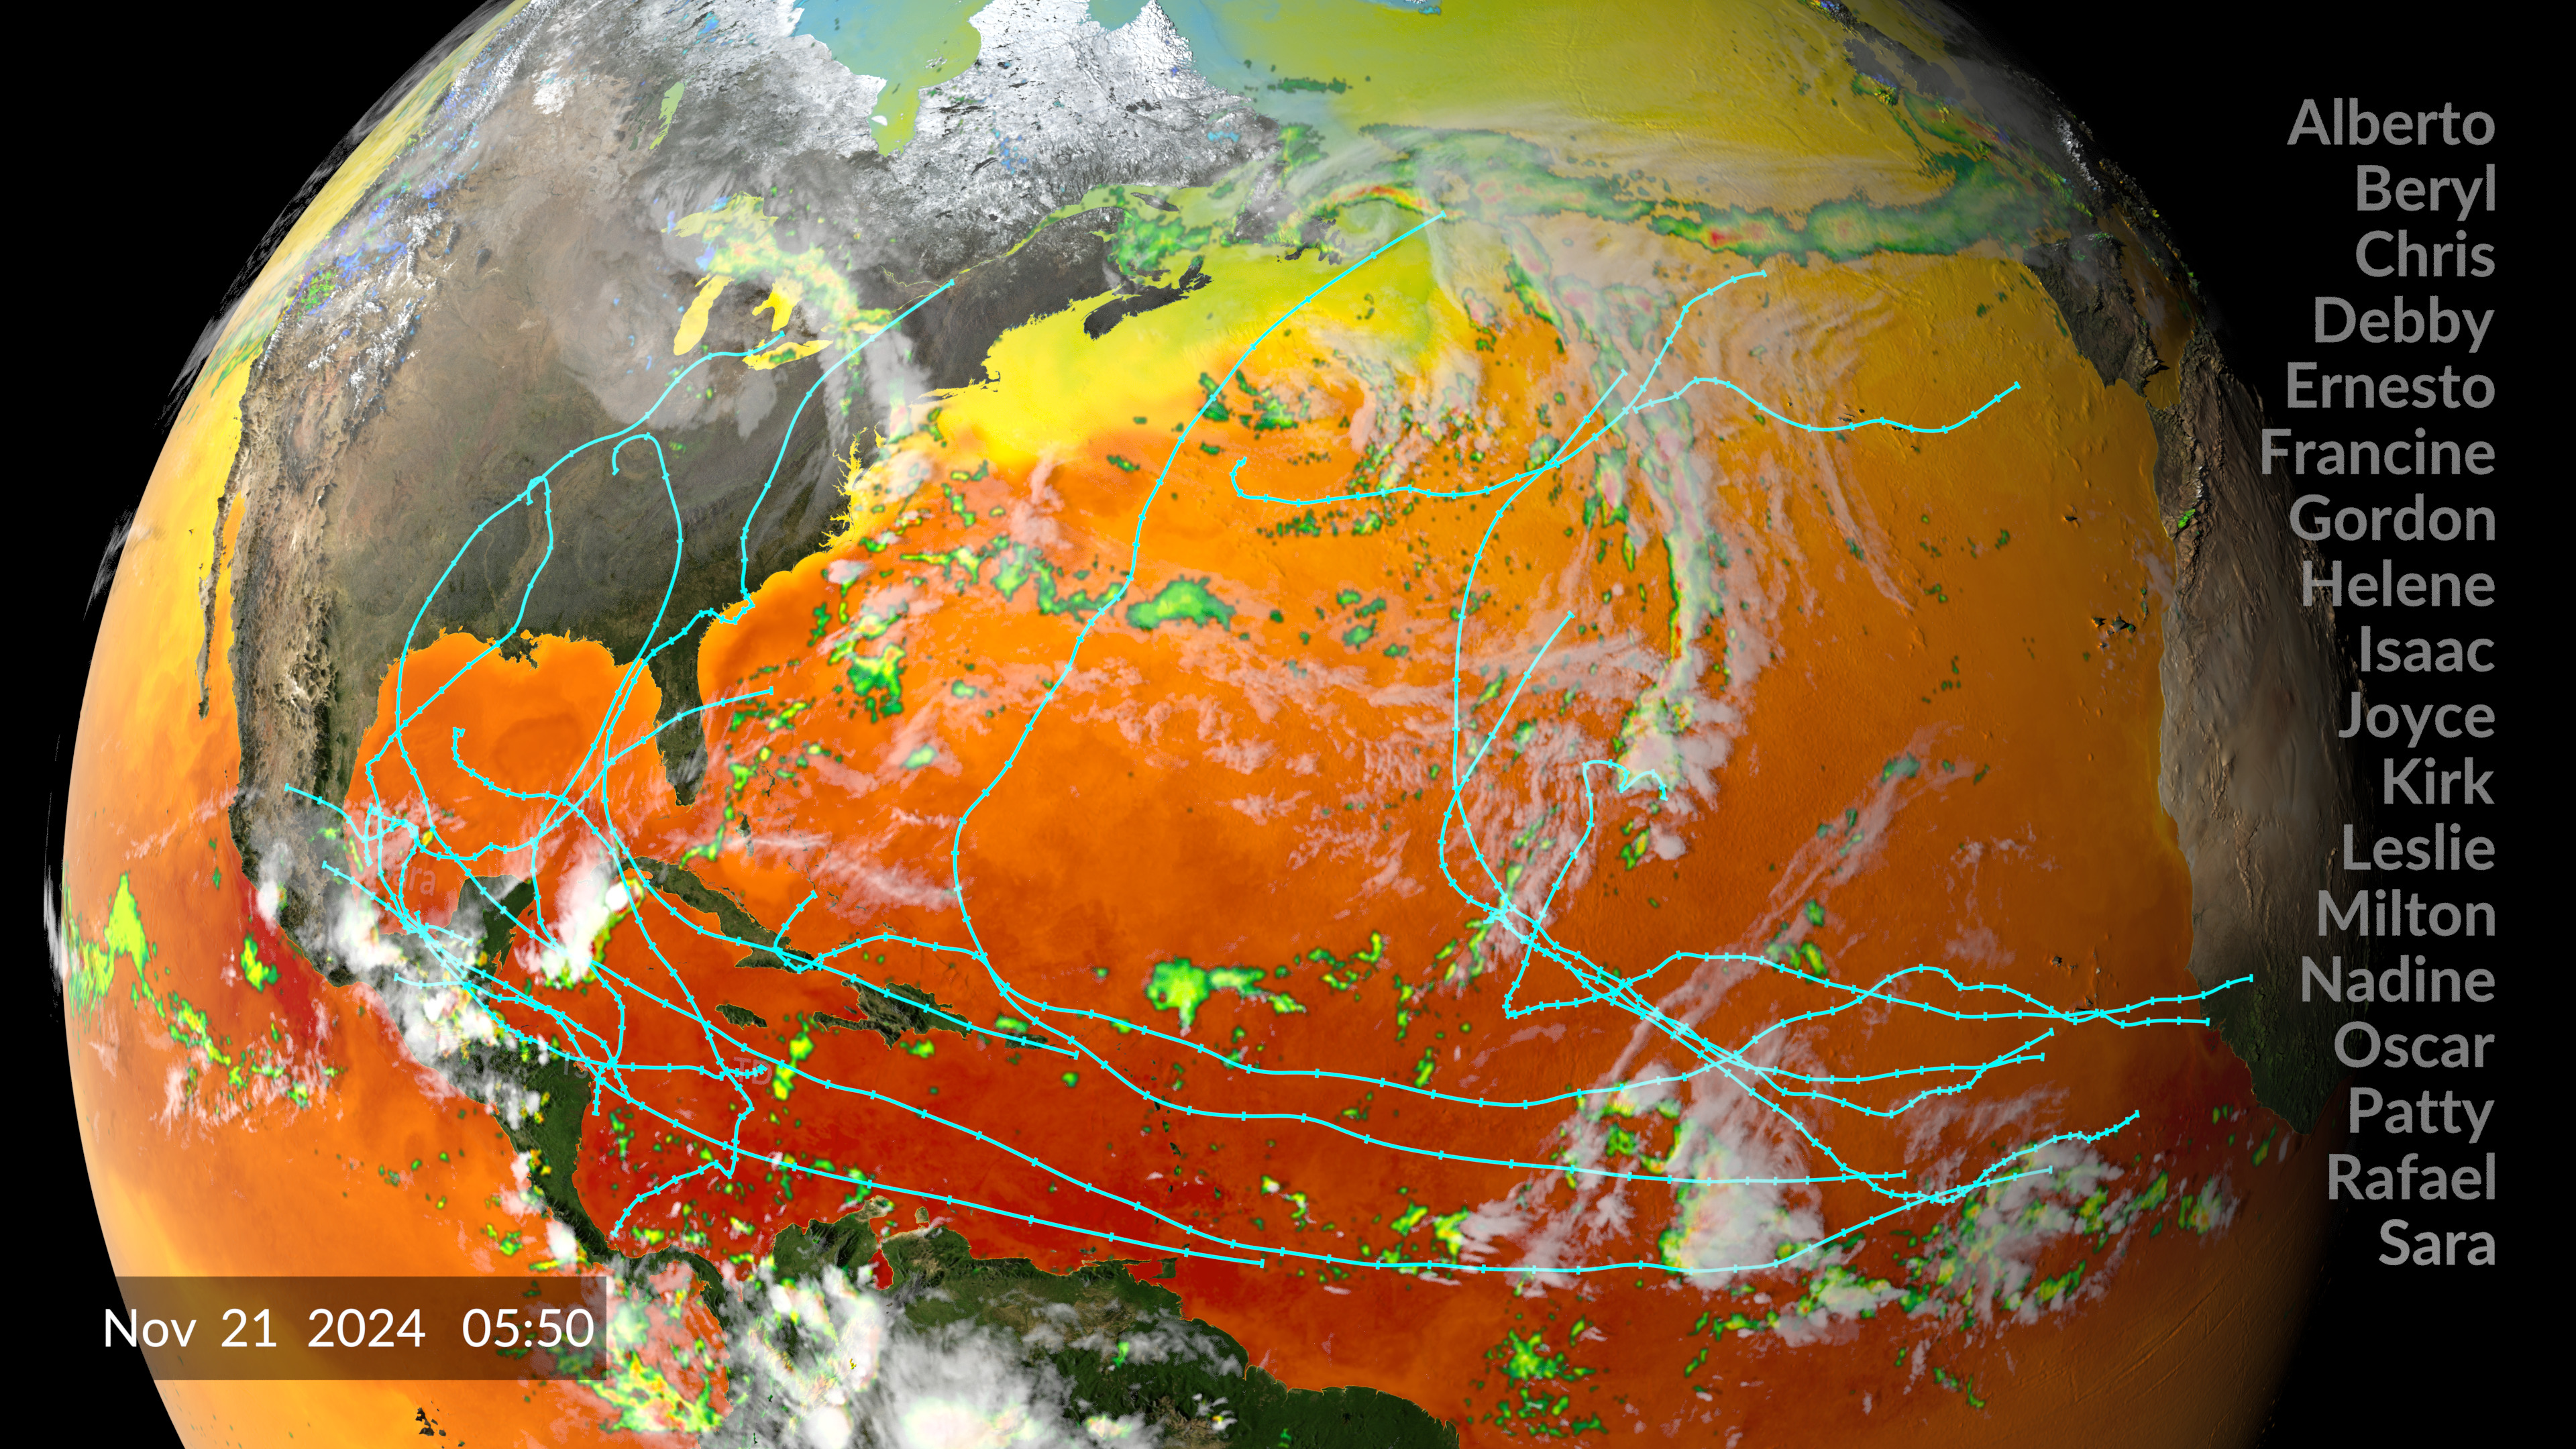
2024 Atlantic Hurricane Season
Go to this pageSST, IMERG, CPC, and Hurricane tracks for the entire 2024 Hurricane Season. Also providing separate visualizations of just SST with tracks, IMERG with tracks, and CPC with tracks.
- ID: 5305 Visualization

2023 Atlantic Hurricane Season
Go to this pageThe 2023 Atlantic Hurricane Season from June 1st through October 31st. The colors over the ocean are Sea Surface Temperatures where reds are high temperatures and blues are low. The colors underneath the clouds are precipitation measurements, where red is high and greens are low. Each hurricane name tracks with it's corresponding storm and leaves behind category designations (TD=Tropical Depression; TS=Tropical Storm; and 1 through 5 are hurricane strengths) as each storm increases and decreases in strength. || hurr2023_v34_ALL_2024-06-26_1103.00001_print.jpg (1024x576) [234.5 KB] || hurr2023_v34_ALL_2024-06-26_1103.00001_searchweb.png (320x180) [101.0 KB] || hurr2023_v34_ALL_2024-06-26_1103.00001_thm.png (80x40) [6.8 KB] || hurr2023_v34_ALL_2024-06-26_1103_1080p30.webm (1920x1080) [44.7 MB] || All_Data_in_HD [0 Item(s)] || hurr2023_v34_ALL_2024-06-26_1103_1080p30.mp4 (1920x1080) [739.1 MB] || ALL_Data_in_UHD [0 Item(s)] || hurr2023_v34_ALL_4k.mp4 (3840x2160) [2.3 GB] ||
- ID: 5097 Visualization
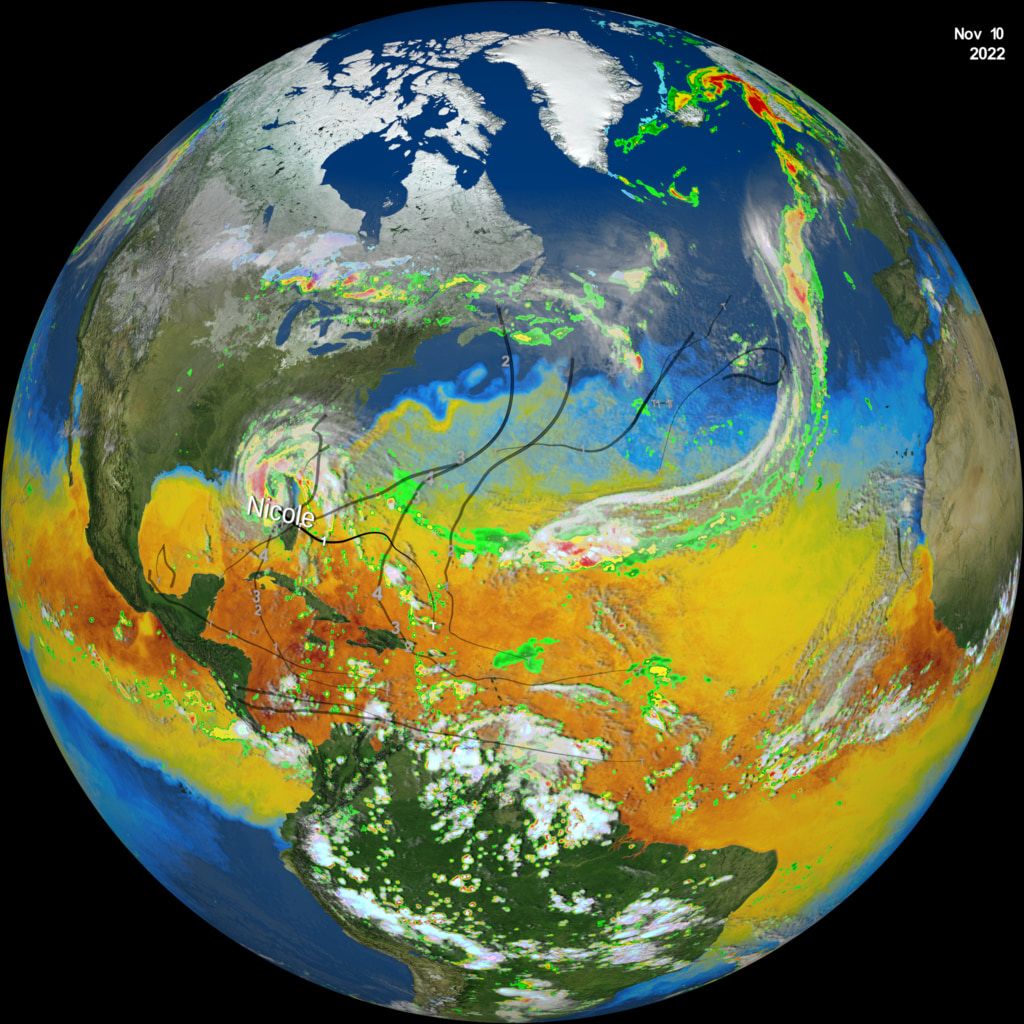
2022 Hurricane Season
Go to this page2022 Atlantic hurricane season. || hurr2022_v6.8800_print.jpg (1024x1024) [452.1 KB] || hurr2022_v6.8800_searchweb.png (320x180) [126.2 KB] || hurr2022_v6.8800_thm.png (80x40) [8.2 KB] || 2160x2160_1x1_30p (2160x2160) [0 Item(s)] || hurr2022_v6_2160p30.webm (2160x2160) [107.7 MB] || hurr2022_v6_2160p30.mp4 (2160x2160) [1.4 GB] ||
- ID: 4947 Visualization
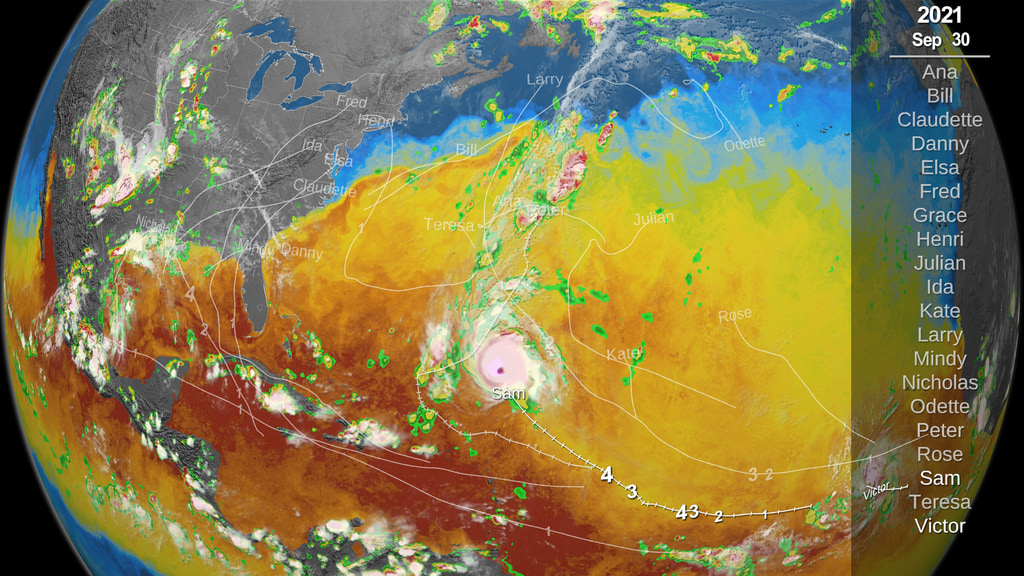
2021 Hurricane Season through September
Go to this pageThis data visualization shows hurricane tracks over clouds over precipitation over sea surface temperatures from May 1 through September 30th, 2021. This presentation was created for the COP 26 Conference. || hurr2021_4k_comp.4991_print.jpg (1024x576) [337.4 KB] || hurr2021_4k_comp.4991_searchweb.png (320x180) [123.6 KB] || hurr2021_4k_comp.4991_thm.png (80x40) [17.6 KB] || hurr2021_comp_1080p30.webm (1920x1080) [29.0 MB] || hurr2021_comp_1080p30.mp4 (1920x1080) [489.6 MB] || composite (3840x2160) [0 Item(s)] || hurr2021_comp_2160p30.mp4 (3840x2160) [1.7 GB] || hurr2021_comp_1080p30.mp4.hwshow [187 bytes] ||
- ID: 4884 Visualization
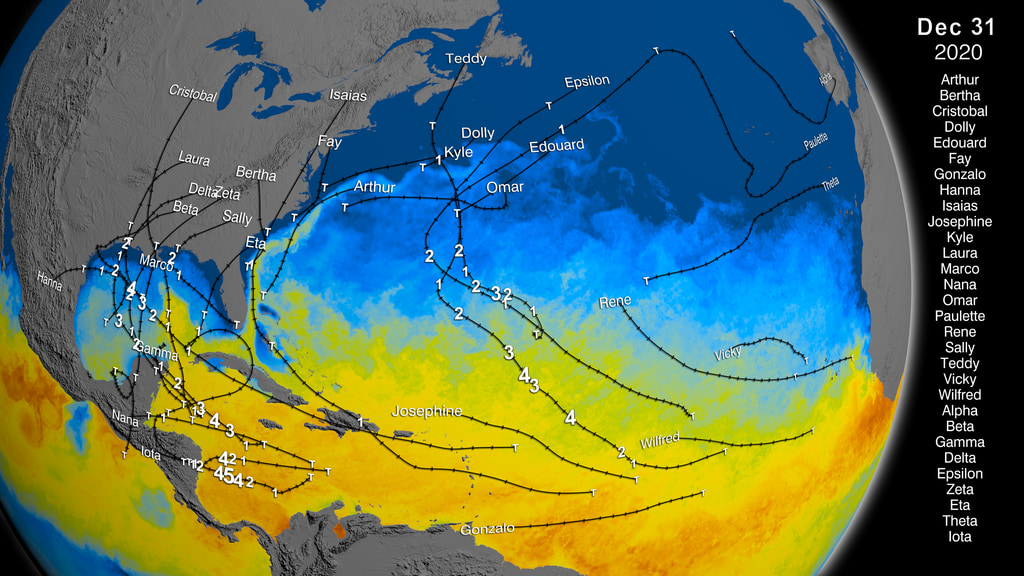
2020 Hurricane Season
Go to this pageData visualization of the 2020 Hurricane Season. Starts on May 1, 2020 just showing Sea Surface Temperatures and cloud cover. Precipitation data then dissolves in as hurricanes are tracked throughout 2020. Hurricane tracks include Hurricane strengths depicted with the letter "T" for Tropical Storm and numbers for each storm's respective strength. The visualization then culminates by showing all the storm tracks at once.This video is also available on our YouTube channel. || hurr2020_4k_comp.7968_print.jpg (1024x576) [248.0 KB] || hurr2020_4k_comp.7968_searchweb.png (320x180) [93.7 KB] || hurr2020_4k_comp.7968_thm.png (80x40) [7.3 KB] || Example_Composite (1920x1080) [0 Item(s)] || hurr2020_comp_1080p30.mp4 (1920x1080) [637.6 MB] || Example_Composite (3840x2160) [0 Item(s)] || captions_silent.30824.en_US.srt [43 bytes] || hurr2020_4k_comp_2160p30.webm (3840x2160) [167.6 MB] || hurr2020_4k_comp_2160p30.mp4 (3840x2160) [1.6 GB] || hurr2020_comp_1080p30.mp4.hwshow [187 bytes] ||
- ID: 4586 Visualization
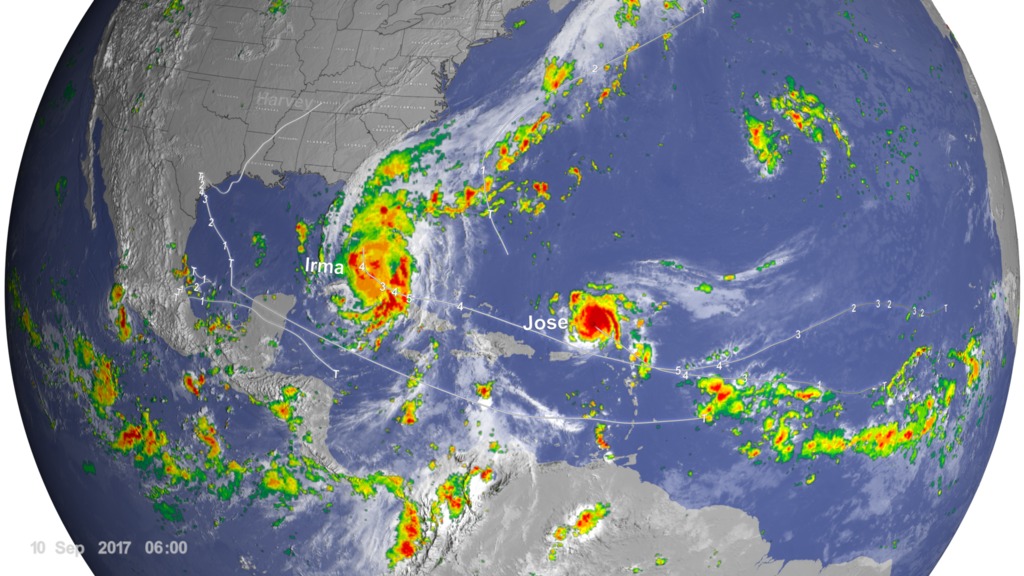
Hurricane Tracks from 2017 with Precipitation and Cloud Data
Go to this page2017 Atlantic Hurricane season storm tracks with IMERG precipitation and GOES clouds (01 Aug 2017 to 31 Oct 2017) || hurricane_tracks2017_09cpc.2500_print.jpg (1024x576) [187.1 KB] || hurricane_tracks2017_09cpc.2500_searchweb.png (180x320) [111.1 KB] || hurricane_tracks2017_09cpc.2500_thm.png (80x40) [8.1 KB] || atlantic (1920x1080) [0 Item(s)] || hurricane_tracks2017_1920x1080.webm (1920x1080) [28.1 MB] || hurricane_tracks2017_1920x1080.mp4 (1920x1080) [504.9 MB] || 3840x2160_16x9_30p (3840x2160) [0 Item(s)] || hurricane_tracks2017_640x360p30.mp4 (640x360) [78.6 MB] || hurricane_tracks2017_4k.mp4 (3840x2160) [1.5 GB] ||
2026 Hurricanes & Typhoons
- ID: 5662 Visualization

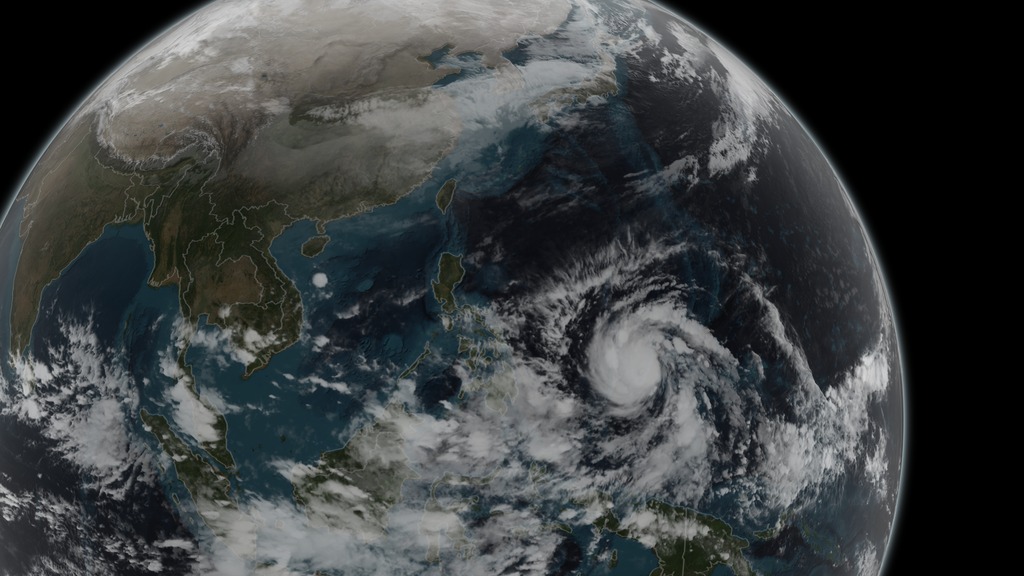
Super Typhoon Bavi
Go to this pageSuper Typhoon Bavi on July 10, 2026 as it undergoes an eyewall replacement. || Bavi_v22_2026-07-13_163030.03600_print.jpg (1024x576) [187.6 KB] || Bavi_v22_2026-07-13_163030.03600_searchweb.png (320x180) [103.2 KB] || Bavi_v22_2026-07-13_163030.03600_thm.png (80x40) [7.5 KB] || Bavi_v22HD.mp4 (1920x1080) [67.8 MB] || 1920x1080_16x9_30p (1920x1080) [2601 Item(s)] || 4096x4096_1x1_30p (3840x2160) [2601 Item(s)] || Bavi_v22UHD.mp4 (3840x2160) [173.4 MB] || Bavi_v22UHD.mp4.hwshow [177 bytes] ||
- ID: 5641 Visualization

Powerful Typhoon Sinlaku strikes the Northern Marianas
Go to this pageTyphoon Sinlaku on April 12, 2026 at 12:08 UTC || newSinlaku_v14_2026-04-20_144235.03600_print.jpg (1024x576) [212.0 KB] || newSinlaku_v14_2026-04-20_144235.03600_searchweb.png (320x180) [112.0 KB] || newSinlaku_v14_2026-04-20_144235.03600_thm.png (80x40) [8.5 KB] || newSinlaku_v14_2026-04-20_144235.mp4 (1920x1080) [44.9 MB] || 1920x1080_16x9_30p (1920x1080) [3101 Item(s)] || newSinlaku_v14_2026-04-20_144235.webm (1920x1080) [9.9 MB] ||
2025 Hurricanes & Typhoons
- ID: 5575 Visualization

Powerful Hurricane Erin forms in the Atlantic
Go to this pageHurricane Erin on August 16, 2025 at approximately 10:23Z (6:23 EST) east of Puerto Rico and St. Thomas, U.S.V.I.
2024 Hurricanes & Typhoons
- ID: 5401 Visualization
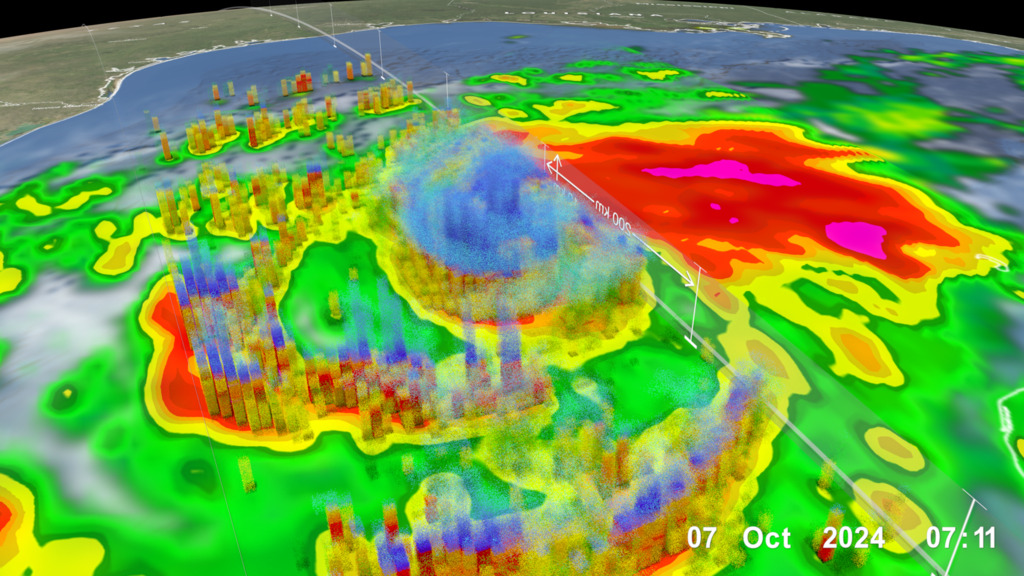
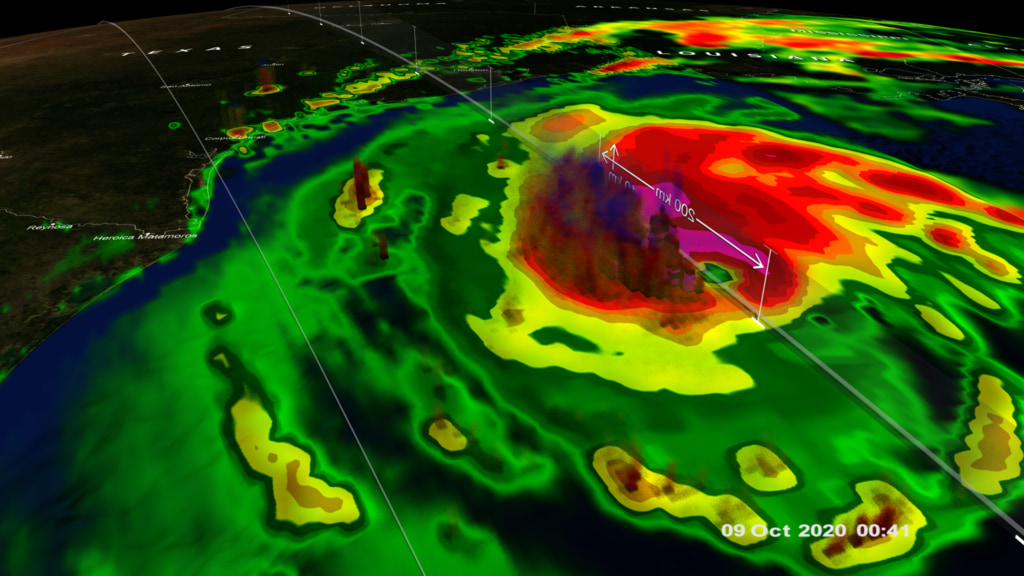
Powerful Hurricane Milton forms in the Gulf of Mexico, sweeps into Florida
Go to this pageExample composite showing how all the below animations can be combined into one long segment showing the lifecycle of Hurricane Milton through the eyes of GPM beginning October 6 ending October 9, 2024. || milton_lifecycle.00001_print.jpg (1024x576) [236.4 KB] || milton_lifecycle.mp4 (1920x1080) [287.6 MB] ||
- ID: 5380 Visualization
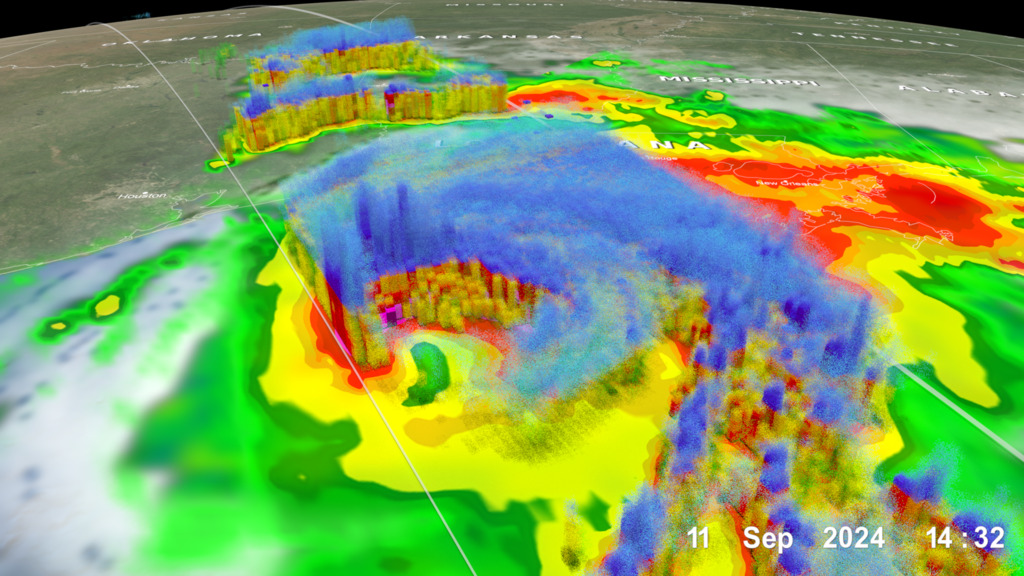
Hurricane Francine Hits Gulf Coast States and More
Go to this pageHurricane Francine was captured twice by the GPM satellite on September 11, 2024 and one more time on September 12, 2024. This animation is a composite example of the three seperate data visualizations below. Each visualization can either be shown on their own or as one continuous shot as depicted here.
2023 Hurricanes & Typhoons
- ID: 5181 Visualization
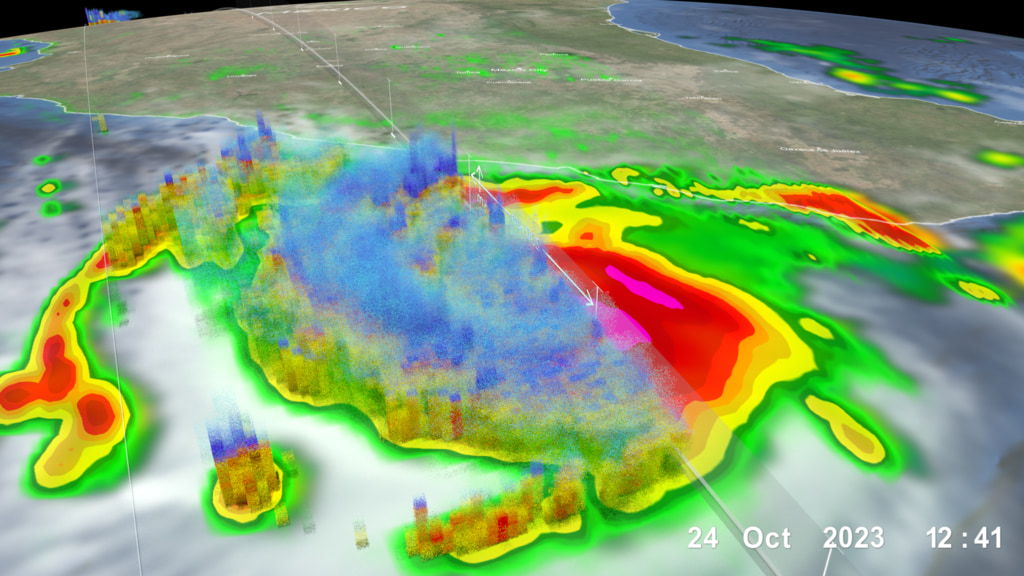
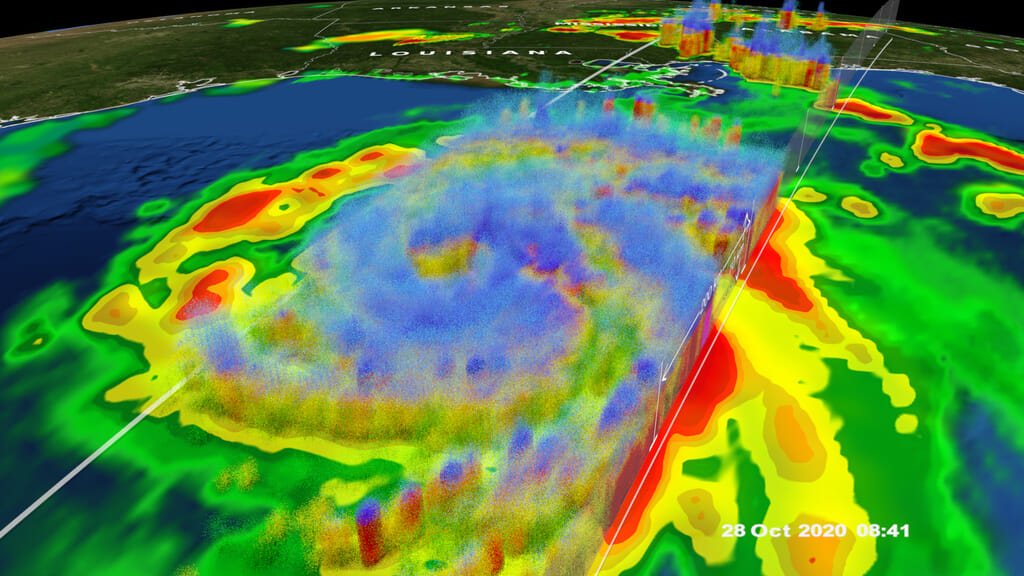
Hurricane Otis Strikes Acapulco, Mexico as a Powerful Category 5 Storm
Go to this pageHurricane Otis on October 24, 2023 at 12:41Z as it approached Mexico, prior to intensifying into the first recorded Category 5 hurricane to hit the Mexican Pacific coast. || Otis_001.4300_print.jpg (1024x576) [230.4 KB] || Otis_001.4300_searchweb.png (320x180) [111.8 KB] || Otis_001.4300_thm.png (80x40) [8.5 KB] || Otis_001_1080p30.mp4 (1920x1080) [56.9 MB] || 1920x1080_16x9_30p (1920x1080) [0 Item(s)] || Otis_001_1080p30.webm (1920x1080) [5.7 MB] || Otis_001_1080p30.mp4.hwshow [181 bytes] ||
- ID: 5146 Visualization
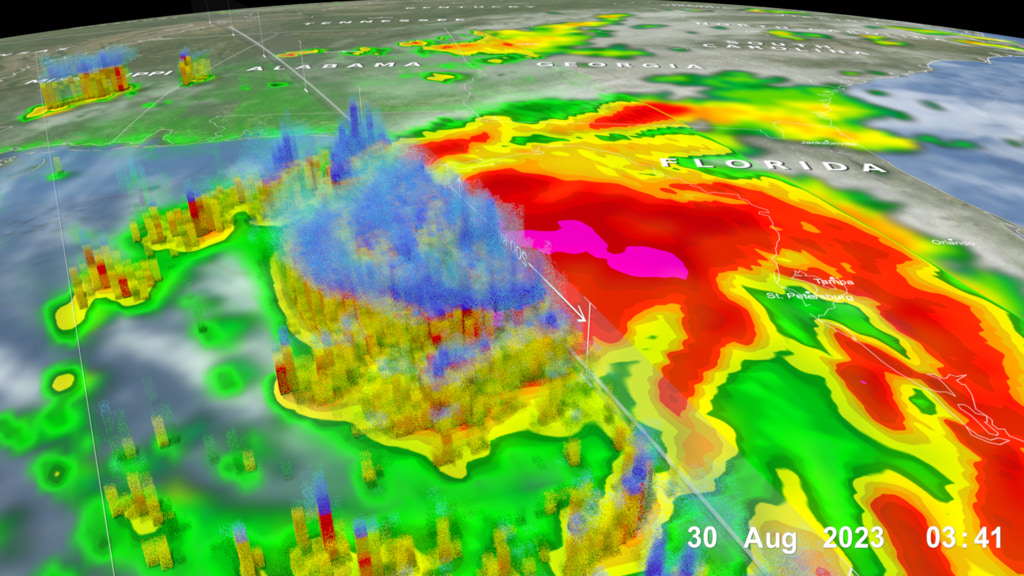
Powerful Hurricane Idalia Makes Landfall in the Big Bend of Florida
Go to this pageHurricane Idalia on it's approach to Florida on August 30, 2023 at 3:41Z. || Idalia_001.4300_print.jpg (1024x576) [270.1 KB] || Idalia_001.4300_searchweb.png (320x180) [118.4 KB] || Idalia_001.4300_thm.png (80x40) [8.7 KB] || Idalia_001_1080p30.mp4 (1920x1080) [54.2 MB] || 1920x1080_16x9_30p (1920x1080) [0 Item(s)] || Idalia_001_1080p30.webm (1920x1080) [5.9 MB] || Idalia_001_1080p30.mp4.hwshow [184 bytes] ||
- ID: 5174 Visualization
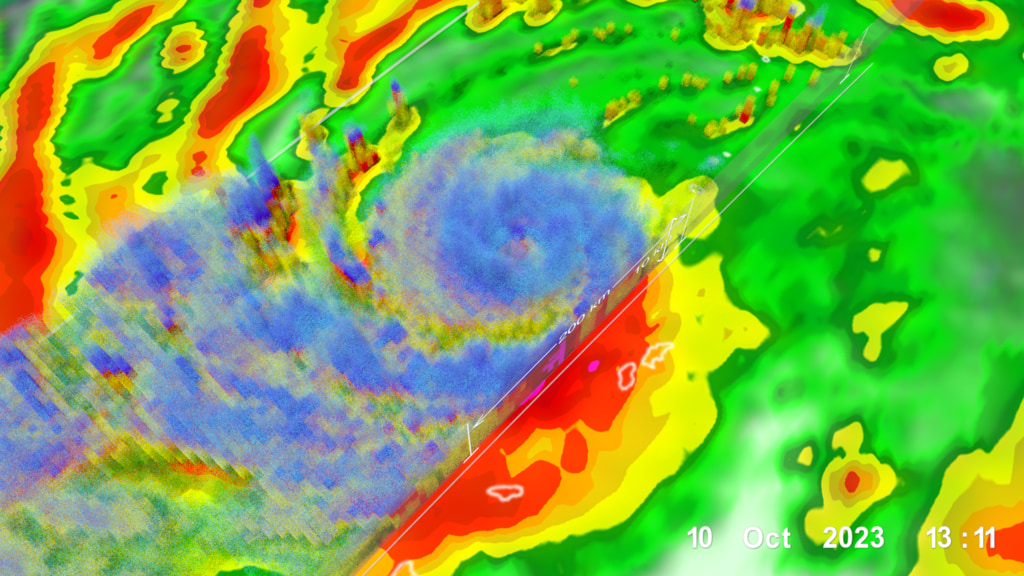
GPM Views Typhoon Bolaven
Go to this pageTyphoon Bolaven on October 10, 2023 at 13:11Z. || Bolaven_001.4300_print.jpg (1024x576) [291.1 KB] || Bolaven_001.4300_searchweb.png (320x180) [120.9 KB] || Bolaven_001.4300_thm.png (80x40) [8.7 KB] || Bolaven_001_1080p30.mp4 (1920x1080) [73.7 MB] || 1920x1080_16x9_30p (1920x1080) [0 Item(s)] || Bolaven_001_1080p30.webm (1920x1080) [5.9 MB] || Bolaven_001_1080p30.mp4.hwshow [185 bytes] ||
- ID: 5145 Visualization
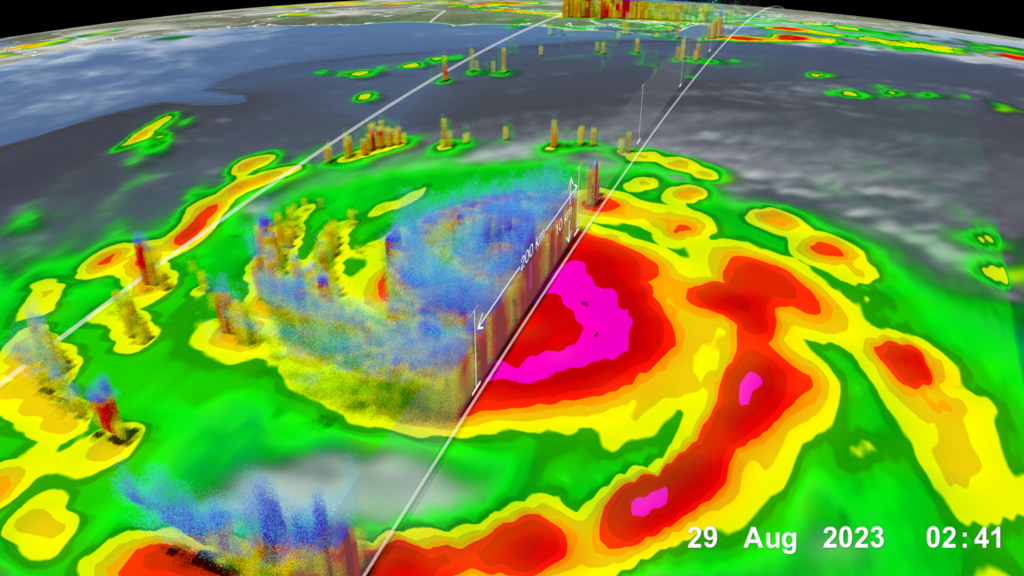
Franklin Re-intensifies over the Western Atlantic
Go to this pageHurricane Franklin in the Atlantic on August 29, 2023 at 2:41Z || Franklin_001.4300_print.jpg (1024x576) [237.7 KB] || Franklin_001.4300_searchweb.png (320x180) [108.1 KB] || Franklin_001.4300_thm.png (80x40) [8.4 KB] || Franklin_001_1080p30_2.mp4 (1920x1080) [52.4 MB] || 1920x1080_16x9_30p (1920x1080) [0 Item(s)] || Franklin_001_1080p30_2.webm (1920x1080) [5.7 MB] || Franklin_001_1080p30_2.mp4.hwshow [188 bytes] ||
- ID: 5135 Visualization
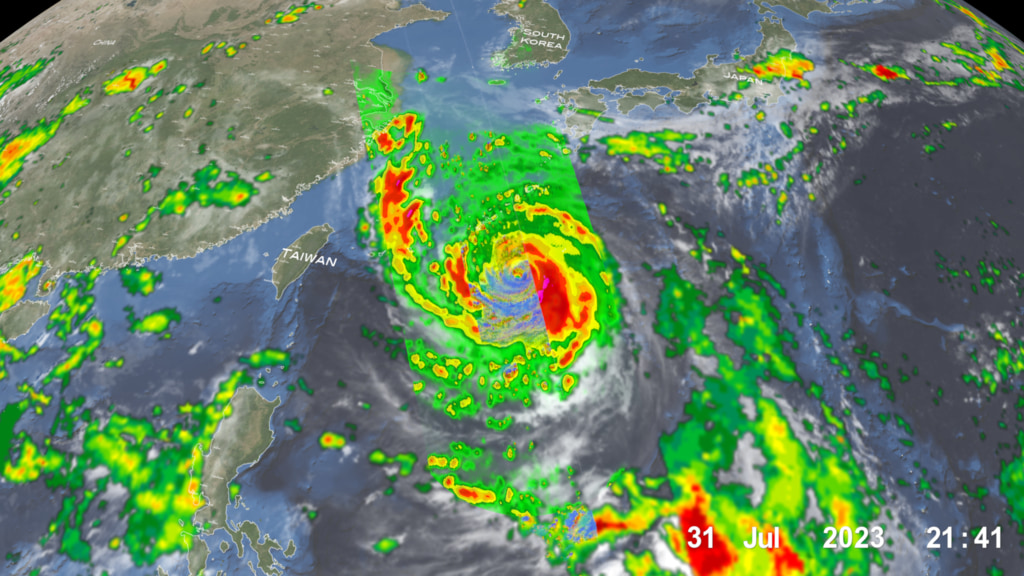
GPM Captures Powerful Typhoon Khanun Approaching the Ryukyus
Go to this pageTyphoon Khanun on July 31, 2023 at 21:41Z on it's approach to Japan. || Khanun_001.2200_print.jpg (1024x576) [255.7 KB] || Khanun_001.2200_searchweb.png (320x180) [132.2 KB] || Khanun_001.2200_thm.png (80x40) [8.6 KB] || Khanun_001_1080p30.mp4 (1920x1080) [95.3 MB] || 1920x1080_16x9_30p (1920x1080) [0 Item(s)] || Khanun_001_1080p30.webm (1920x1080) [6.3 MB] || Khanun_001_1080p30.mp4.hwshow [184 bytes] ||
- ID: 5129 Visualization
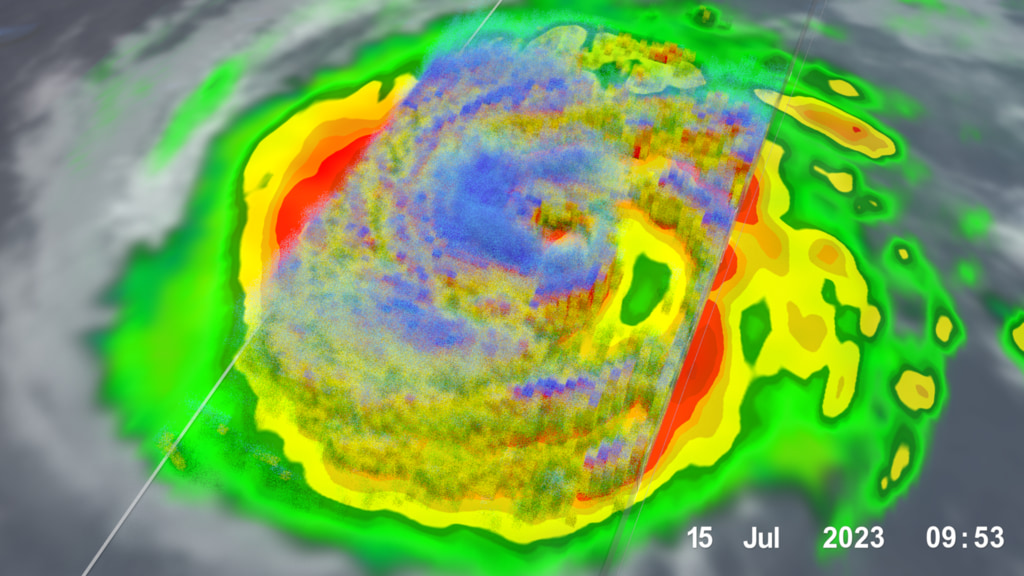
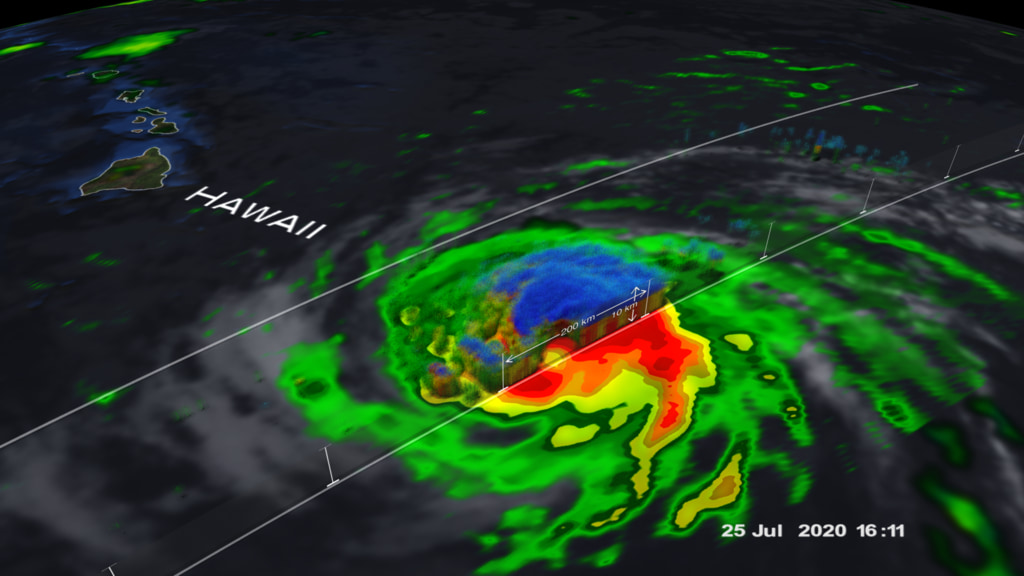
Calvin becomes first major hurricane in the East Pacific
Go to this pageHurricane Calvin on July 15, 2023 at approximately 8:45 UTC. as it continues to move toward the Hawaiian Islands. || Calvin_001.4300_print.jpg (1024x576) [221.9 KB] || Calvin_001.4300_searchweb.png (320x180) [109.1 KB] || Calvin_001.4300_thm.png (80x40) [8.5 KB] || Calvin_001_1080p30_2.mp4 (1920x1080) [70.9 MB] || 1920x1080_16x9_30p (1920x1080) [0 Item(s)] || Calvin_001_1080p30_2.webm (1920x1080) [5.9 MB] || Calvin_001_1080p30_2.mp4.hwshow [186 bytes] ||
- ID: 5122 Visualization
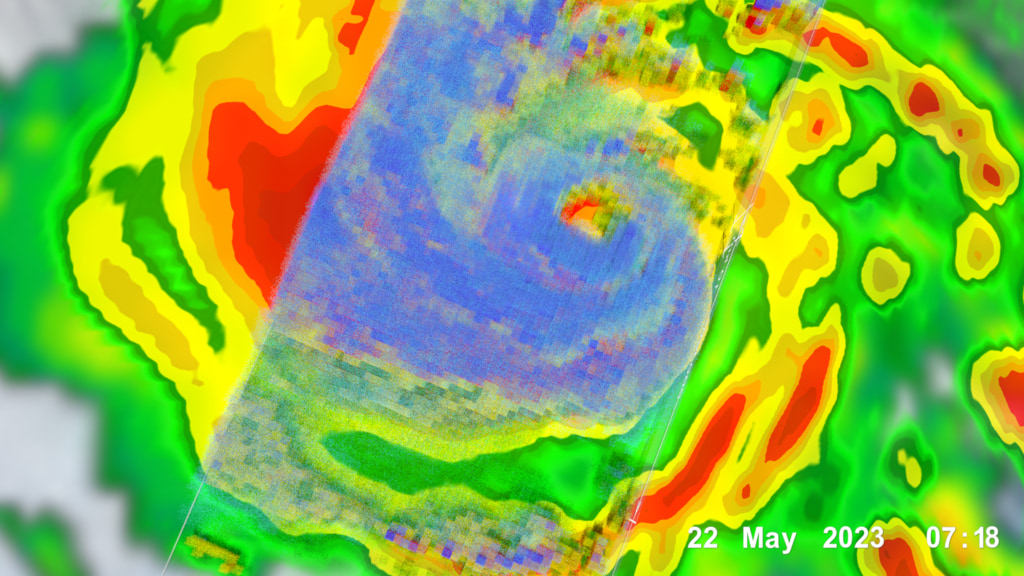
Typhoon Mawar
Go to this pageTyphoon Mawar captured on May 22, 2023 at 7:18Z. || Mawar_001.4300_print.jpg (1024x576) [271.5 KB] || Mawar_001.4300_searchweb.png (320x180) [114.4 KB] || Mawar_001.4300_thm.png (80x40) [8.4 KB] || Mawar_001_1080p30_2.mp4 (1920x1080) [94.5 MB] || 1920x1080_16x9_30p (1920x1080) [0 Item(s)] || Mawar_001_1080p30_2.webm (1920x1080) [6.3 MB] || Mawar_001_1080p30_2.mp4.hwshow [185 bytes] ||
- Section
NASA Tracks Freddy, Longest-lived Tropical Cyclone on Record
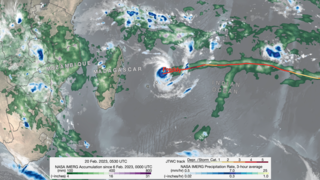
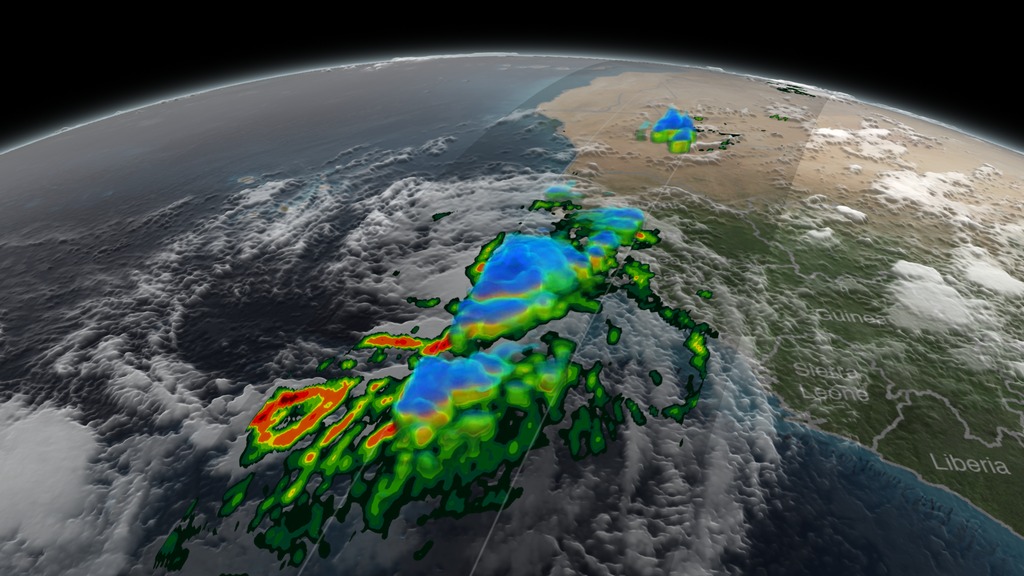
Go to this sectionTropical Cyclone Freddy first made landfall along the east coast of Madagascar just north of the town of Mananjary on Feb. 21, 2023, as a Category 3 cyclone with average winds reported at ~81 mph (130 km/h) and gusts up to ~112 mph (180 km/h). After crossing over Madagascar Freddy continued westward over the Mozambique Channel before making landfall again along the east coast of Mozambique just south of Vilankulos as a moderate tropical storm with sustained winds estimated at 50 mph. Despite being weaker at landfall, Freddy caused widespread flooding across parts of Mozambique due to the storm stalling out near the coast after making landfall. Incredibly, Freddy drifted back out over the Mozambique Channel, nearly making landfall along the southwest coast of Madagascar. It then changed direction, re-intensified, weakened, re-intensified one last time, and made landfall once again on March 11 near Quelimane, Mozambique, as a Category 1 cyclone with sustained winds reported at 90 mph. Meteorologically, Freddy has been a remarkable storm, becoming the longest-lived tropical cyclone in recorded history, lasting over five weeks. Freddy originated from a weak area of low pressure that was embedded in a monsoon trough of low pressure stretching east-west across the Timor Sea between northern Australia and southern Indonesia. On Feb 6, 15 days before it would make its first landfall in Madagascar, both the Australian Bureau of Meteorology and the US Joint Typhoon Warning Center reported the formation of Tropical Cyclone Freddy about 420 miles northwest of the northwest coast of Australia. In a rare but not unprecedented event, Freddy tracked across the entire Indian Ocean from east to west in almost a straight line with very little deviation in latitude. Along the way, Freddy underwent four separate rapid intensification cycles, the first southern hemisphere storm in history to do so. After hitting Mozambique the first time and re-emerging back over the Mozambique Channel, Freddy underwent at two additional rapid intensification cycles resulting from the competing effects of warm water, wind shear and dry air. Freddy was also the first storm to the reach the equivalent of Category 5 intensity on the Saffir-Simpson scale for 2023. In addition to being the longest-lived tropical cyclone in recorded history, Freddy set the record for having the highest accumulated cyclone energy (ACE) of any storm in history. ACE is an index used to measure the total amount of wind energy associated with a tropical cyclone over its lifetime.
NASA’s IMERG satellite precipitation product is ideal for monitoring and studying tropical cyclones around the world, especially over the open ocean where ground-based observations are sparse. IMERG uses precipitation estimates from a constellation of satellites united by the GPM Core Observatory to generate maps of global precipitation updated every 30 minutes in near real-time. The above animation shows IMERG surface rainfall estimates associated with the passage of Tropical Cyclone Freddy across the Indian Ocean as well as Freddy’s corresponding track and intensity. The animation begins at on Feb. 6, 2023, just before Freddy is about to form northwest of Australia. Over the course of the storm’s history, IMERG reveals a variety of precipitation features and trends that relate closely to the variations in Freddy’s intensity. Tropical cyclones derive their energy from latent heating, which comes primarily from cloud condensation. Although essentially undetectable directly, the most significant latent heat release occurs within deep convective towers, which are associated with high cold cloud tops and areas of heavy rain at the surface. The IMERG animation illustrates this association between increased surface rain intensity and storm intensity - whenever Freddy undergoes a period of intensification, it is preceded by an increase in heavy rain. However, for the storm to really respond to the latent heating, that heating must occur near the storm’s center. For example, IMERG shows heavier rain on Feb. 8, but it is too far north of the center, and Freddy continues to weaken. Conversely, an absence of heavy rain near the center typically causes the storm to weaken. IMERG is also able to broadly resolve Freddy’s structure over the course of its lifetime, ranging from a highly asymmetrical rain field with most of the rain located on one side of the center, which occurs when the storm is weak or undergoing wind shear, to symmetrical when the storm is stronger, to having a full eye when the storm has an intense and well-developed circulation. The end of the animation shows the total estimated rainfall for the entire period. IMERG shows that although heavy rain near the core of the storm is key to the storm maintaining or increasing in intensity, the highest overall rainfall totals are much more closely correlated to slow storm speed as evidenced by the extreme rainfall totals over Mozambique despite Freddy having weakened to a tropical storm. Here Freddy essentially stalls out for several days (Feb. 24 to March 2), allowing a sizeable portion of the storm’s circulation to remain over the warm waters of the Mozambique Channel and rainbands to continuously form and move inland. The result is rainfall totals on the order of ~16 to 31 inches (~400 to 800 mm, shown in purple) over parts of southern Mozambique and along the coast. Peak rainfall totals over Madagascar, where Freddy moved steadily across the island, are on the order of ~16 inches (400 mm). According to the latest media reports Freddy has been responsible for over 300 deaths in Mozambique, Madagascar and Malawi, and has caused widespread damage throughout these regions.
2022 Hurricanes & Typhoons
- ID: 5097 Visualization
2022 Hurricane Season
Go to this page2022 Atlantic hurricane season. || hurr2022_v6.8800_print.jpg (1024x1024) [452.1 KB] || hurr2022_v6.8800_searchweb.png (320x180) [126.2 KB] || hurr2022_v6.8800_thm.png (80x40) [8.2 KB] || 2160x2160_1x1_30p (2160x2160) [0 Item(s)] || hurr2022_v6_2160p30.webm (2160x2160) [107.7 MB] || hurr2022_v6_2160p30.mp4 (2160x2160) [1.4 GB] ||
- ID: 5050 Visualization
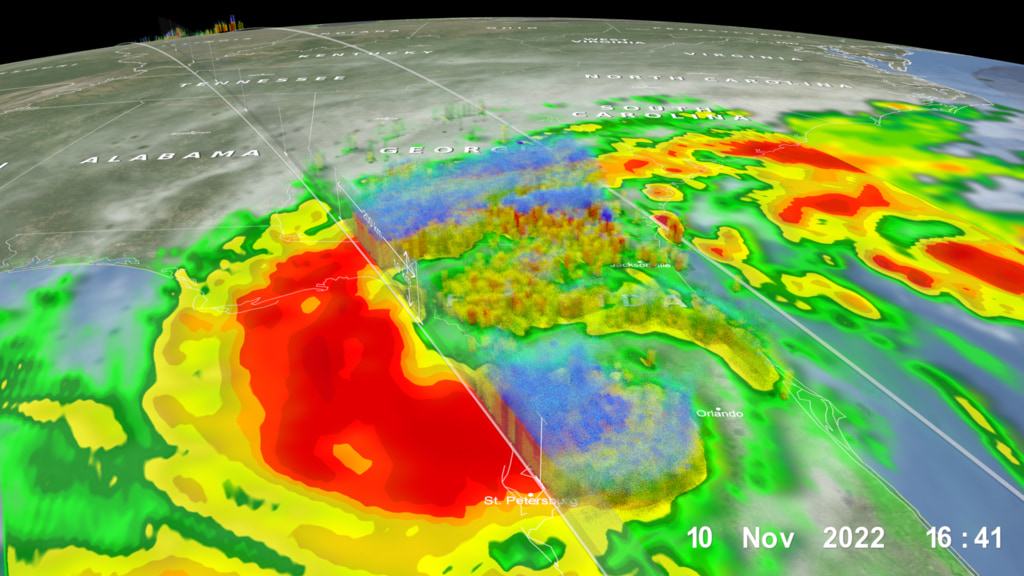
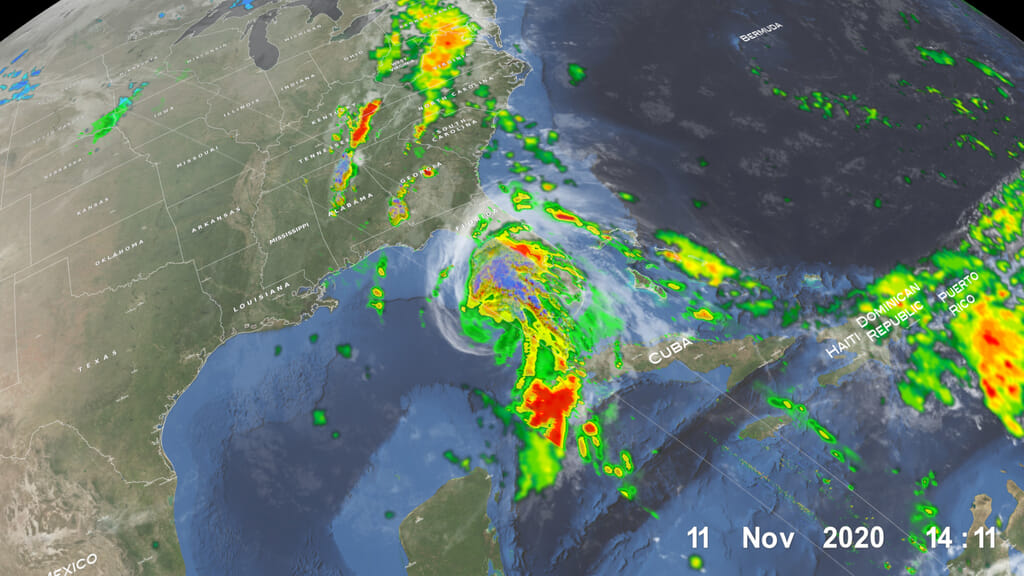
Nicole Brings Heavy Rain to Florida and part of the Southeast
Go to this pageTropical Storm Nicole at approxiately 16:30Z on November 10, 2022. Earlier that same day, Nicole made landfall on the eastern Florida coast as a category 1 hurricane. || nichole_v5.4300_print.jpg (1024x576) [235.5 KB] || nichole_v5.4300_searchweb.png (320x180) [111.3 KB] || nichole_v5.4300_thm.png (80x40) [8.3 KB] || nichole_v5_1080p30.mp4 (1920x1080) [49.0 MB] || 1920x1080_16x9_30p (1920x1080) [0 Item(s)] || nichole_v5_1080p30.webm (1920x1080) [5.8 MB] || nichole_v5_1080p30.mp4.hwshow [184 bytes] ||
- ID: 5037 Visualization
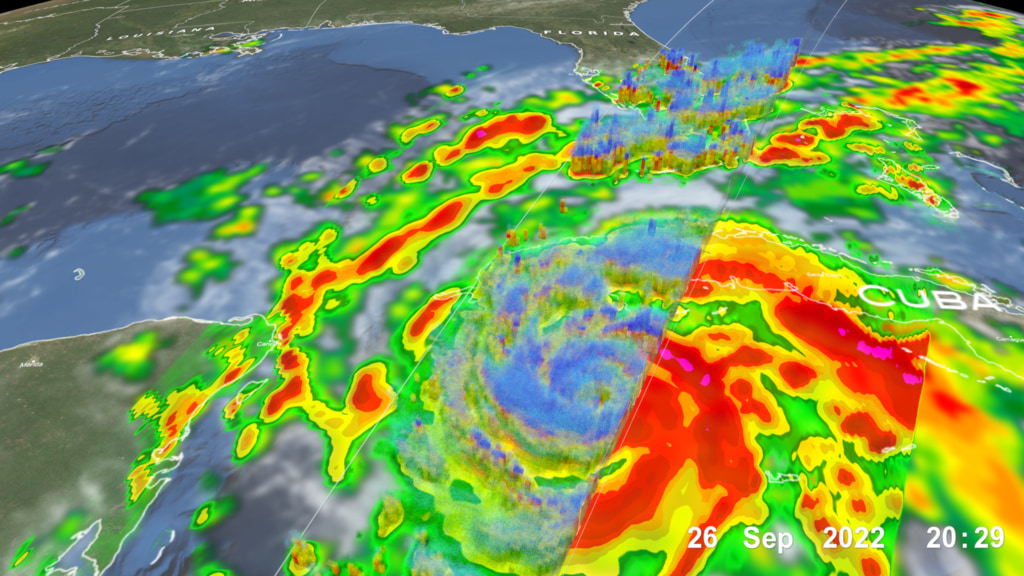
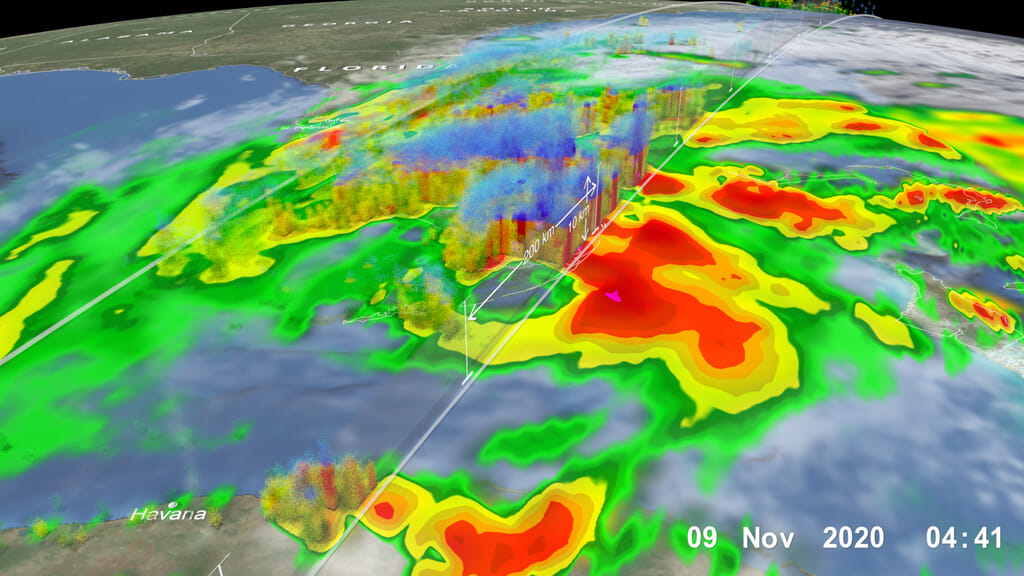
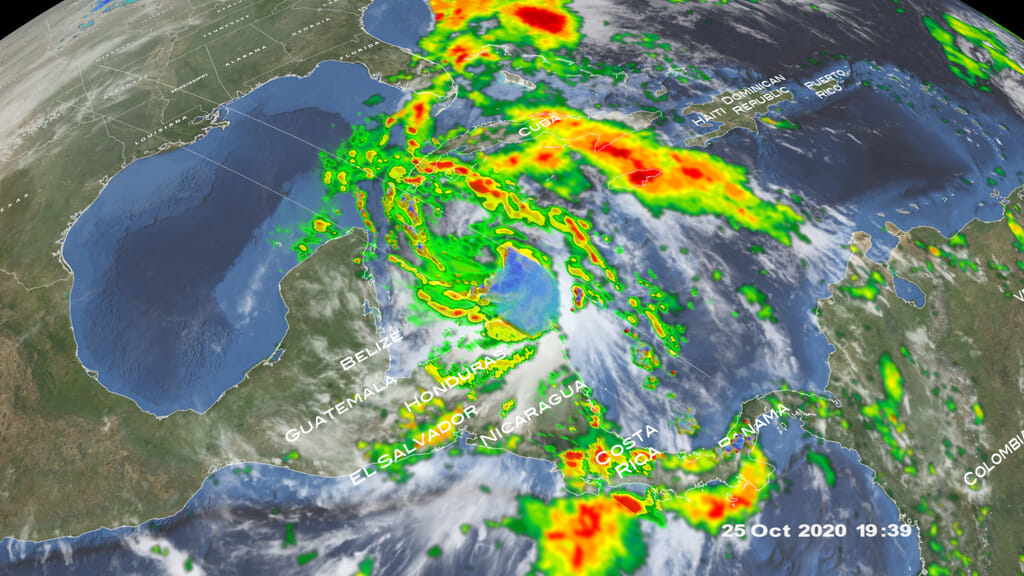
Hurricane Ian Forms South of Cuba
Go to this pageHurricane Ian off the Cuban Coast on September 26, 2022 at 20:29Z. || Ian0926_001.4300_print.jpg (1024x576) [277.8 KB] || Ian0926_001.4300_searchweb.png (320x180) [128.0 KB] || Ian0926_001.4300_thm.png (80x40) [8.8 KB] || Ian0926_001_1080p30_3.mp4 (1920x1080) [74.2 MB] || 1920x1080_16x9_30p (1920x1080) [0 Item(s)] || Ian0926_001_1080p30_3.webm (1920x1080) [5.9 MB] || Ian0926_001_1080p30_3.mp4.hwshow [187 bytes] ||
- ID: 5035 Visualization
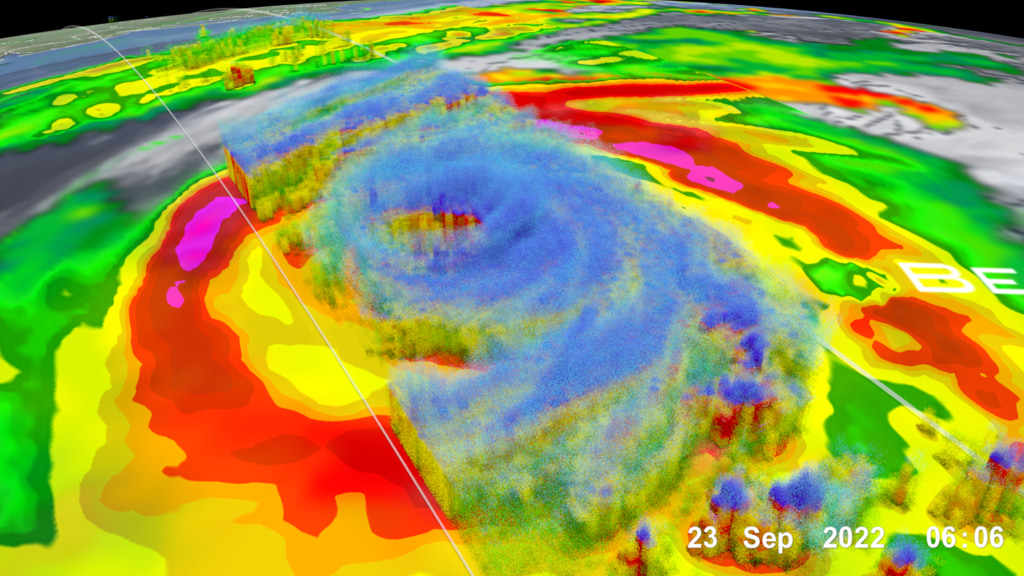
Fiona Becomes a Major Hurricane in the Atlantic
Go to this pageHurricane Fiona west of Bermuda on September 23, 2022 at 6:06 UTC. || Fiona0923L_001.4300_print.jpg (1024x576) [285.1 KB] || Fiona0923L_001.4300_searchweb.png (180x320) [114.1 KB] || Fiona0923L_001.4300_thm.png (80x40) [8.5 KB] || Fiona0923L_001_1080p30_2.mp4 (1920x1080) [84.7 MB] || 1920x1080_16x9_30p (1920x1080) [0 Item(s)] || Fiona0923L_001_1080p30_2.webm (1920x1080) [6.3 MB] || 3840x2160_16x9_60p (3840x2160) [0 Item(s)] || Fiona0923L_4K_2160p60.mp4 (3840x2160) [399.3 MB] || Fiona0923L_001_1080p30_2.mp4.hwshow [190 bytes] ||
- ID: 5026 Visualization
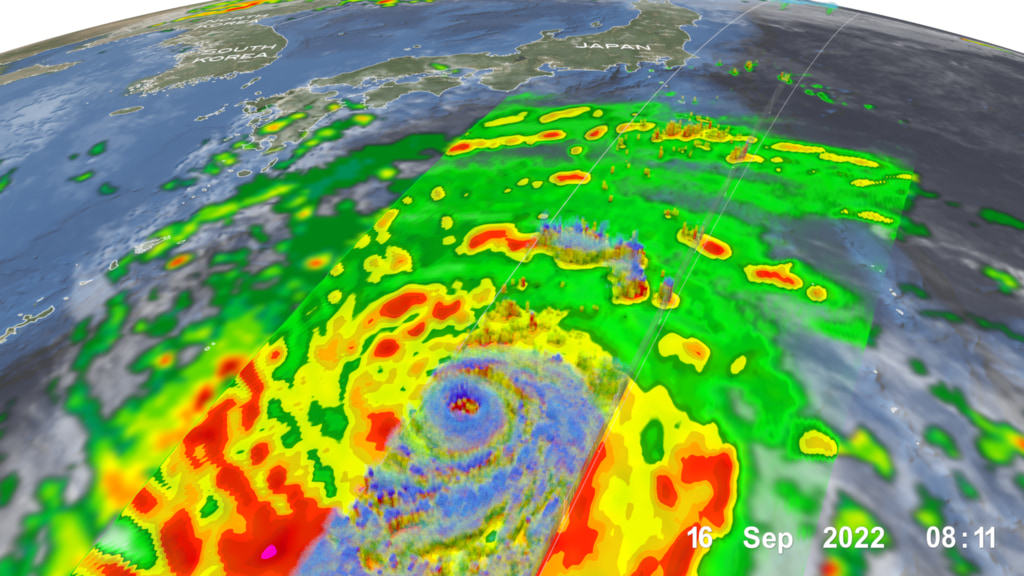
Super Typhoon Nanmadol intensifies on its way to Japan
Go to this pageTyphoon Nanmadol as it approaches Japan on September 16, 2022. || Nanmadol_001.4300_print.jpg (1024x576) [250.0 KB] || Nanmadol_001.4300_searchweb.png (180x320) [123.7 KB] || Nanmadol_001.4300_thm.png (80x40) [8.7 KB] || Nanmadol_001_1080p30_4.mp4 (1920x1080) [79.2 MB] || 1920x1080_16x9_30p (1920x1080) [0 Item(s)] || Nanmadol_001_1080p30_4.webm (1920x1080) [6.0 MB] || 3840x2160_16x9_60p (3840x2160) [0 Item(s)] || Nanmadol_001_1080p30_4.mp4.hwshow [188 bytes] ||
2021 Hurricanes & Typhoons
- ID: 4947 Visualization
2021 Hurricane Season through September
Go to this pageThis data visualization shows hurricane tracks over clouds over precipitation over sea surface temperatures from May 1 through September 30th, 2021. This presentation was created for the COP 26 Conference. || hurr2021_4k_comp.4991_print.jpg (1024x576) [337.4 KB] || hurr2021_4k_comp.4991_searchweb.png (320x180) [123.6 KB] || hurr2021_4k_comp.4991_thm.png (80x40) [17.6 KB] || hurr2021_comp_1080p30.webm (1920x1080) [29.0 MB] || hurr2021_comp_1080p30.mp4 (1920x1080) [489.6 MB] || composite (3840x2160) [0 Item(s)] || hurr2021_comp_2160p30.mp4 (3840x2160) [1.7 GB] || hurr2021_comp_1080p30.mp4.hwshow [187 bytes] ||
- ID: 4940 Visualization
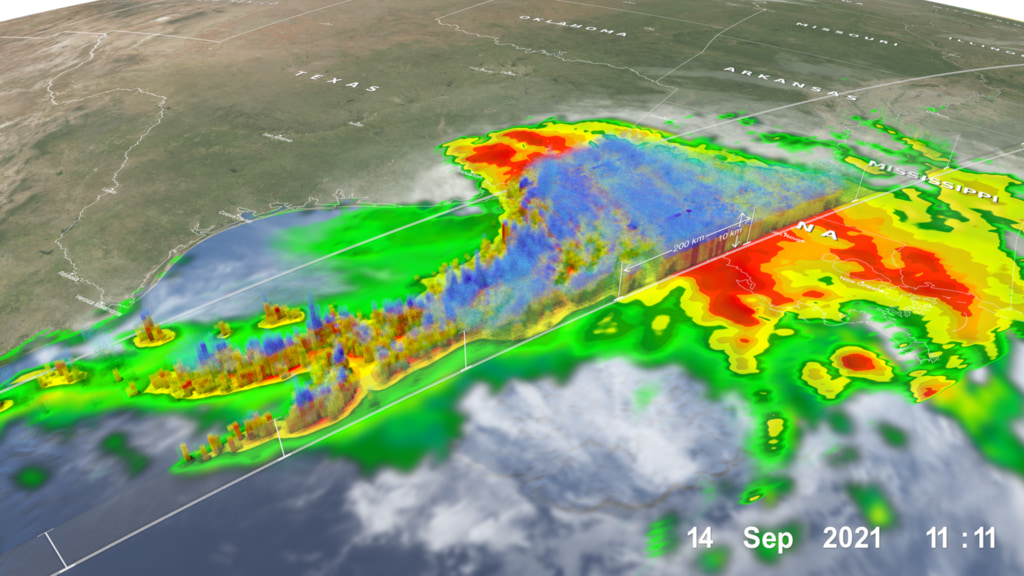
Hurricane Nicholas Brings More Heavy Rain to the Northern Gulf Coast
Go to this pageThis data visualization depicts Hurricane Nicholas on September 14, 2021 several hours after making landfall along the Northern Gulf coast. Although Nicholas was not a powerful or long-lived hurricane, it did bring several inches of rain to a region that had recently been hit by powerful Hurricane Ida two weeks prior. || nicholas1_001.2400_print.jpg (1024x576) [213.8 KB] || nicholas1_001.2400_searchweb.png (320x180) [115.5 KB] || nicholas1_001.2400_thm.png (80x40) [8.4 KB] || nicholas1_001_1080p30_4.mp4 (1920x1080) [61.4 MB] || 1920x1080_16x9_30p (1920x1080) [0 Item(s)] || nicholas1_001_1080p30_4.webm (1920x1080) [6.9 MB] || nicholas1_001_1080p30_4.mp4.hwshow [189 bytes] ||
- ID: 4933 Visualization
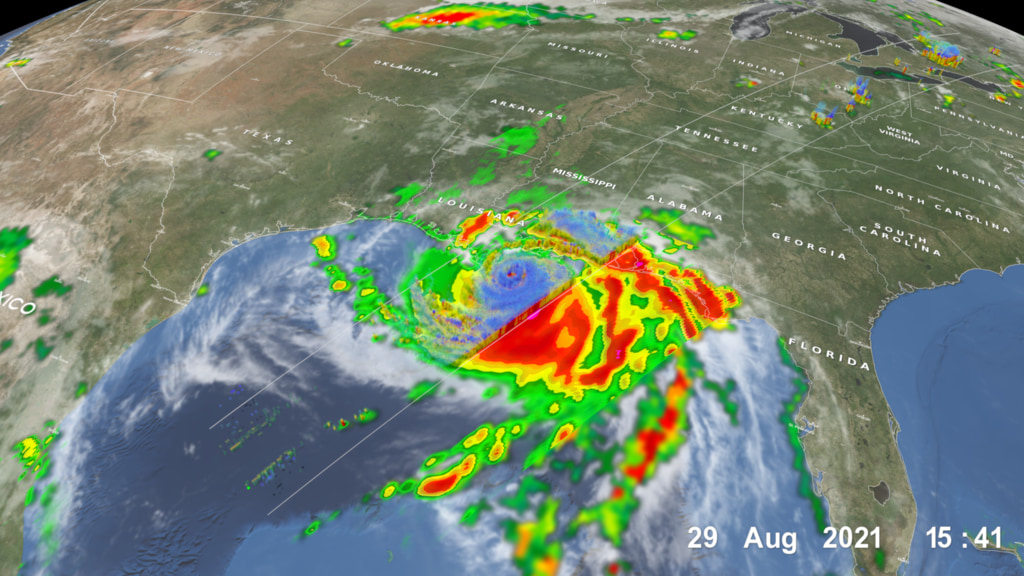
NASA/JAXA GPM Satellite Examines Hurricane Ida's Eye
Go to this pageHurricane Ida off the Louisiana coast as a Category 4 hurricane on the morning of Sunday, August 29th at 10:13am (CDT) right before making landfall. This animation varies from the previous (#4932) by flying down to the left side of the storm and only peeling back the layers of volumetric DPR data up to the eye. The camera then flies up to get a straight down bird's eye view of the structure. Doing so allows us to see the multiple bands that extend outside of the inner eye wall. || ida2001.4300_print.jpg (1024x576) [238.8 KB] || ida2001.4300_searchweb.png (180x320) [123.5 KB] || ida2001.4300_thm.png (80x40) [8.8 KB] || 1920x1080_16x9_30p (1920x1080) [0 Item(s)] || ida2001_1080p30.webm (1920x1080) [6.2 MB] || ida2001_1080p30.mp4 (1920x1080) [95.4 MB] || ida2001_1080p30.mp4.hwshow [182 bytes] ||
- ID: 4932 Visualization
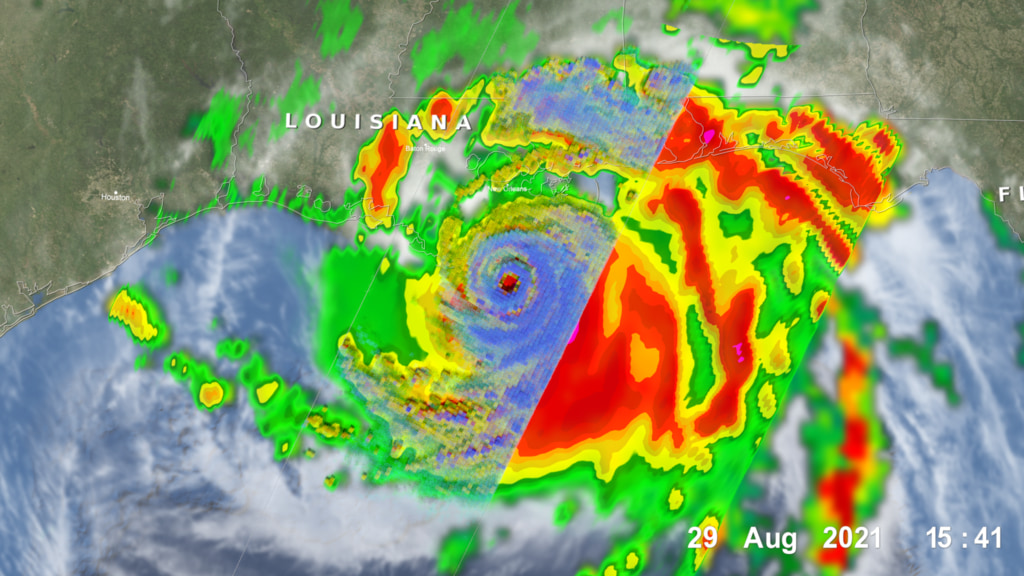
NASA/JAXA GPM Satellite Eyes Hurricane Ida Shortly Before Landfall
Go to this pageHurricane Ida off the Louisiana coast as a Category 4 hurricane on the morning of Sunday, August 29th at 10:13am (CDT) right before making landfall. || ida001.2300_print.jpg (1024x576) [221.2 KB] || ida001.2300_searchweb.png (320x180) [121.6 KB] || ida001.2300_thm.png (80x40) [8.2 KB] || ida001_1080p30_4.mp4 (1920x1080) [69.1 MB] || 1920x1080_16x9_30p (1920x1080) [0 Item(s)] || ida001_1080p30_4.webm (1920x1080) [6.6 MB] || ida001_1080p30_4.mp4.hwshow [182 bytes] ||
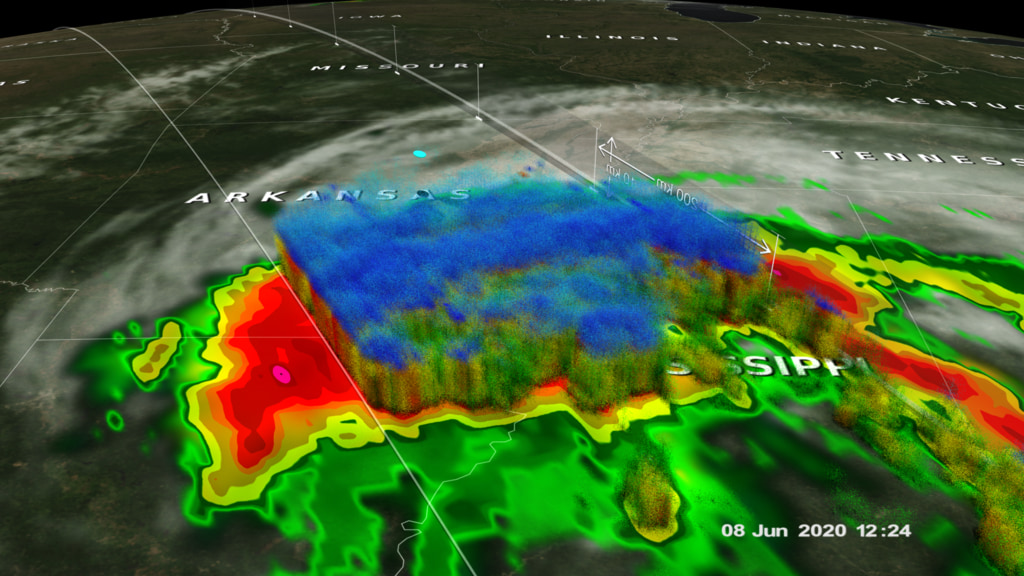
- ID: 4926 Visualization
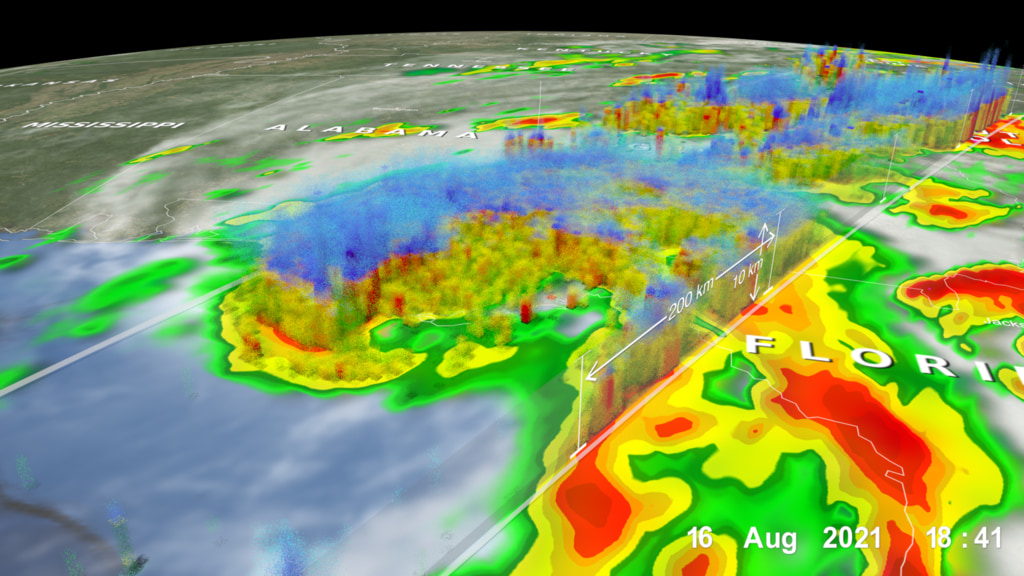
NASA/JAXA GPM Satellite Sees Tropical Storm Fred Make Florida Landfall
Go to this pageThis data visualization shows Tropical Storm Fred as it makes landfall on August 16 along the Florida panhandle and then follows it inland on August 17 as it soaked the Alabama Georgia border. || TS_Fred_Comp.2955_print.jpg (1024x576) [270.2 KB] || Composite (1920x1080) [0 Item(s)] || TS_Fred_Comp_1080p30.webm (1920x1080) [11.8 MB] || TS_Fred_Comp_1080p30.mp4 (1920x1080) [102.0 MB] ||
- ID: 4919 Visualization
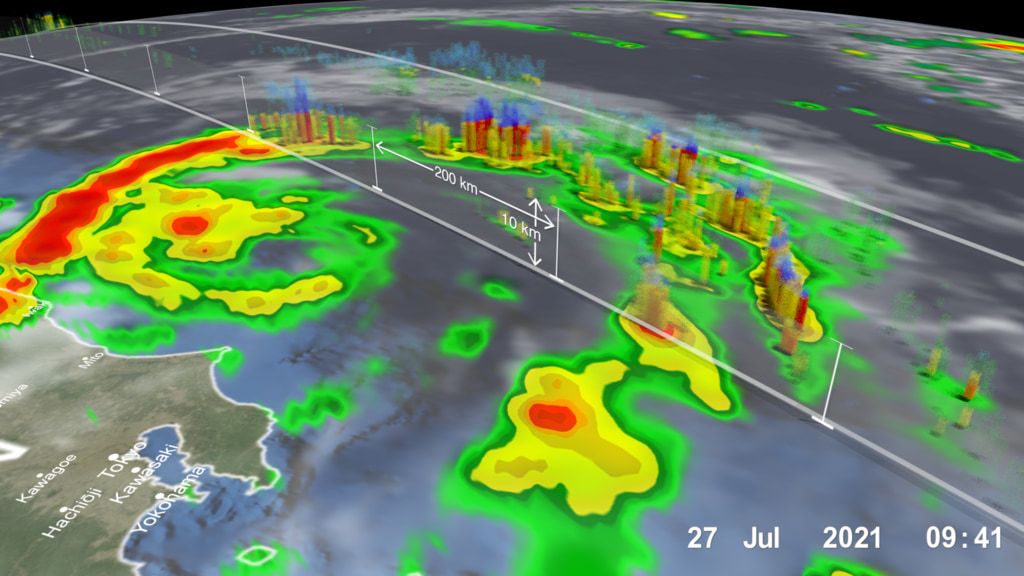
NASA/JAXA GPM Satellite Watches Tropical Storm Nepartak During the Olympics
Go to this pageTropical Storm Nepartak was seen off the coast of Japan on July 27, 2021 while the Olympics were being held in nearby Tokyo. || nepartak001.4300_print.jpg (1024x576) [187.9 KB] || nepartak001.4300_searchweb.png (320x180) [109.0 KB] || nepartak001.4300_thm.png (80x40) [8.4 KB] || nepartak001_1080p30_2.mp4 (1920x1080) [57.7 MB] || 1920x1080_16x9_30p (1920x1080) [0 Item(s)] || nepartak001_1080p30_2.webm (1920x1080) [10.9 MB] || nepartak001_1080p30_2.mp4.hwshow [187 bytes] ||
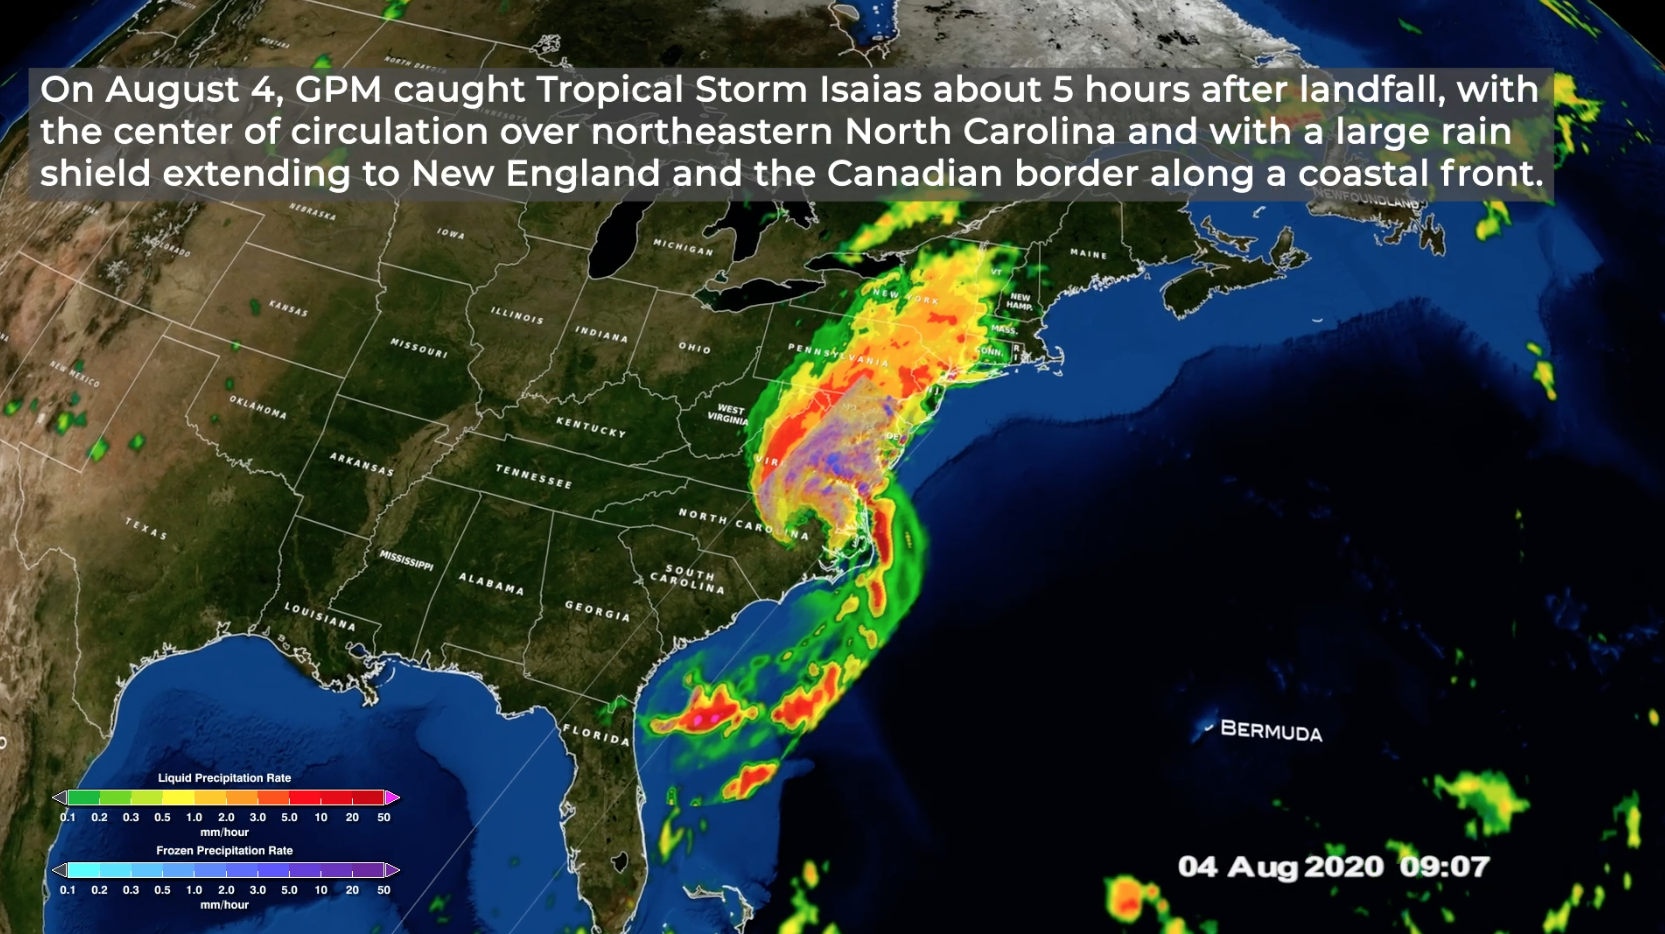
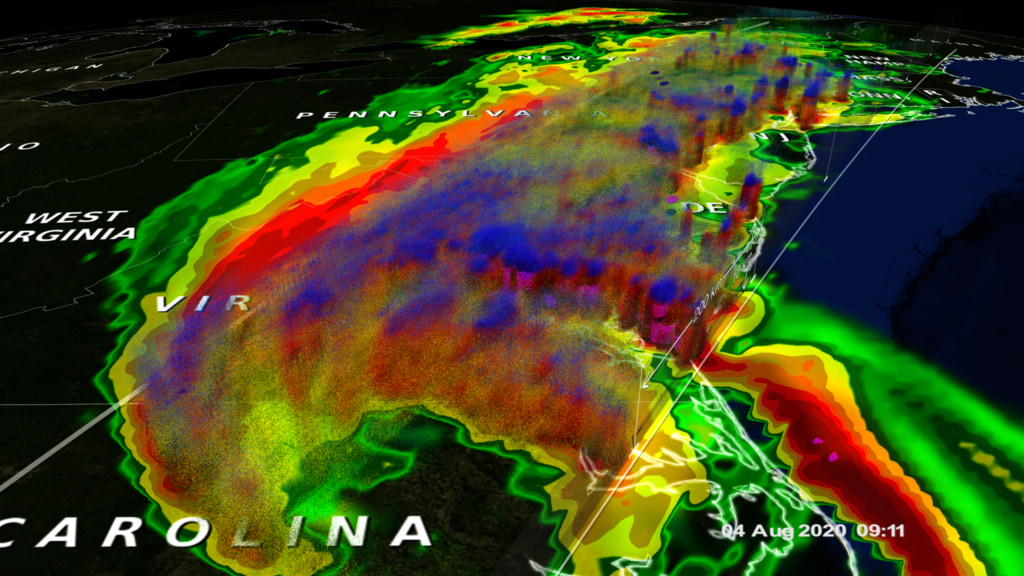
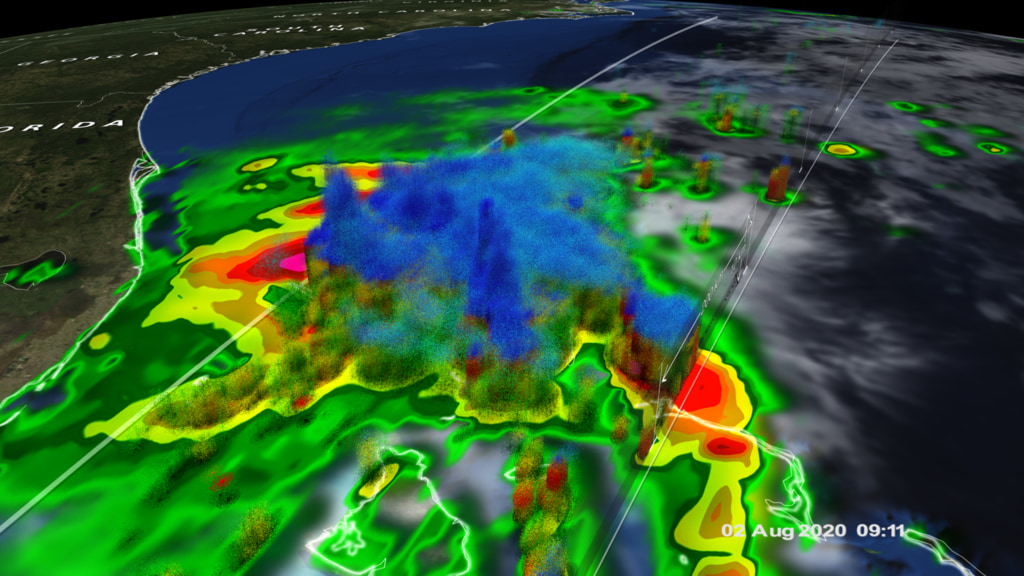
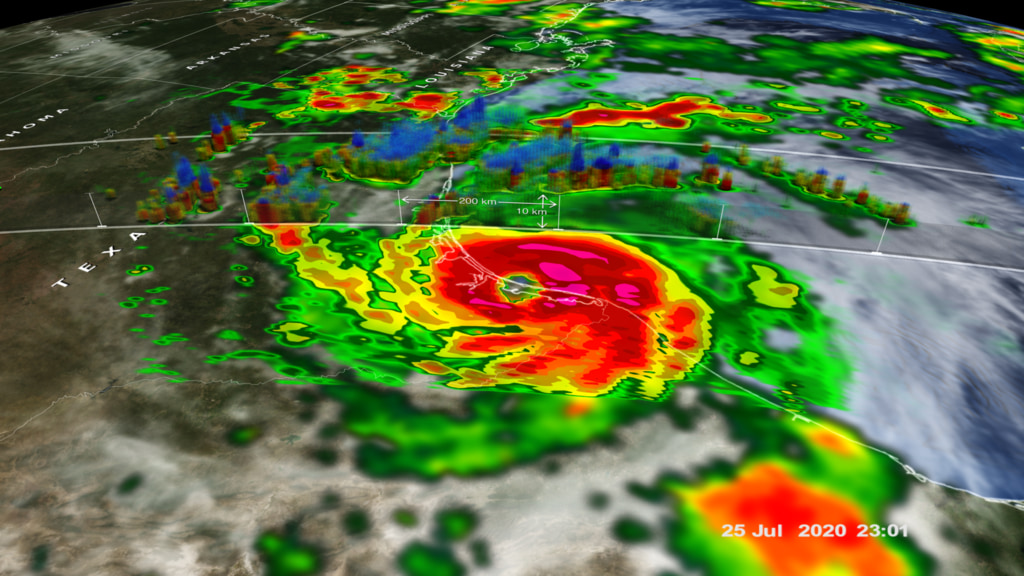
2020 Hurricanes & Typhoons
- ID: 4884Visualization
- ID: 4845
- ID: 4808
 Visualization
 - ID: 4876
 Visualization
 - ID: 4870
- ID: 4869
- ID: 4866
- ID: 4855
- ID: 13681
 Produced Video
 - ID: 4847
 Visualization
 - ID: 4846
- ID: 4844
 Visualization
 - ID: 4843
 Visualization
 - ID: 4842
- ID: 4812
 Visualization
2019 Hurricanes & Typhoons
- ID: 4753 Visualization
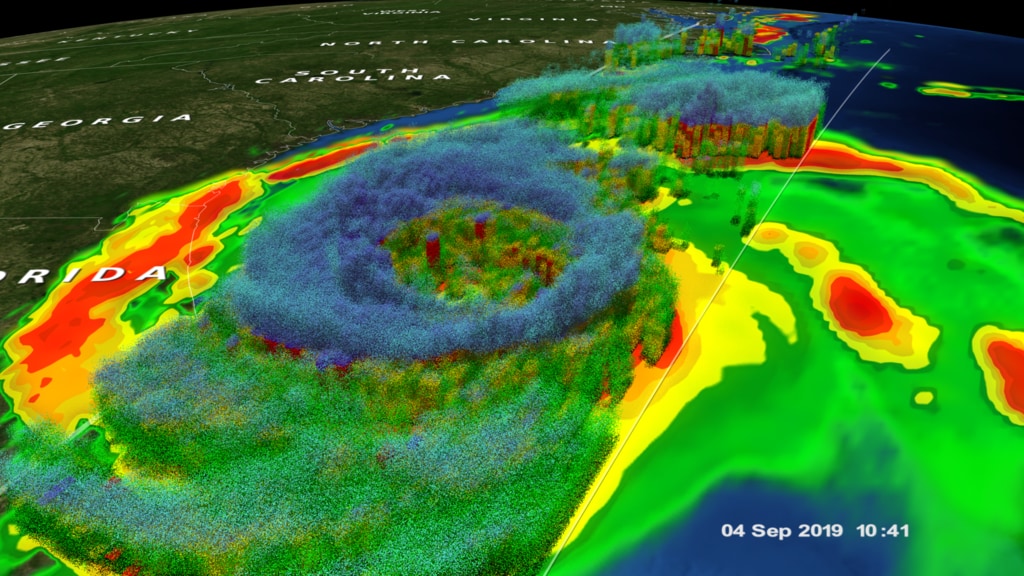
GPM observes Hurricane Dorian lashing Florida
Go to this pageSnapshot view of 3D precipitation from DPR and surface rain rates (mm/hr) from GMI at 10:41 UTC (6:41 am EDT) 4 September 2019 when the center of Dorian was near the coast of central Florida about 90 miles due east of Daytona Beach.This video is also available on our YouTube channel. || dorian2__cam_dorianShape2_beauty.4300_print.jpg (1024x576) [187.7 KB] || dorian2__cam_dorianShape2_beauty.4300_searchweb.png (320x180) [116.1 KB] || dorian2__cam_dorianShape2_beauty.4300_thm.png (80x40) [8.3 KB] || 1920x1080_16x9_30p (1920x1080) [0 Item(s)] || dorian2__cam_dorianShape2_beauty.webm (1920x1080) [6.8 MB] || dorian2__cam_dorianShape2_beauty.mp4 (1920x1080) [123.3 MB] || captions_silent.27948.en_US.srt [43 bytes] || dorian2__cam_dorianShape2_beauty.mp4.hwshow [276 bytes] ||
- ID: 4751 Visualization
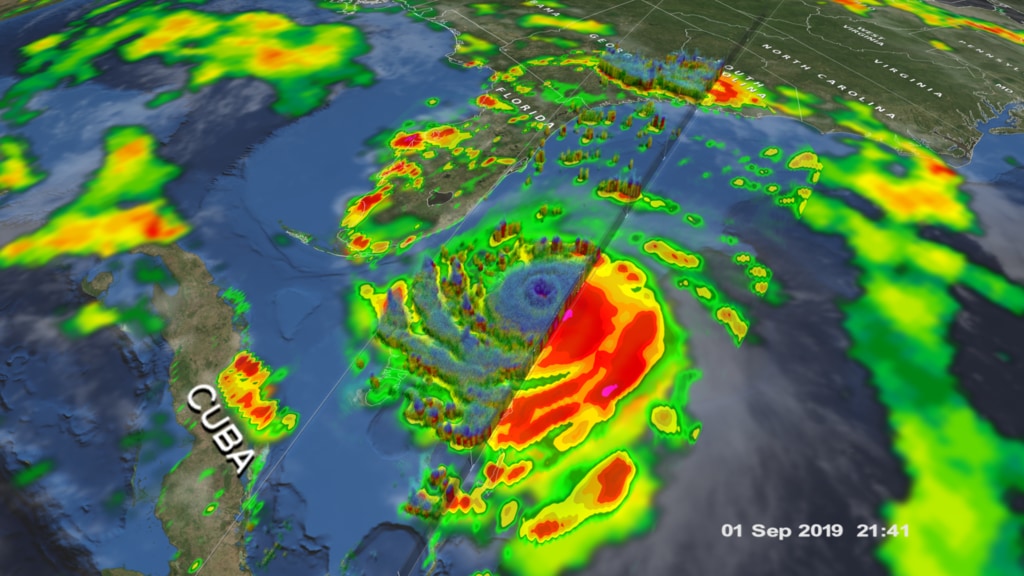
GPM observes Hurricane Dorian over the Bahamas
Go to this pageHurricane Dorian on September 1, 2019 (21:22 UTC) over Abaco Island in The BahamasThis video is also available on our YouTube channel. || dorian_08.2400_print.jpg (1024x576) [144.6 KB] || dorian_08.2400_searchweb.png (320x180) [121.2 KB] || dorian_08.2400_thm.png (80x40) [8.7 KB] || dorian (1920x1080) [0 Item(s)] || dorian_1080p30.mp4 (1920x1080) [72.2 MB] || dorian_1080p30.webm (1920x1080) [5.2 MB] || captions_silent.27911.en_US.srt [43 bytes] || dorian_1080p30.mp4.hwshow [180 bytes] ||
2018 Hurricanes & Typhoons
- ID: 13101 Produced Video

NASA Catches Super Typhoon Yutu Making Landfall
Go to this pageMusic: "CSI," Anthony Edward Phillips, Atmosphere Music, Ltd.Complete transcript available. || Yutu_thumb_print.jpg (1024x575) [147.6 KB] || Yutu_thumb_searchweb.png (320x180) [104.2 KB] || Yutu_thumb_thm.png (80x40) [8.1 KB] || 13101_Supertyphoon_Yutu_prores.mov (1920x1080) [1.3 GB] || 13101_Supertyphoon_Yutu_prores.webm (1920x1080) [10.2 MB] || FACEBOOK_720_13101_Supertyphoon_Yutu_facebook_720.mp4 (1280x720) [108.4 MB] || TWITTER_720_13101_Supertyphoon_Yutu_twitter_720.mp4 (1280x720) [19.4 MB] || YOUTUBE_1080_13101_Supertyphoon_Yutu_youtube_1080.mp4 (1920x1080) [144.9 MB] || YOUTUBE_720_13101_Supertyphoon_Yutu_youtube_720.mp4 (1280x720) [145.4 MB] || 13101_Supertyphoon_Yutu_youtube_hq.mov (1920x1080) [401.2 MB] || 13101_Supertyphoon_Yutu.en_US.srt [1.3 KB] || 13101_Supertyphoon_Yutu.en_US.vtt [1.3 KB] ||
- ID: 4694 Visualization
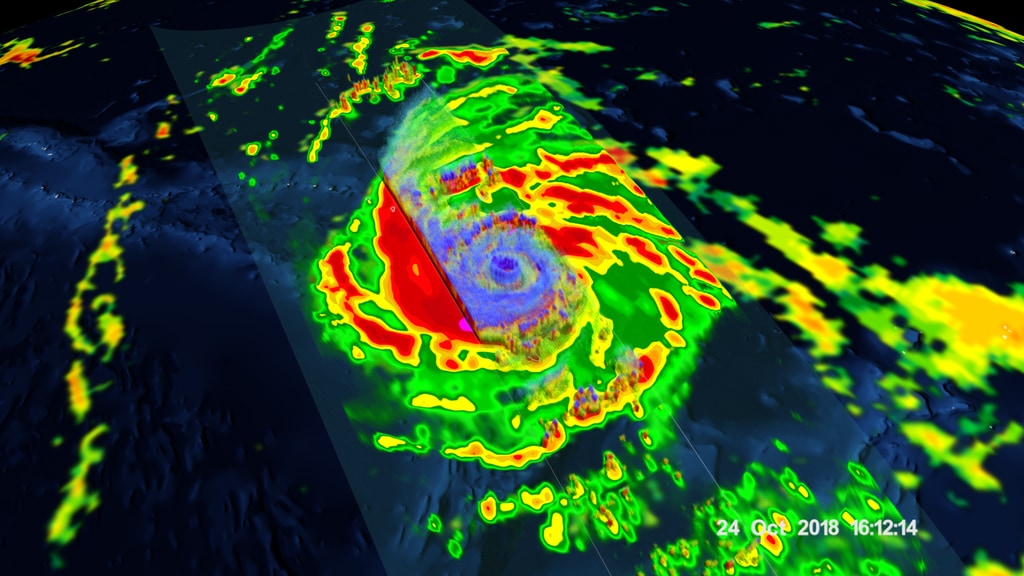
GPM Satellite observes powerful super Typhoon Yutu hitting Northern Marianas
Go to this pageGPM passed over Super Typhoon Yutu on October 24th at 11:07 a.m. EDT . As the camera moves in on the storm, DPR's volumetric view of the storm is revealed. A slicing plane moves across the volume to display precipitation rates throughout the storm. Shades of green to red represent liquid precipitation. Frozen precipitation is shown in cyan and purple.This video is also available on our YouTube channel. || Yutu.2320_print.jpg (1024x576) [145.9 KB] || Yutu.2320_searchweb.png (320x180) [100.2 KB] || Yutu.2320_thm.png (80x40) [7.8 KB] || yutu (1920x1080) [0 Item(s)] || Yutu_1080p30.webm (1920x1080) [7.7 MB] || Yutu_1080p30.mp4 (1920x1080) [102.3 MB] || captions_silent.27091.en_US.srt [43 bytes] || captions_silent.27091.en_US.vtt [56 bytes] || Yutu_1080p30.mp4.hwshow ||
- ID: 4692 Visualization
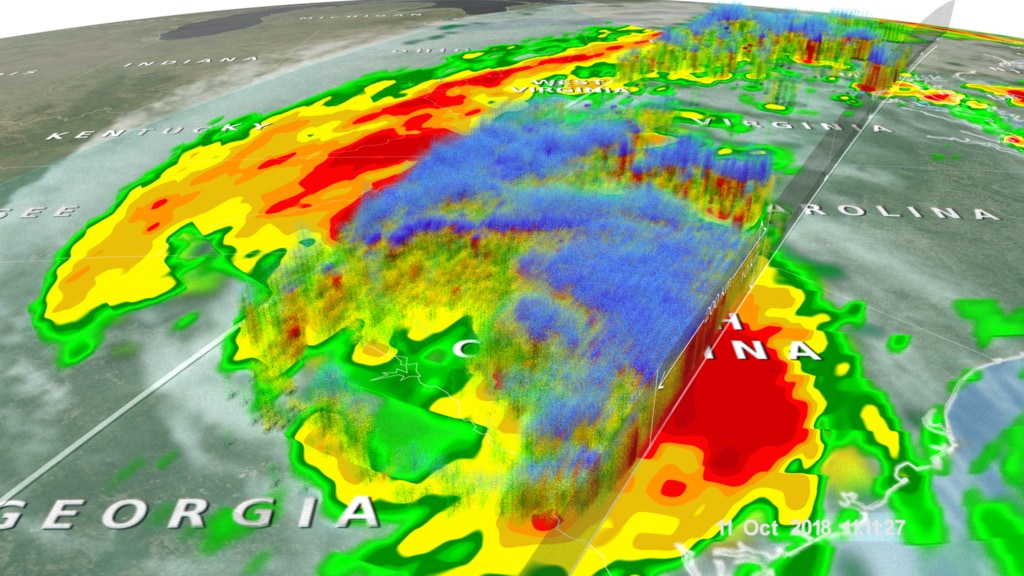
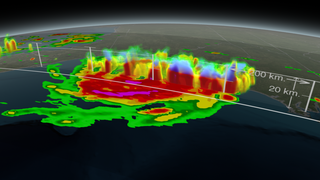
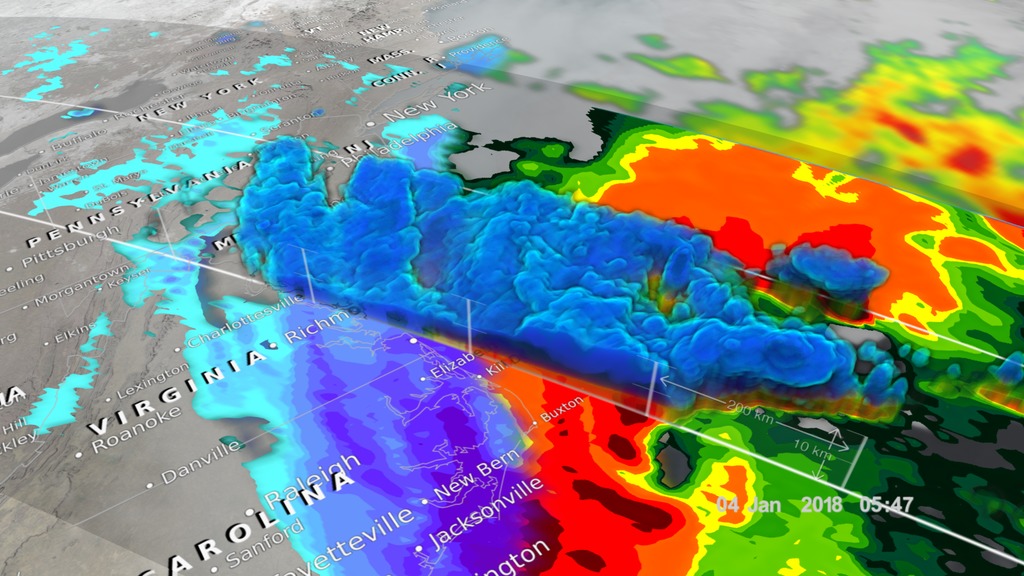
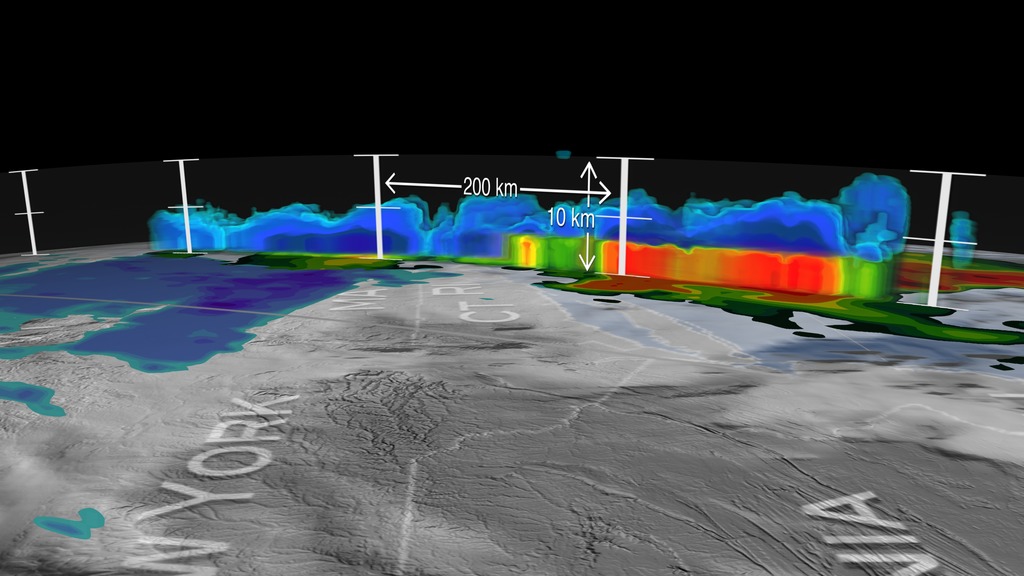
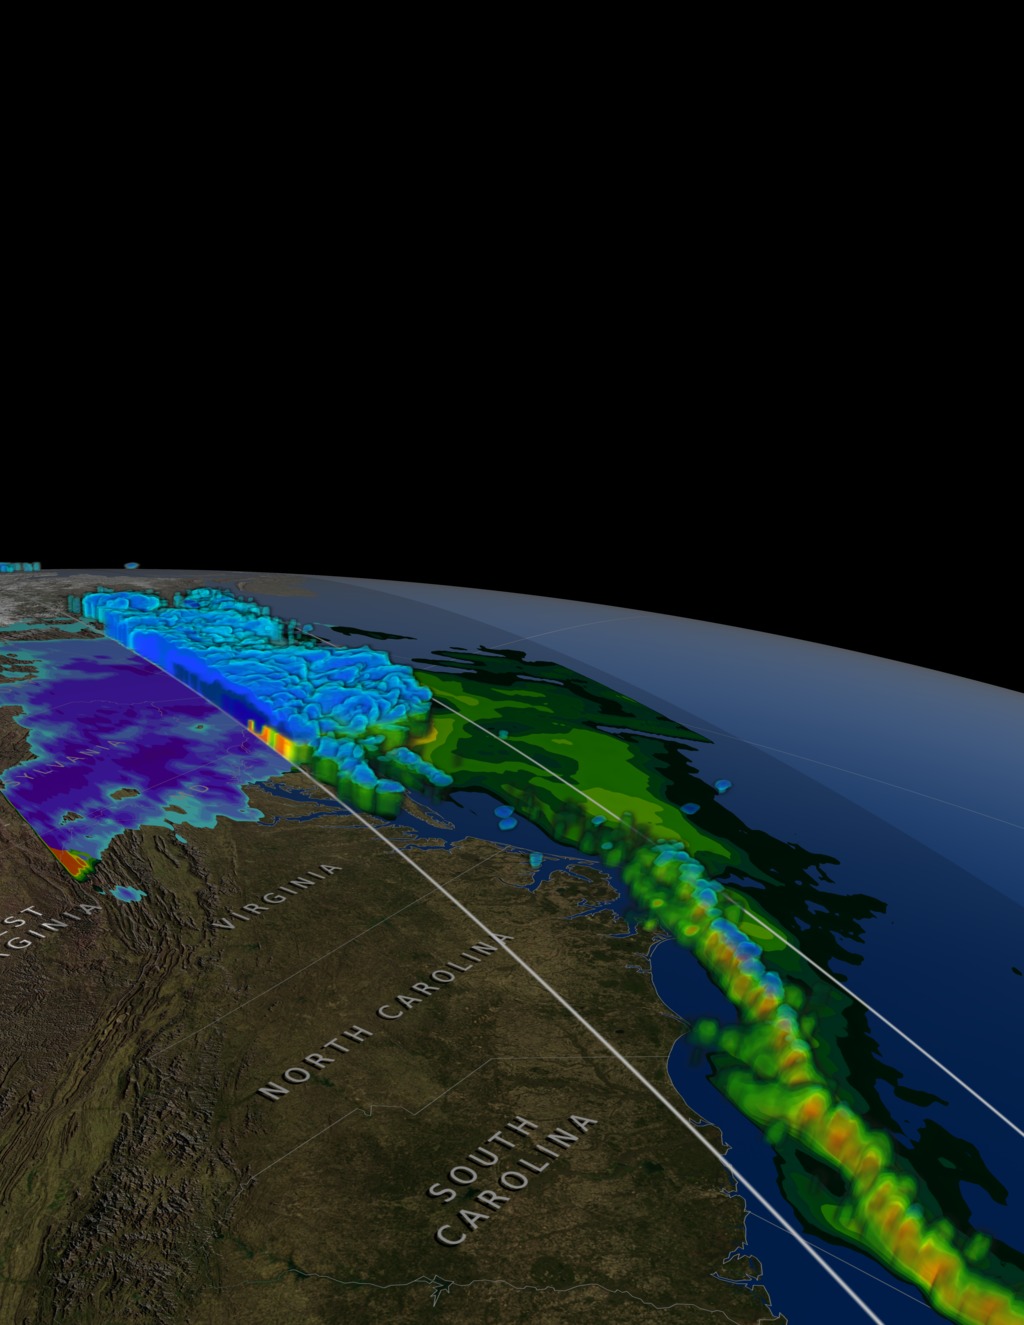
Tropical Storm Michael Drenches the Carolinas
Go to this pageThis data visualization shows Tropical Storm Michael over the Carolinas on October 11, 2018. Shades of green, yellow, and red are ground precipitation rates. Blue and purple indicate frozen precipitation. || michael3.4300_print.jpg (1024x576) [173.7 KB] || michael3.4300_searchweb.png (320x180) [123.0 KB] || michael3.4300_thm.png (80x40) [9.1 KB] || 1920x1080_16x9_30p (1920x1080) [0 Item(s)] || michael3.webm (1920x1080) [11.6 MB] || michael3.mp4 (1920x1080) [142.5 MB] || michael3.mp4.hwshow [174 bytes] ||
- ID: 4682 Visualization
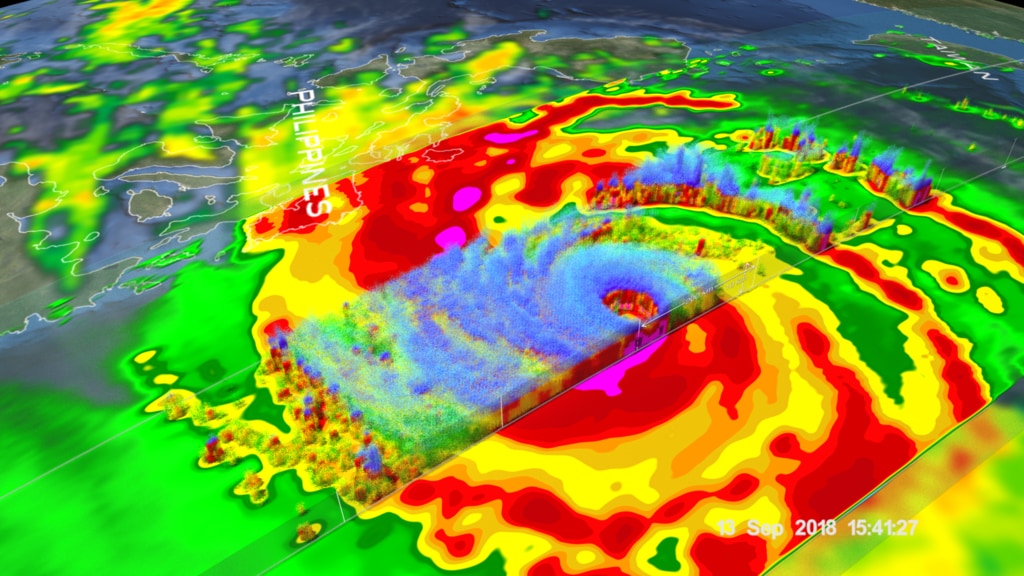
GPM Captures Super Typhoon Mangkhut Approaching The Philippines
Go to this pageAt nearly the same time that the US East Coast was experiencing the arrival of Hurricane Florence, a much more powerful storm was also arriving half a world away in the Philippines—Super Typhoon Mangkhut. While the slow-moving Florence arrived as a Category 1 hurricane that brought record flooding to the Carolinas, less than 7 hours later Mangkhut (known as Ompong in the Philippines) made landfall on the northern main island of Luzon as a full on Category 5 super typhoon with sustained winds reported at 165 mph. The visualization starts with a view of Integrated Multi-satellitE Retrievals for GPM (IMERG) precipitation rates from 15:11 UTC (11:11 pm PST) 12 September to 15:41 UTC (11:41 pm PST) 13 September 2018 as the storm was making its way across the Philippine Sea headed for Luzon. Before entering the Philippine Sea, Mangkhut passed just north of Guam on the evening of the 10th as a Category 2 typhoon with sustained winds reported at 105 mph by the Joint Typhoon Warning Center (JTWC) causing widespread power outages. The next day on the 11th as it entered the eastern Philippine Sea, Mangkhut underwent a rapid intensification cycle wherein the storm’s intensity shot from Category 2 on the afternoon of the 10th (local time) to Category 5 with sustained winds estimated at 160 mph by JTWC by the evening of the 11th (local time). Mangkhut is estimated to have reached its peak intensity at 18:00 UTC on the 12th (2:00 am PST 13 September) with maximum sustained winds estimated at 180 mph by JTWC, making it the strongest tropical cyclone of the year thus far.At the start of the visualization, Mangkhut was an extremely powerful Category 5 super typhoon and just approaching its peak intensity. Over the next 24 hours, Mangkhut’s intensity leveled out such that when the GPM core satellite over flew the storm, Mangkhut’s peak intensity was estimated at 165 mph, a still very powerful Category 5 storm. The end of the visualization shows the surface rainfall within Mangkhut as well as a 3D flyby of the storm courtesy of the GPM core satellite, which passed over the storm at around 15:40 UTC (11:40 pm PST) on the 13th. At the surface, a distinct eye is present surrounded by a large area of very heavy to intense rain (shown in dark red and magenta). Further out, heavy rain bands are rotating counter clockwise around the storm’s center. The flyby shows a 3D rendering of the radar structure of Mangkhut using data collected from GPM’s Dual-frequency Precipitation Radar or DPR. At the heart of the storm surrounding the eye is a ring of elevated echo tops associated with Mangkhut’s eyewall. The strong symmetry and continuity of the ring is consistent with an intense tropical cyclone and suggests no inhibiting effects such as dry air or wind shear are affecting the storm. In fact, after these images were taken, Mangkhut would continue on to strike the northern part of Luzon at the same estimated intensity, becoming the strongest typhoon to hit the Philippines since Super Typhoon Haiyan in 2013. So far the storm is being blamed for at least 95 fatalities in the Philippines, many due to a large landslide around the town of Itogon. After crossing Luzon, Mangkhut continued on to strike Hong Kong with winds reported at 121 mph before dissipating over mainland China, where it is being blamed for 6 fatalities. GPM data is part of the toolbox of satellite data used by forecasters and scientists to understand how storms behave. GPM is a joint mission between NASA and the Japan Aerospace Exploration Agency. Current and future data sets are available with free registration to users from NASA Goddard's Precipitation Processing Center website. ||
- ID: 4681 Visualization
GOES and GPM Capture Florence Trying to Intensify Over the Atlantic
Go to this pageHurricane Florence originally formed from an African Easterly wave that emerged off the west coast of Africa back on the 30th of August. When it reached the vicinity of the Cape Verde Islands the next day, it was organized enough to become a tropical depression. The following day the depression strengthened enough to become a tropical storm and Florence was born on the 1st of September. Over the next 3 days, Florence gradually strengthened as it moved in a general west-northwest direction into the central Atlantic. Then, on the 4th of September, Florence began to rapidly intensify. By the morning of the 5th, Florence was a Category 3 hurricane before reaching Category 4 intensity later that afternoon with maximum sustained winds estimated at 130 mph by the National Hurricane Center (NHC). At this point, Florence became the victim of increasingly strong southwesterly wind shear, which greatly weakened the storm all the way back down to a tropical storm the by evening of the 6th.The following GOES-East Infrared (IR) loop shows Florence from 17:54 UTC (1:54 pm EDT) 6 September to 19:27 UTC (3:27 pm EDT) 7 September when it was struggling against the strong southwesterly wind shear in the Central Atlantic. A very interesting looking feature is the arc-shaped cloud that propagates outward from the storm towards the west. This cloud feature is occurring at upper-levels and is likely tied to a gravity wave propagating outward from an area of intense convection that erupted from deep within the storm. When the tops of these smaller scale storms within a storm reach the upper troposphere, they can trigger gravity waves. As these waves progagate outward they can enhance cloud formation where they induce rising motion and erode cloud where they induce downward motion or subsidence. As this arc-shaped cloud is able to propagate outward uniformly from the center, it must be occurring above the shear layer. Compensating areas of subsidence can also surround the strong rising motion occurring within the tall convective clouds. This can help to erode surrounding clouds and may be contributing to the clearing that occurs between the arc-shaped cloud and the mainarea of convection.The end of the loop shows surface rainfall and a 3D flyby of Florence courtesy of the GPM core satellite, which passed over the storm at around 19:21 UTC (3:21 pm EDT) on the 7th. At the surface, two areas of intense rain (shown in magenta) reveal the presence of two areas of strong thunderstorms within Florence north and northeast of the center. The flyby shows a 3D rendering of the radar structure of the storm. The darker blue tower indicates an area of deep convection that has penetrated well over 10 km high and is associated with the southernmost area of intense rain just north of the center. It is these areas of deep convection that fuel the storm by releasing heat, known as latent heat, mainly from condensation, near the core. Although it would be nearly 2 days before Florence re-gained hurricane intensity, these convective towers are what helped Florence to survive the effects of the wind shear and eventually grow back into a Category 4 hurricane.GPM is a joint mission between NASA and the Japanese space agency JAXA.Caption by Stephen Lang (SSAI/NASA GSFC) and Joe Munchak (GSFC). ||
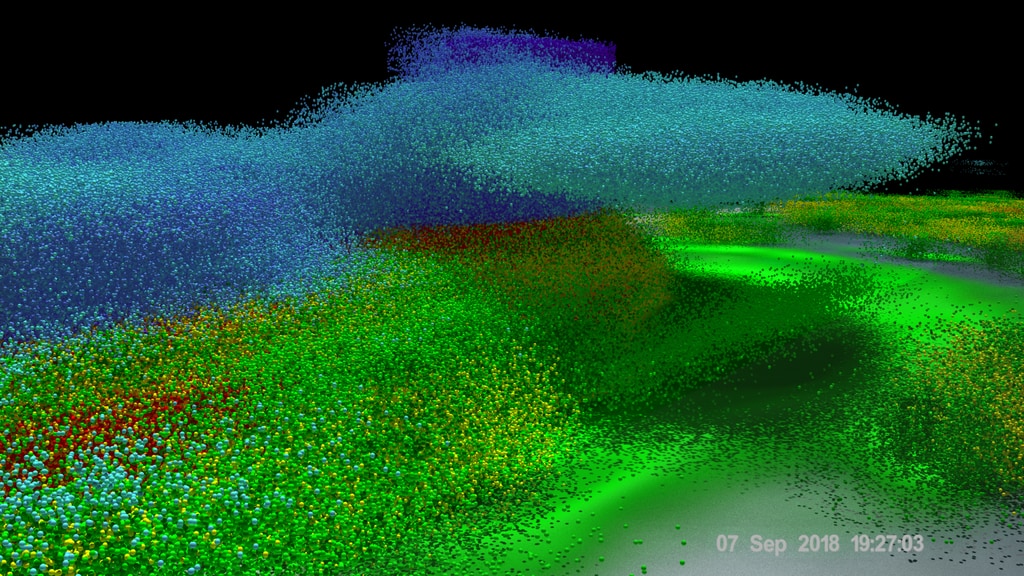
- ID: 4674 Visualization
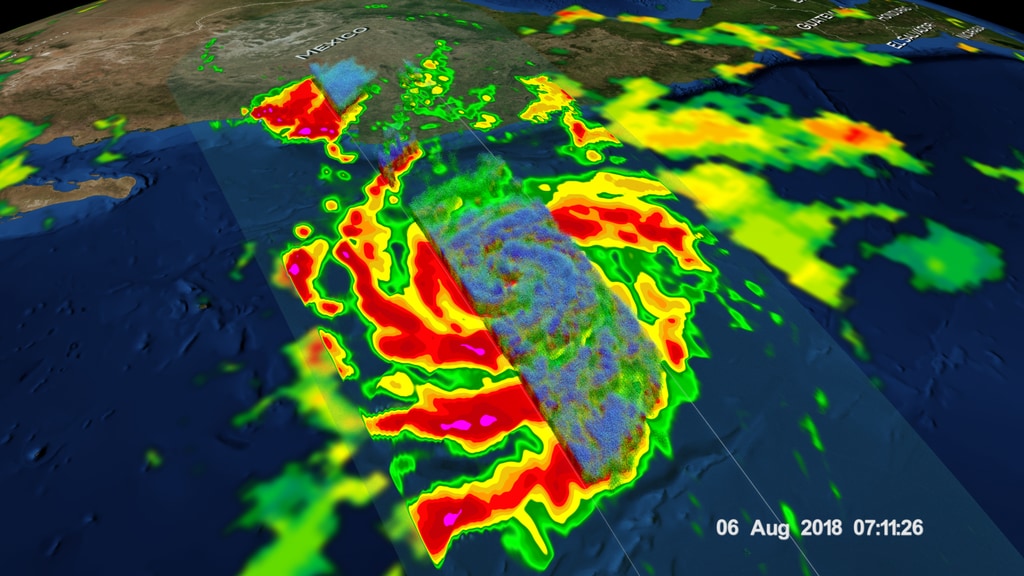
GPM passes directly over Tropical Storm John off the coast of Mexico
Go to this pageGPM passed over Tropical Storm John on August 6, 2018. As the camera moves in on the storm, DPR's volumetric view of the storm is revealed. A slicing plane moves across the volume to display precipitation rates throughout the storm. Shades of green to red represent liquid precipitation extending down to the ground. Frozen precipitation is displayed in cyan and purple. This video is also available on our YouTube channel. || john01.2330_print.jpg (1024x576) [146.4 KB] || john01.2330_searchweb.png (320x180) [100.1 KB] || john01.2330_thm.png (80x40) [7.8 KB] || 1920x1080_16x9_30p (1920x1080) [0 Item(s)] || john01_1080p30.webm (1920x1080) [6.0 MB] || john01_1080p30.mp4 (1920x1080) [114.4 MB] || captions_silent.26529.en_US.srt [43 bytes] || captions_silent.26529.en_US.vtt [56 bytes] || john01_1080p30.mp4.hwshow [180 bytes] ||
2017 Hurricanes & Typhoons
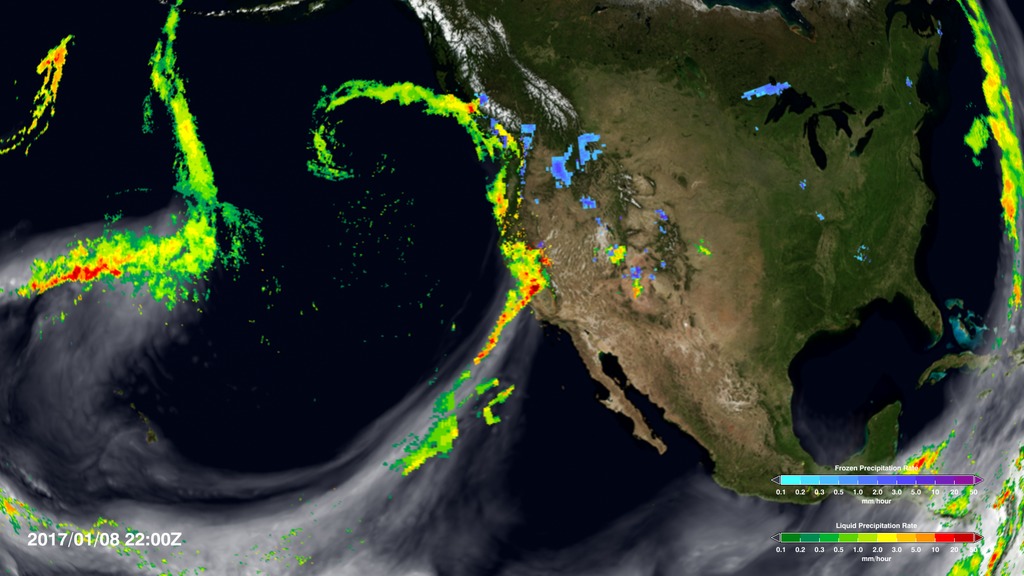
- ID: 4586 Visualization
Hurricane Tracks from 2017 with Precipitation and Cloud Data
Go to this page2017 Atlantic Hurricane season storm tracks with IMERG precipitation and GOES clouds (01 Aug 2017 to 31 Oct 2017) || hurricane_tracks2017_09cpc.2500_print.jpg (1024x576) [187.1 KB] || hurricane_tracks2017_09cpc.2500_searchweb.png (180x320) [111.1 KB] || hurricane_tracks2017_09cpc.2500_thm.png (80x40) [8.1 KB] || atlantic (1920x1080) [0 Item(s)] || hurricane_tracks2017_1920x1080.webm (1920x1080) [28.1 MB] || hurricane_tracks2017_1920x1080.mp4 (1920x1080) [504.9 MB] || 3840x2160_16x9_30p (3840x2160) [0 Item(s)] || hurricane_tracks2017_640x360p30.mp4 (640x360) [78.6 MB] || hurricane_tracks2017_4k.mp4 (3840x2160) [1.5 GB] ||
- ID: 4685 Visualization
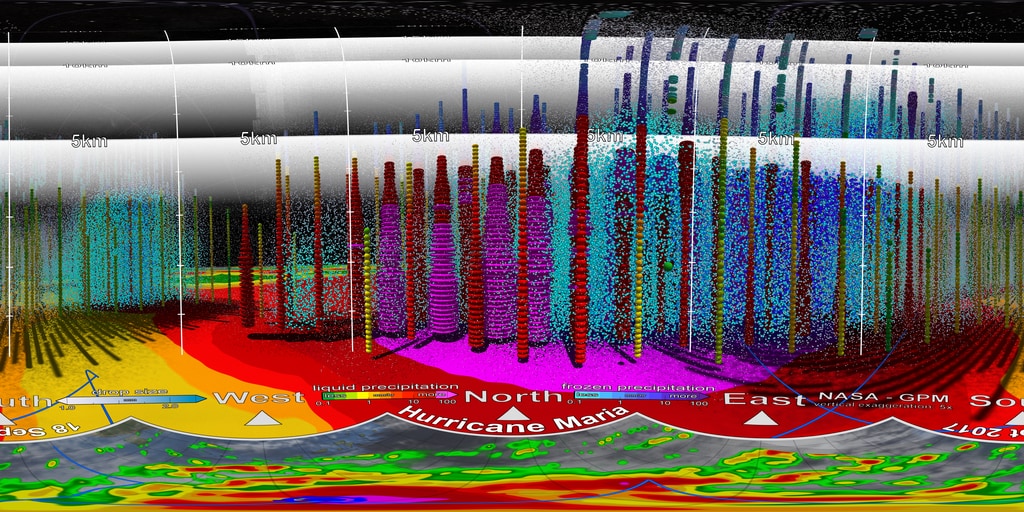
Inside Hurricane Maria in 360°
Go to this pageTour Hurricane Maria in a whole new way! Late on September 17, 2017 (10:08 p.m. EDT) Category 1 Hurricane Maria was strengthening in the Atlantic Ocean when the Global Precipitation Measurement (GPM) mission's Core Observatory flew over it. The Dual Frequency Precipitation Radar, measuring in a narrow band over the storm center, shows 3-D estimates of rain, with snow at higher altitudes. The tall "hot towers" characteristic of deepening hurricanes are actually topped by snow! Surface rainfall rates estimated by the GPM Microwave Imager paint the surface over a wider swath. During the tour, you'll see the radar-observed rain intensities displayed three different ways in various parts of the storm. Then, for the first time you'll see estimates of the precipitation particle sizes, which the GPM DPR is uniquely capable of showing, and which provide important insights into storm processes.GPM is a joint mission between NASA and the Japanese space agency JAXA. ||
- ID: 4591 Visualization
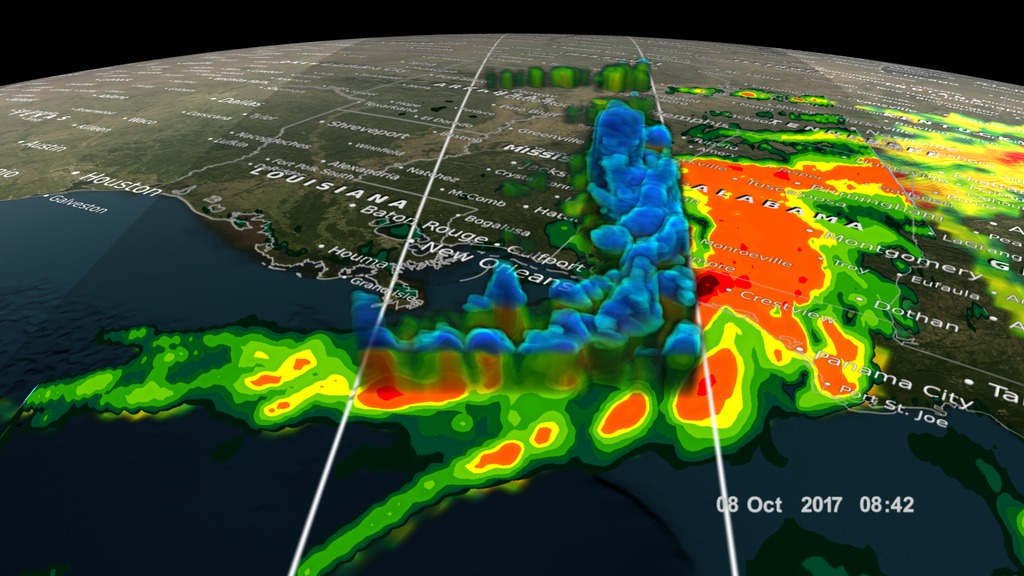
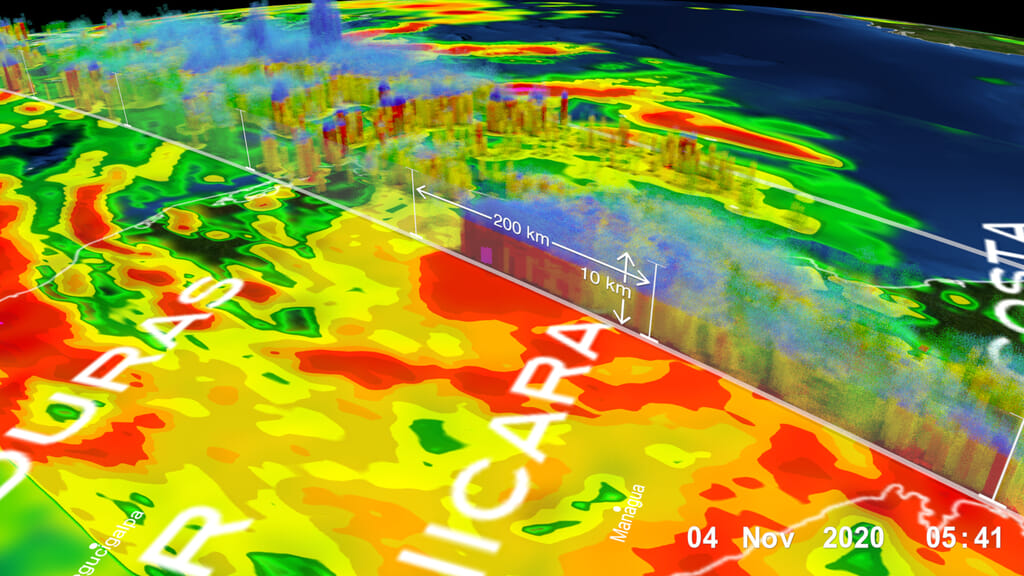
GPM Catches Hurricane Nate's Landfall...Twice
Go to this pageNASA's GPM satellite helped track Nate's progress through the Gulf of Mexico and also captured Nate's landfall on the north central Gulf Coast. This animation shows instantaneous rainrate estimates from NASA's Integrated Multi-satellitE Retrievals for GPM or IMERG product over North America and the surrounding waters beginning on Thursday October 5th when Nate first became a tropical storm near the northeast coast of Nicaragua in the western Caribbean until its eventual landfall on the northern Gulf Coast on Sunday October 8th. IMERG estimates precipitation from a combination of space-borne passive microwave sensors, including the GMI microwave sensor onboard the GPM core satellite, and geostationary IR (infrared) data. The animation shows Nate moving rapidly northward through the Gulf of Mexico on the 7th. Nate's rapid movement from 20 to as much as 26 mph did not allow the storm much time to strengthen despite being over very warm waters and in a relatively low wind shear environment. Nate reached a peak intensity of 90 mph sustained winds, which it maintained while passing over the Gulf of Mexico, but it did not intensify any further before making landfall. The animation also shows two 3D flyby's of Nate captured by the GPM core satellite as it overflew the storm just before landfall at 22:58 UTC (5:58 CDT) on Saturday October 7th and again at 08:42 UTC (3:42 CDT) on Sunday October 8th soon after Nate's second landfall. The 3D precipitation tops (shown in blue) are from GPM's DPR as are the vertical cross sections of precipitation intensity. The first overpass shows that Nate is a very asymmetric storm with most of the rainbands associated with Nate located north and east of the center. With it's rapid movement, Nate was unable to fully develop and lacks the classic ring of intense thunderstorms associated a fully developed eyewall. Although overall much the same, the second overpass shows an area of deep, intense convection producing heavy rains over southwest Alabama. || nate.1890_print.jpg (1024x576) [166.6 KB] || nate.1890_searchweb.png (320x180) [92.3 KB] || nate.1890_thm.png (80x40) [7.5 KB] || nate.mp4 (1920x1080) [37.1 MB] || 1920x1080_16x9_30p (1920x1080) [0 Item(s)] || nate.webm (1920x1080) [5.1 MB] || nate.mp4.hwshow [170 bytes] ||
- ID: 12723 Produced Video
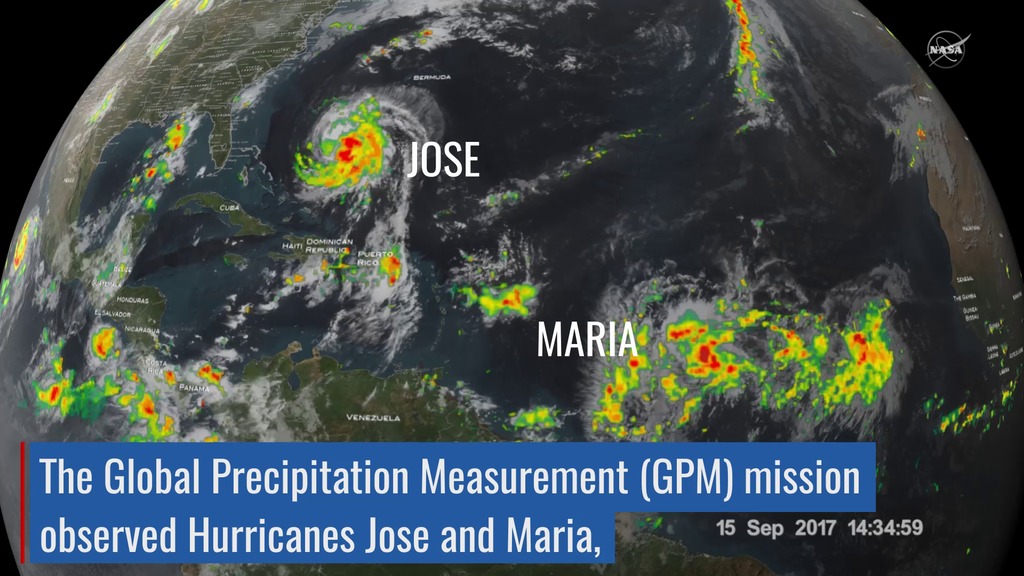
NASA Catches Hurricanes Jose and Maria
Go to this pageMusic: "Tradition-Innovation," Philippe Lhommet, KOKA Media || 12723_JoseMaria.00065_print.jpg (1024x576) [166.5 KB] || 12723_JoseMaria.00065_searchweb.png (320x180) [100.4 KB] || 12723_JoseMaria.00065_thm.png (80x40) [7.3 KB] || 12723_JoseMaria_prores.mov (1920x1080) [928.3 MB] || 12723_JoseMaria_master_twitter_720.mp4 (1280x720) [13.1 MB] || 12723_JoseMaria_master_youtube_720.mp4 (1280x720) [80.1 MB] || 12723_JoseMaria_master_youtube_1080.mp4 (1920x1080) [83.8 MB] || 12723_JoseMaria_master_facebook_720.mp4 (1280x720) [61.2 MB] || 12723_JoseMaria.mp4 (1920x1080) [63.2 MB] || 12723_JoseMaria_prores.webm (1920x1080) [6.4 MB] || 12723_JoseMaria.en_US.srt [1.1 KB] || 12723_JoseMaria.en_US.vtt [1.1 KB] ||
- ID: 12738 Produced Video
![Watch this video on the NASA Goddard YouTube channel.Complete transcript available.Music credits: 'Micro Currents' by Jean-Patrick Voindrot [SACEM], 'Sink Deep' by Andrew Michael Britton [PRS], David Stephen Goldsmith [PRS], Mikey Rowe [PRS] from Killer Tracks.](/vis/a010000/a012700/a012738/LARGE_MP4-12738_RapidIntensification_large.00084_print.jpg)
Intense String of Hurricanes Seen From Space
Go to this pageIn 2017, we have seen four Atlantic storms rapidly intensify with three of those storms - Hurricane Harvey, Irma and Maria - making landfall. When hurricanes intensify a large amount in a short period, scientists call this process rapid intensification. This is the hardest aspect of a storm to forecast and it can be most critical to people’s lives.While any hurricane can threaten lives and cause damage with storm surges, floods, and extreme winds, a rapidly intensifying hurricane can greatly increase these risks while giving populations limited time to prepare and evacuate. ||
- ID: 4585 Visualization
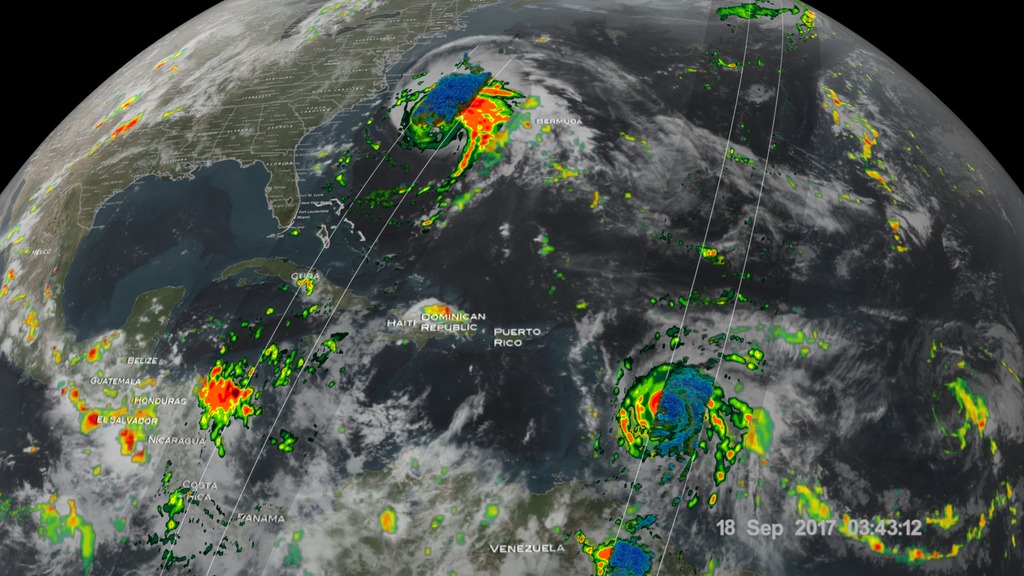
Hurricane Jose lingers in the Atlantic as Hurricane Maria approaches Puerto Rico
Go to this pageGPM passed over both Hurricane Maria and Hurricane Jose on September 18th, 2017. As the camera moves in on the Maria, DPR's volumetric view of the storm is revealed. A slicing plane moves across the volume to display precipitation rates throughout the storm. Shades of green to red represent liquid precipitation extending down to the ground. || JoseMaria_03.6000_print.jpg (576x1024) [192.4 KB] || JoseMaria_03.6000_searchweb.png (320x180) [112.5 KB] || JoseMaria_03.6000_thm.png (80x40) [7.7 KB] || JoseMaria_09-18 (1920x1080) [0 Item(s)] || JoseMaria_03_1080p30.webm (1920x1080) [4.8 MB] || JoseMaria_03_1080p30.mp4 (1920x1080) [81.8 MB] || JoseMaria_09-18 (3840x2160) [0 Item(s)] || JoseMaria_03_2160p30.mp4 (3840x2160) [232.0 MB] || JoseMaria_03_1080p30.mp4.hwshow [186 bytes] ||
- ID: 4584 Visualization
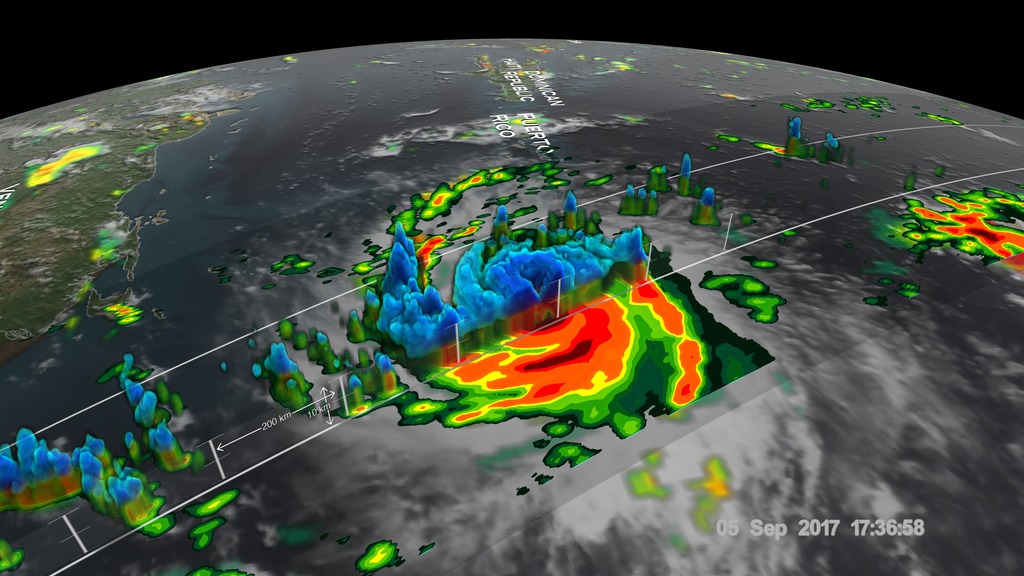
GPM Examines Hurricane Irma
Go to this pageGPM scans Hurricane Irma on September 5th and again on September 7th as the storm approaches Puerto Rico, the Dominican Republic, and Haiti as a category 5 hurricane. This video is also available on our YouTube channel. || Irma_4k_with_dates.2670_print.jpg (1024x576) [158.4 KB] || Irma_4k_with_dates.2670_searchweb.png (320x180) [96.8 KB] || Irma_4k_with_dates.2670_thm.png (80x40) [7.6 KB] || irma_with_dates (1920x1080) [128.0 KB] || Irma_with_dates_1080p30.mp4 (1920x1080) [86.9 MB] || Irma_with_dates_1080p30.webm (1920x1080) [6.3 MB] || irma_with_dates (3840x2160) [128.0 KB] || Irma_4k_with_dates_2160p30.mp4 (3840x2160) [233.2 MB] ||
- Section
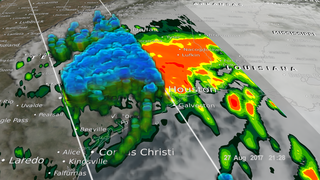
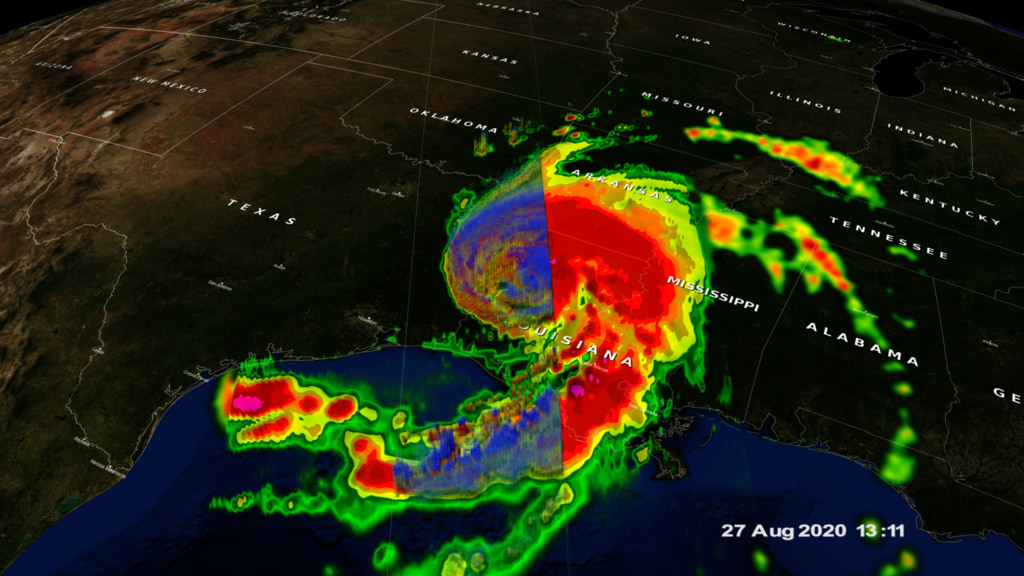
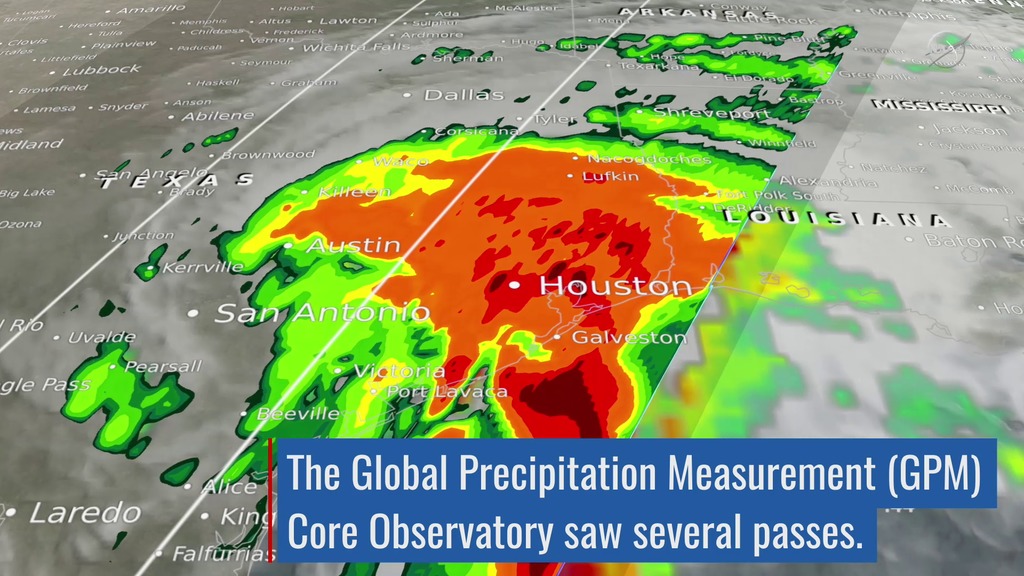
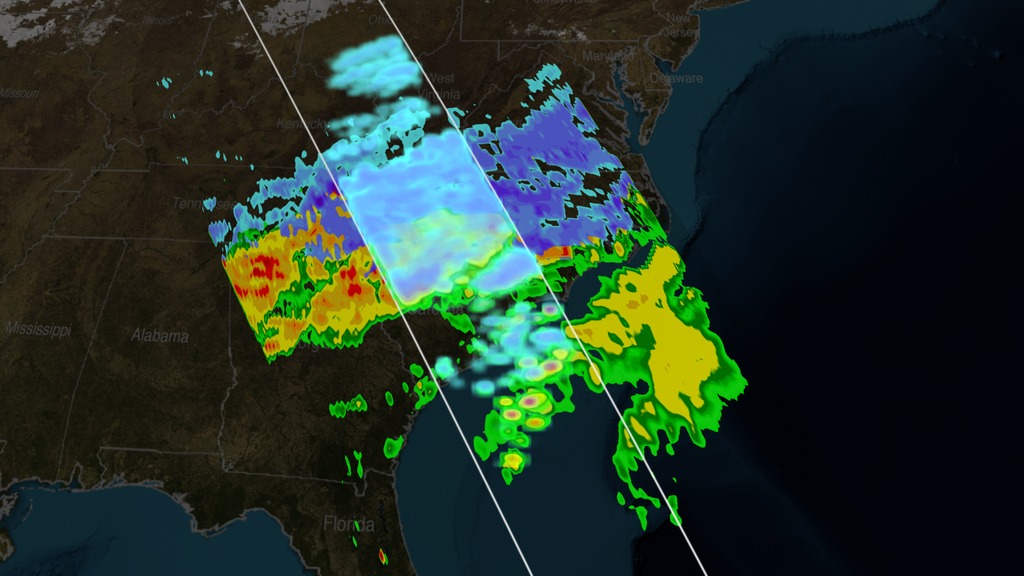
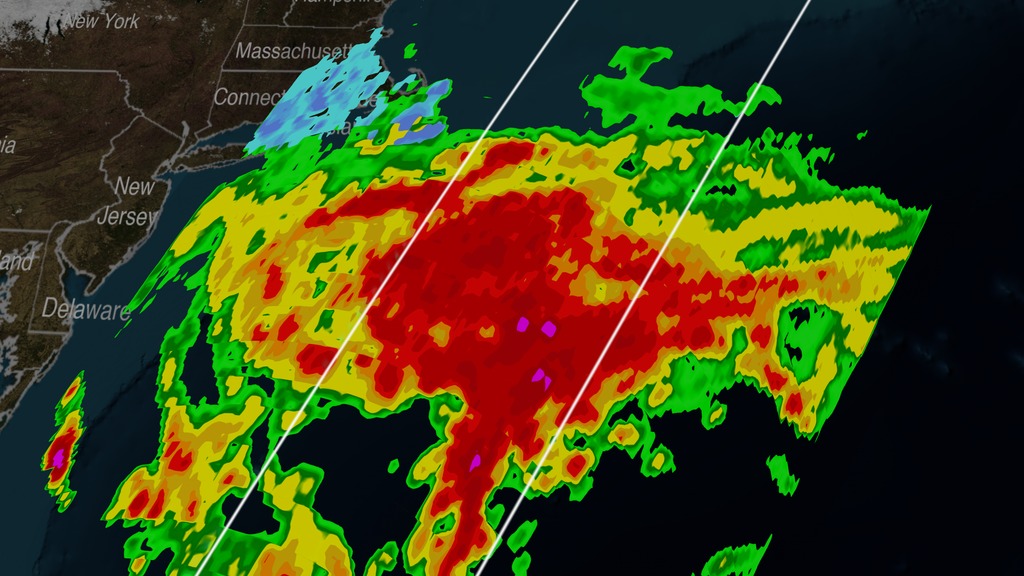
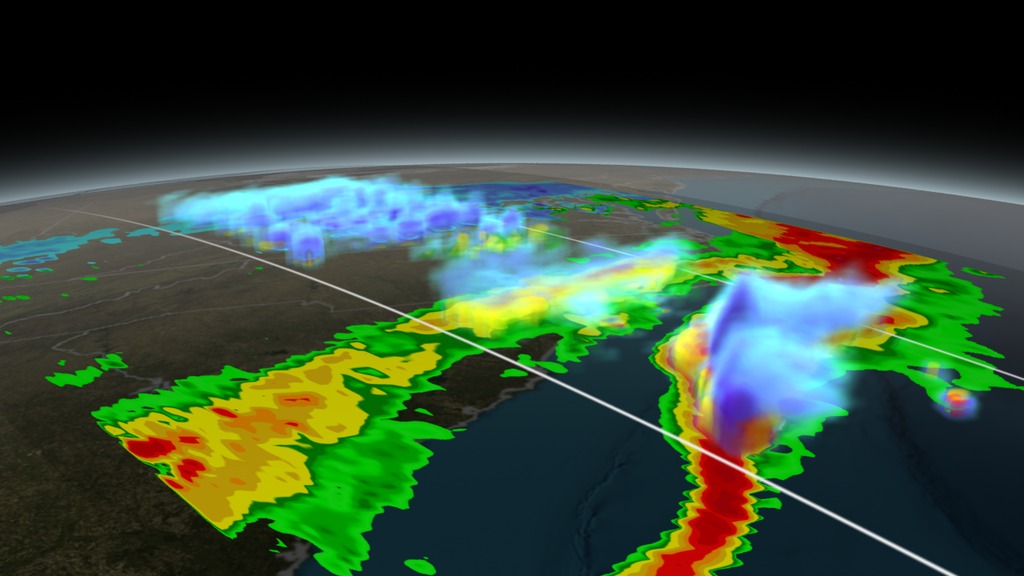
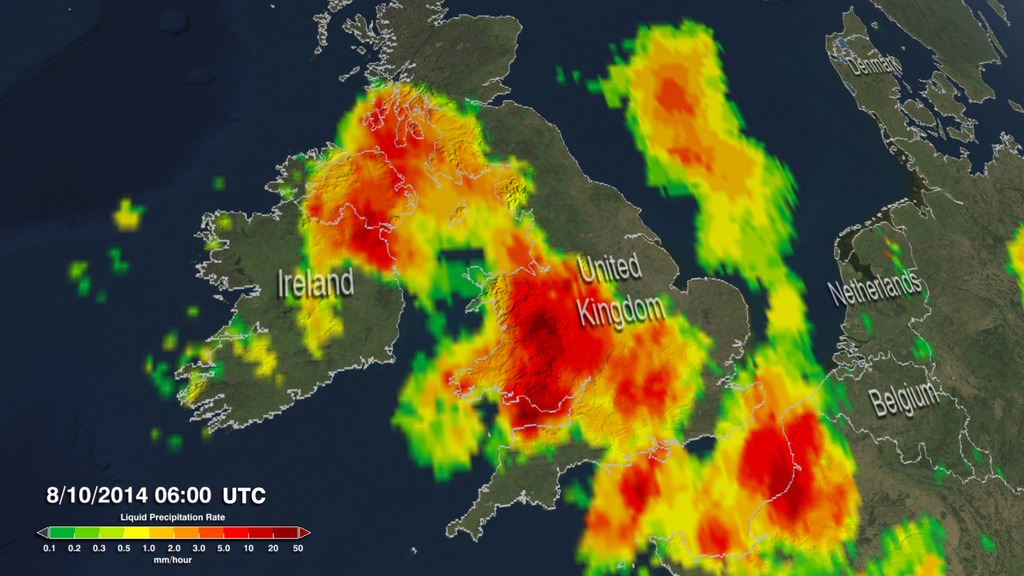
Hurricane Harvey
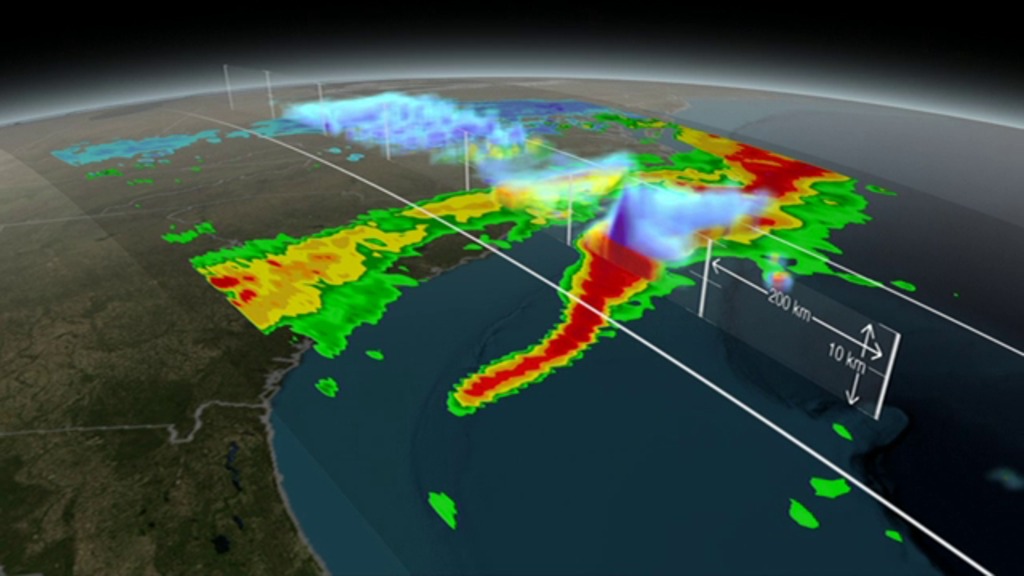
Go to this sectionThe Global Precipitation Mission (GPM) Core Observatory captured these images of Hurricane Harvey at 11:45 UTC and 21:25 UTC on the 27th of August nearly two days after the storm made landfall as it was meandering slowly southeast at just 2 mph (~4 kph) near Victoria, Texas west of Houston. The image shows rain rates derived from GPM's GMI microwave imager (outer swath) and dual-frequency precipitation radar or DPR (inner swath) overlaid on enhanced infrared data from the GOES-East satellite. Harvey's cyclonic circulation is still quite evident in the infrared clouds, but GPM shows that the rainfall pattern is highly asymmetric with the bulk of the rain located north or east of the center. A broad area of moderate rain can be seen stretching from near Galveston Bay to north of Houston and back well to the west. Within this are embedded areas of heavy rain (red areas); the peak estimated rain rate from GPM during these overpasses was 96 mm/hr (~3.77 inches per hour). With Harvey's circulation still reaching out over the Gulf, the storm is able to draw in a continuous supply of warm moist air to sustain the large amount of rain it is producing.
- ID: 12697 Produced Video
NASA Captures Hurricane Harvey's Rainfall
Go to this pageMusic: "Whirlpool," Michael Jan Levine, Killer Tracks || 4458_Hurricane_Harvey_final_large.00656_print.jpg (1024x576) [189.0 KB] || 4458_Hurricane_Harvey_final_large.00656_searchweb.png (320x180) [107.2 KB] || 4458_Hurricane_Harvey_final_large.00656_thm.png (80x40) [7.8 KB] || 12697_Hurricane_Harvey_MASTER.webm (960x540) [36.1 MB] || 12697_Hurricane_Harvey_MASTER_facebook_720.mp4 (1280x720) [95.2 MB] || 12697_Hurricane_Harvey_MASTER_youtube_1080.mp4 (1920x1080) [128.4 MB] || 12697_Hurricane_Harvey_prores.mov (1920x1080) [1.2 GB] || 12697_Harvey.en_US.srt [1.4 KB] || 12697_Harvey.en_US.vtt [1.4 KB] ||
2016 Hurricanes & Typhoons
- ID: 4575
 Visualization
 - ID: 4543
 Visualization
 - ID: 4548
 Visualization
 - ID: 12391
 Produced Video
 - ID: 12389
 Produced Video
 - ID: 4512
 Visualization
 - ID: 4511
 Visualization
 - ID: 4508
 Visualization
 - ID: 4507
 Visualization
 - ID: 4495
 Visualization
 - ID: 4437
 Visualization
 - ID: 4434
 Visualization
 - ID: 12164
 Produced Video
2015 Hurricanes & Typhoons
- ID: 4367 Visualization
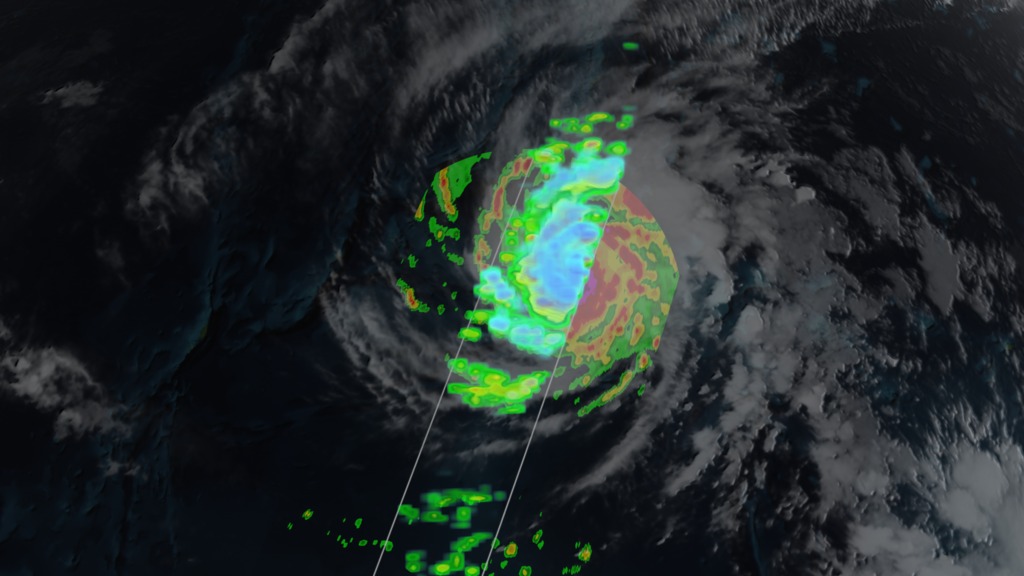
Joaquin
Go to this pageAnimation of Tropical Storm Joaquin on September 29, 2015 right before it intensified into a hurricane. The camera moves in on the storm, and the visualization concludes with a 360 degree view around the storm. This video is also available on our YouTube channel. || joaquin.0290_print.jpg (1024x576) [157.3 KB] || joaquin.0290_searchweb.png (320x180) [98.0 KB] || joaquin.0290_thm.png (80x40) [6.7 KB] || joaquin_w360 (1920x1080) [0 Item(s)] || joaquin_w360_1080p30.mp4 (1920x1080) [59.7 MB] || Joaquin_colorbar_1080p_p30.mp4 (1920x1080) [61.5 MB] || Joaquin_colorbar_1080p_p30.webm (1920x1080) [6.4 MB] || joaquin_w360_4367.key [63.8 MB] || joaquin_w360_4367.pptx [61.3 MB] ||
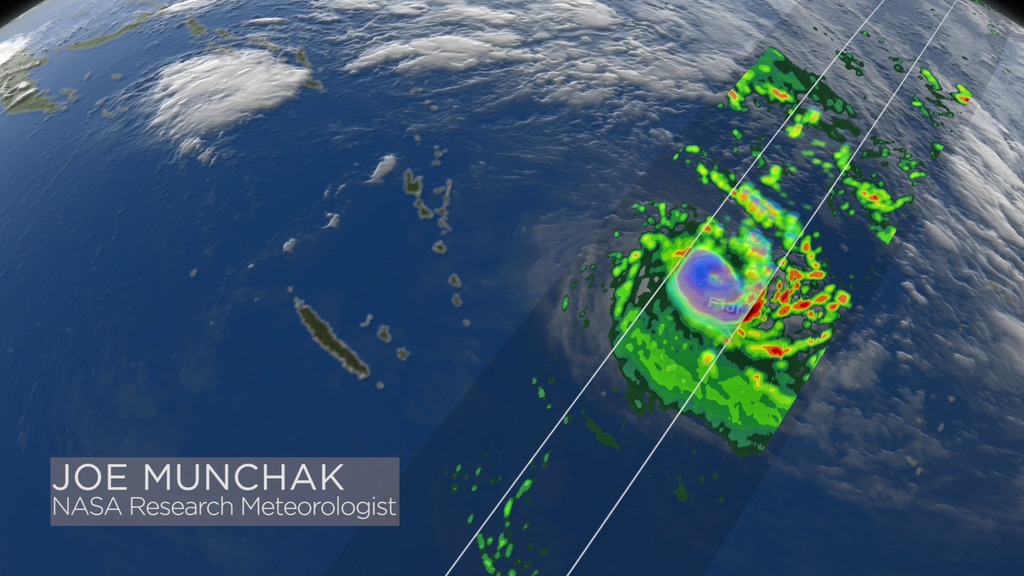
- ID: 12007 Produced Video
GPM Gets a Ton of Kilo
Go to this pageA narrated visualization of Hurricane/Typhoon Kilo.For complete transcript, click here. || Kilo_still_print.jpg (1024x583) [160.6 KB] || Kilo_still_searchweb.png (320x180) [110.8 KB] || Kilo_still_thm.png (80x40) [9.9 KB] || APPLE_TV_G2015-074_Kilo_master_appletv.m4v (1280x720) [48.5 MB] || WEBM_G2015-074_Kilo_master.webm (960x540) [42.5 MB] || APPLE_TV_G2015-074_Kilo_master_appletv_subtitles.m4v (1280x720) [48.5 MB] || YOUTUBE_HQ_Kilo_final_revised_youtube_hq.mov (1920x1080) [596.0 MB] || YOUTUBE_HQ_G2015-074_Kilo_master_youtube_hq.mov (1920x1080) [596.0 MB] || Kilo.en_US.srt [1.7 KB] || Kilo.en_US.vtt [1.7 KB] || NASA_PODCAST_G2015-074_Kilo_master_ipod_sm.mp4 (320x240) [17.3 MB] || G2015-074_Kilo_master_prores.mov (1920x1080) [2.8 GB] ||
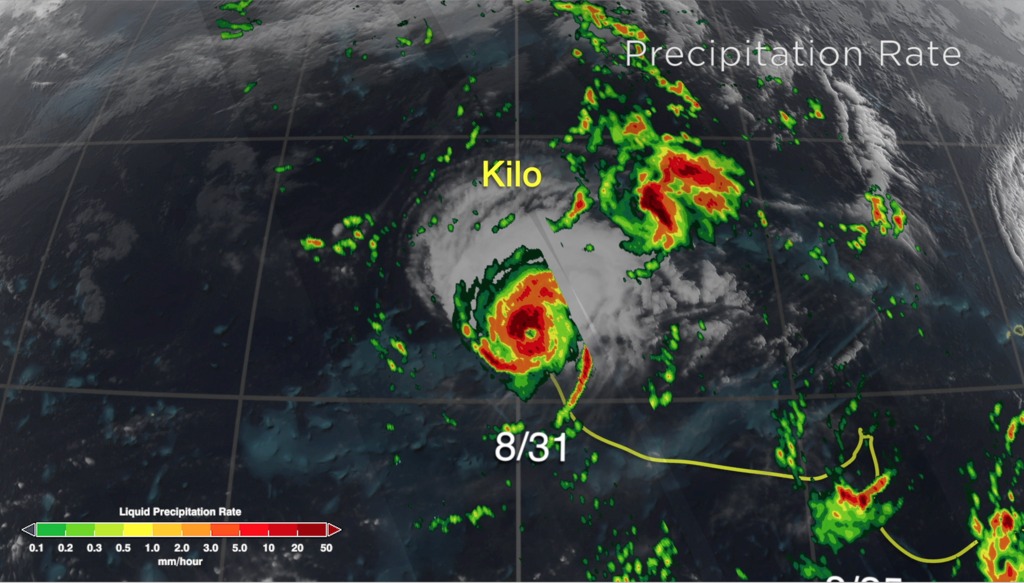
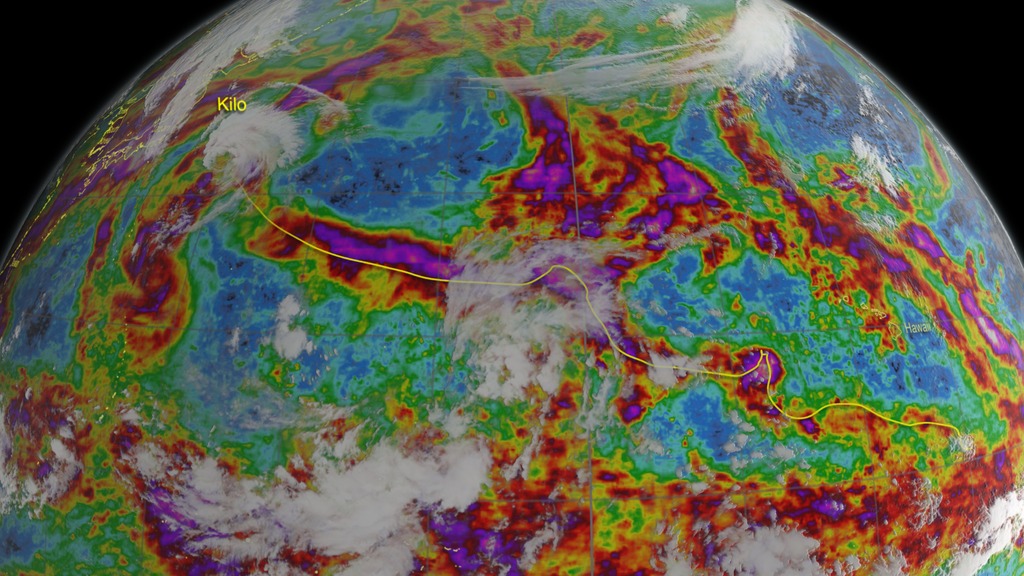
- ID: 4358 Visualization
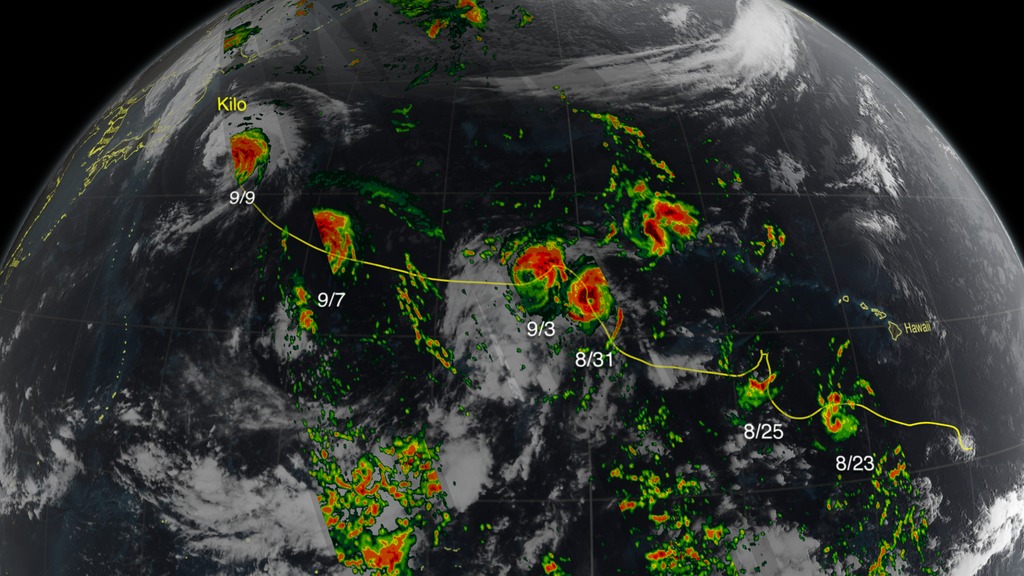
Tracking Kilo from Hurricane to Typhoon
Go to this pageGlobal visualization of Hurricane Kilo as it formed in the Eastern Pacific and moved across the international dateline finally diminishing in the Western Pacific near Japan. As Kilo progresses, GPM captures swathes of surface precipitation data throughout the storm's life cycle. || kilo0909.1100_print.jpg (1024x576) [188.5 KB] || kilo0909.1100_searchweb.png (320x180) [105.1 KB] || kilo0909.1100_thm.png (80x40) [7.2 KB] || kilo0909_1080p30.mp4 (1920x1080) [57.6 MB] || global_view (1920x1080) [0 Item(s)] || kilo0909_1080p30.webm (1920x1080) [5.1 MB] ||
- ID: 4354 Visualization
Tropical Storm Fred
Go to this pageAnimation of Tropical Storm Fred via GPM on August 30, 2015 at 0236 UTC. || fred.0280_print.jpg (1024x576) [162.5 KB] || fred_1080p30.mp4 (1920x1080) [16.5 MB] || 1920x1080_16x9_30p (1920x1080) [32.0 KB] || fred_1080p30.webm (1920x1080) [3.1 MB] ||
- ID: 4316 Visualization
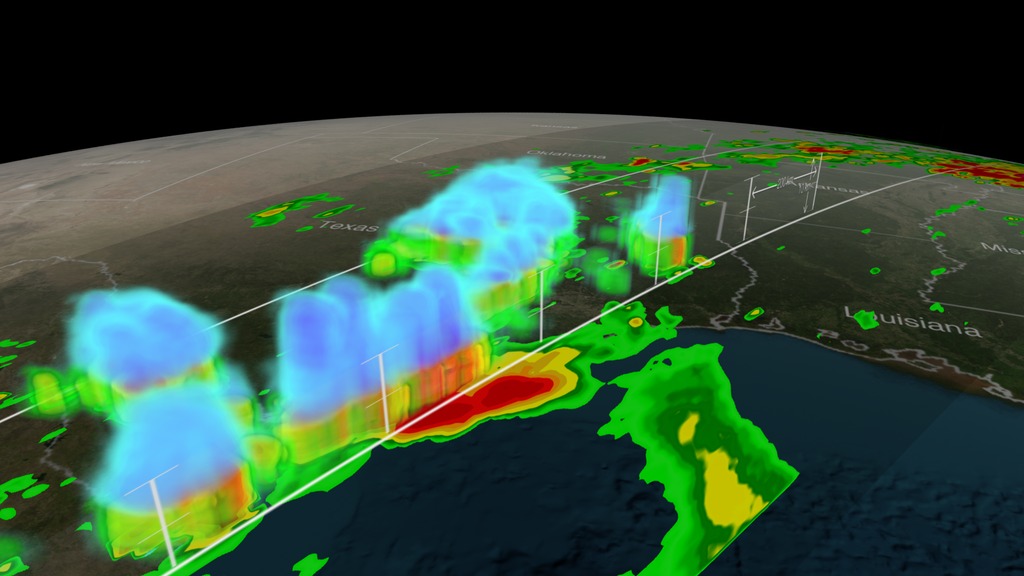
Tropical Storm Bill Over Texas
Go to this pageVisualization of rainfall over Texas as Tropical Storm Bill further drenched the state with rain on June 17, 2015 at 6:11:27Z. Shades of blue indicate frozen precipitation in the atmosphere and shades of green to red show liquid precipitation. || bill1080.1220_print.jpg (1024x576) [105.2 KB] || bill1080.1220_searchweb.png (320x180) [72.0 KB] || bill1080.1220_thm.png (80x40) [6.0 KB] || bill1080.mp4 (1920x1080) [24.5 MB] || bill_720p.mp4 (1280x720) [12.7 MB] || 1920x1080_16x9_30p (1920x1080) [0 Item(s)] || 1280x720_16x9_30p (1280x720) [0 Item(s)] || bill_720p.webm (1280x720) [5.1 MB] || bill_4316.key [29.1 MB] || bill_4316.pptx [26.5 MB] || bill1080.mp4.hwshow [184 bytes] ||
- ID: 4303 Visualization
GPM Examines Super Typhoon Maysak
Go to this pageVisualization depicting Typhoon Maysak in the Southwest Pacific region as observed by the Global Precipitation Measurement (GPM) Core Satellite on March 30th, 2015. GPM/GMI precipitation rates are displayed as the camera moves in on the storm. A slicing plane moves across the volume to display precipitation rates throughout the structure of the storm. Shades of green to red represent liquid precipitation extending down to the ground. This video is also available on our YouTube channel. || Maysak_1080.1345_print.jpg (1024x576) [104.6 KB] || Maysak_1080.1345_print_thm.png (80x40) [6.4 KB] || Maysak_1080.1345_searchweb.png (320x180) [91.5 KB] || Maysak_720p30.mp4 (1280x720) [10.1 MB] || Maysak_1080p30.mp4 (1920x1080) [17.4 MB] || 1920x1080_16x9_30p (1920x1080) [128.0 KB] || Mayask_colorbar_1080p_p30.mp4 (1920x1080) [36.3 MB] || Mayask_colorbar_1080p_p30.webm (1920x1080) [4.0 MB] || Maysak_360p30.mp4 (640x360) [3.9 MB] ||
- ID: 12113 Produced Video
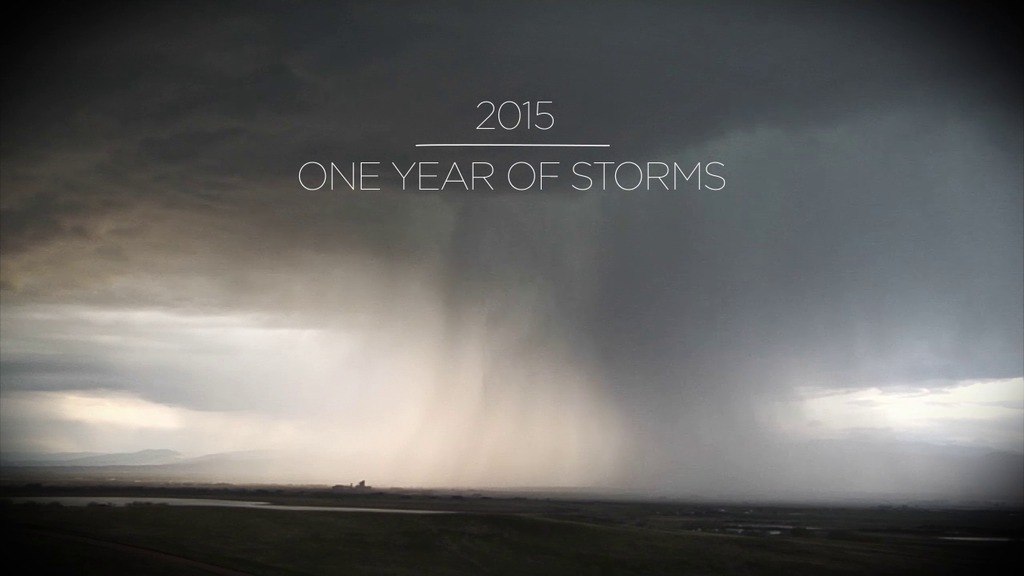
GPM 2015: One Year of Storms
Go to this pageA look back at the storms captured by GPM for 2015. || GPM_2015_Year_print.jpg (1024x576) [63.5 KB] || GPM_2015_Year_searchweb.png (320x180) [55.1 KB] || GPM_2015_Year_thm.png (80x40) [4.6 KB] || 12113_GPMYear2015_MASTER.mov (1280x720) [1.1 GB] || GPM_2015_Year.mp4 (1280x720) [163.0 MB] || 12113_GPMYear2015_MASTER.webm (1280x720) [17.2 MB] || 12113_GPMYear2015_MASTER.mpeg (1280x720) [539.6 MB] || 12113_GPMYear2015_MASTER_appletv.m4v (1280x720) [78.9 MB] || 12113_GPMYear2015_MASTER_large.mp4 (1280x720) [164.5 MB] || 12113_GPMYear2015_MASTER_appletv_subtitles.m4v (1280x720) [78.9 MB] || GPM_2015_Year.en_US.srt [1.3 KB] || GPM_2015_Year.en_US.vtt [1.4 KB] ||
2014 Hurricanes & Typhoons
- ID: 4248 Visualization
GPM Dissects Typhoon Hagupit
Go to this pageAnimation revealing a swath of GPM/GMI precipitation rates over Typhoon Hagupit. As the camera moves in on the storm, DPR's volumetric view of the storm is revealed. A slicing plane moves across the volume to display precipitation rates throughout the storm. Shades of green to red represent liquid precipitation extending down to the ground.This video is also available on our YouTube channel. || Hagupit_1080p_01.0396_print.jpg (1024x576) [146.6 KB] || Hagupit_1080p_01.0396_searchweb.png (320x180) [80.3 KB] || Hagupit_1080p_01.0396_thm.png (80x40) [6.7 KB] || Hagupit_1080p_01.0396_web.png (320x180) [80.3 KB] || Hagupit_1080p_01_1080.mp4 (1920x1080) [39.7 MB] || Hagupit_720p_01_720.mp4 (1280x720) [10.1 MB] || Hagupit_540p_30.mp4 (960x540) [6.9 MB] || 1920x1080_16x9_30p (1920x1080) [128.0 KB] || Hagupit_colorbar_1080p_p30.mp4 (1920x1080) [40.6 MB] || Hagupit_colorbar_1080p_p30.webm (1920x1080) [4.1 MB] || Hagupit_1080p_01_1080.mp4.hwshow [214 bytes] ||
- ID: 4224 Visualization
GPM Scans Typhoon Phanfone
Go to this pageAnimation revealing a swath of GPM/GMI precipitation rates over Typhoon Phanfone. The camera then moves down closer to the storm to reveal DPR's volumetric view of Phanphone. A slicing plane dissects the Typhoon from south to north and back again, revealing it's inner precipitation rates. Shades of blue indicate frozen precipitation (in the upper atmosphere). Shades of green to red are liquid precipitation which extend down to the ground. || phanfone1080p.0380_print.jpg (1024x576) [116.5 KB] || phanfone1080p.0380_searchweb.png (320x180) [74.4 KB] || phanfone1080p.0380_web.png (320x180) [74.4 KB] || phanfone1080p.0380_thm.png (80x40) [6.6 KB] || phanfone1080p.mp4 (1920x1080) [12.5 MB] || phanfone720p.mp4 (1280x720) [7.1 MB] || 1920x1080_16x9_30p (1920x1080) [0 Item(s)] || phanfone1080p.webm (960x540) [4.4 MB] || phanfone360p.mp4 (640x360) [2.8 MB] ||
- ID: 4229 Visualization
GPM Explores Typhoon Vongfong
Go to this pageAnimation revealing a swath of GPM/GMI precipitation rates over Typhoon Vongfong. As the camera moves in on the storm, DPR's volumetric view of the storm is revealed. A slicing plane moves across the volume to display precipitation rates throughout the storm. Shades of green to red represent liquid precipitation extending down to the ground. This video is also available on our YouTube channel. || vongfong_720p.0690_print.jpg (1024x576) [146.8 KB] || 1920x1080_16x9_30p (1920x1080) [64.0 KB] || 1280x720_16x9_30p (1280x720) [64.0 KB] || vongfong_1080p.mp4 (1920x1080) [19.2 MB] || vongfong_720p.mp4 (1280x720) [10.5 MB] || Vongfong_colorbar_1080p_p30.mp4 (1920x1080) [44.1 MB] || Vongfong_colorbar_1080p_p30.webm (1920x1080) [3.1 MB] || vongfong_640x360.mp4 (640x360) [4.2 MB] || vongfong_1080p.mp4.hwshow [200 bytes] ||
- ID: 4213 Visualization
GPM captures Hurricane Odile
Go to this pageOn September 15, 2014 (15:11 UTC) the Global Precipitation Measurement (GPM) mission's Core Observatory flew over Hurricane Odile as it made landfall on the Baja peninsula. At this point, Hurricane Odile is category 2 with maximum sustained winds at 98 miles per hour (mph) and gusts reaching 121 mph. Odile caused major damage to several Mexican beach resorts including Cabo San Lucas, and has the potential to cause flash flooding as far as Phoenix, Arizona.The GPM Core Observatory carries two instruments that show the location and intensity of rain and snow, which defines a crucial part of the storm structure – and how it will behave. The GPM Microwave Imager sees through the tops of clouds to observe how much and where precipitation occurs, and the Dual-frequency Precipitation Radar observes precise details of precipitation in 3-dimensions.For forecasters, GPM's microwave and radar data are part of the toolbox of satellite data, including other low Earth orbit and geostationary satellites, that they use to monitor tropical cyclones and hurricanes. The addition of GPM data to the current suite of satellite data is timely. Its predecessor precipitation satellite, the Tropical Rainfall Measuring Mission, is 18 years into what was originally a three-year mission. GPM's new high-resolution microwave imager data and the unique radar data ensure that forecasters and modelers won't have a gap in coverage. GPM is a joint mission between NASA and the Japan Aerospace Exploration Agency. All GPM data products can be found at NASA Goddard's Precipitation Processing Center website. ||
- ID: 4186 Visualization
GPM Dissects Hurricane Arthur
Go to this pageThe Global Precipitation Measurement mission's Core Observatory flew over Hurricane Arthur five times between July 1 and July 6, 2014. Arthur is the first tropical cyclone of the 2014 Atlantic Hurricane season. It formed as a tropical storm on Tuesday, July 1 and reached maximum intensity as a Category 2 hurricane on July 4, disrupting some coastal U.S. Independence Day celebrations. This visualization is taken from the flyover on July 3, 2014 with Hurricane Arthur just off the South Carolina coast. GPM data showed that the hurricane was asymmetrical, with spiral arms, called rain bands, on the eastern side of the storm but not on the western side.The GPM Core Observatory carries two instruments that show the location and intensity of the rain, which defines a crucial part of the storm structure – and how it will behave. The GPM Microwave Imager sees through the tops of clouds to observe how much and where precipitation occurs, and the Dual-frequency Precipitation Radar observes precise details of precipitation in 3-dimensions.For forecasters, GPM's microwave and radar data are part of the toolbox of satellite data, including other low Earth orbit and geostationary satellites, that they use to monitor tropical cyclones and hurricanes. The addition of GPM data to the current suite of satellite data is timely. Its predecessor precipitation satellite, the Tropical Rainfall Measuring Mission, is 18 years into what was originally a three-year mission. GPM's new high-resolution microwave imager data and the unique radar data ensure that forecasters and modelers won't have a gap in coverage. GPM is a joint mission between NASA and the Japan Aerospace Exploration Agency. The satellite launched Feb. 27, and after its check-out period began its prime mission on May 29, in time for hurricane season.All GPM data products will be released to the public by September 2, 2104. Current and future data sets are available to registered users from NASA Goddard's Precipitation Processing Center website. ||
Snow
- ID: 4615
 Visualization
 - ID: 4570
 Visualization
 - ID: 4553
 Visualization
 - ID: 4276

- ID: 4278
- ID: 4266
 Visualization
 - ID: 4173
 Visualization
 - ID: 4203
 Visualization
 - ID: 12848
![Complete transcript available.Music credit: “Reach Into The Night” by Andrew Michael Britton [PRS], David Stephen Goldsmith [PRS], Mikey Rowe [PRS] and “Progressive Practice” by Emmanuel David Lipszyc [SACEM], Franck Lascombes [SACEM], Sebastien Charles Lipszyc [SACEM] From Killer TracksWatch this video on the NASA Goddard YouTube channel.](/vis/a010000/a012800/a012848/12848_ICEPOP_Final.00547_print.jpg) Produced Video
Produced Video - ID: 12576
 Produced Video
  Section
- ID: 11635
 Produced Video
 - ID: 11067
 Produced Video
 - ID: 10938
 Produced Video
Other Extreme Weather
- ID: 5569 Visualization

Texas Hill Country Hit by Powerful Floods
Go to this pageGPM passed over the Texas storm on July 4th, 11am CT.
- ID: 14113 Produced Video
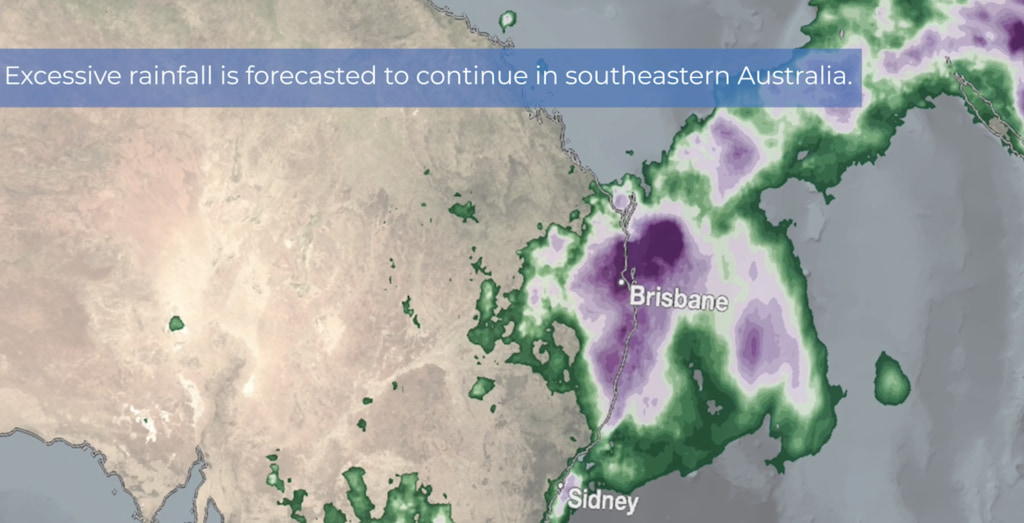
IMERG Catches Australian "Rain Bomb"
Go to this pageMusic: "Swim Against the Tide," Universal Production Music || australiarainbomb_print.jpg (1024x523) [126.5 KB] || australiarainbomb.png (3202x1638) [6.0 MB] || australiarainbomb_searchweb.png (320x180) [103.7 KB] || australiarainbomb_thm.png (80x40) [10.7 KB] || Australia_floods_2022_IMERG_fixed.mp4 (1920x1080) [66.8 MB] || Australia_floods_2022_IMERG_fixed.webm (1920x1080) [7.1 MB] || Australia_floods_2022_Fixed_prores.mov (1920x1080) [775.4 MB] ||
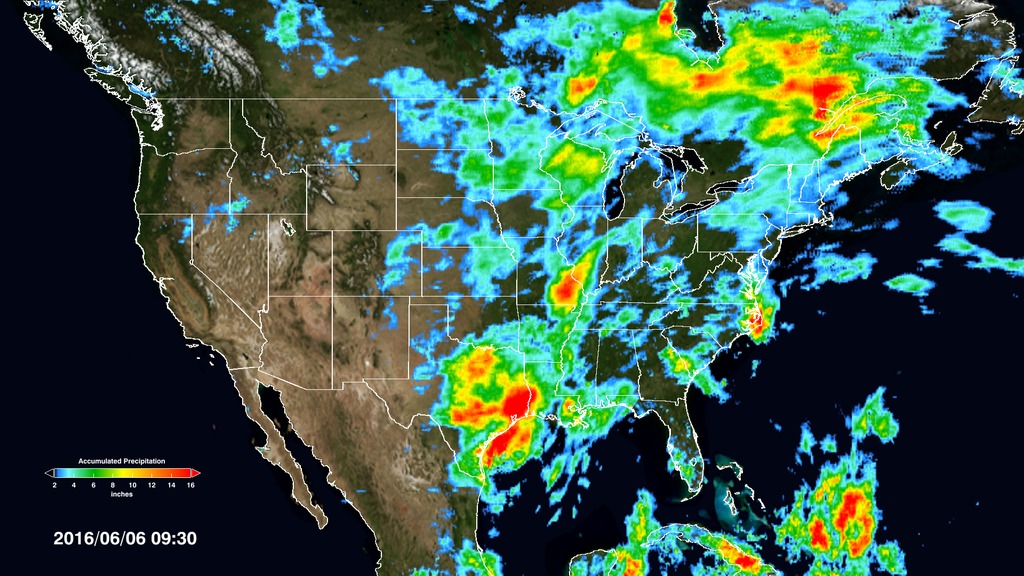
- ID: 4497 Visualization
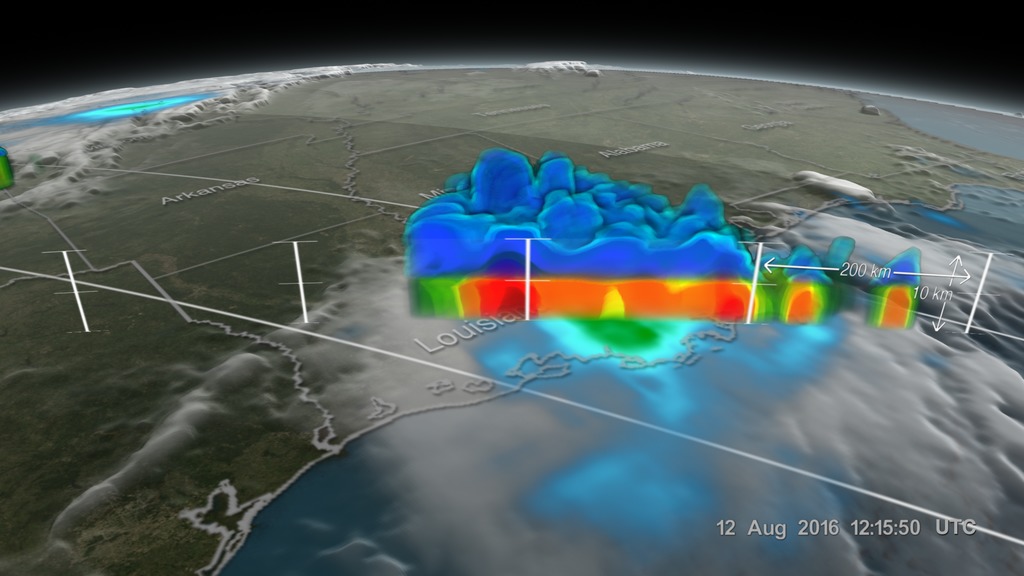
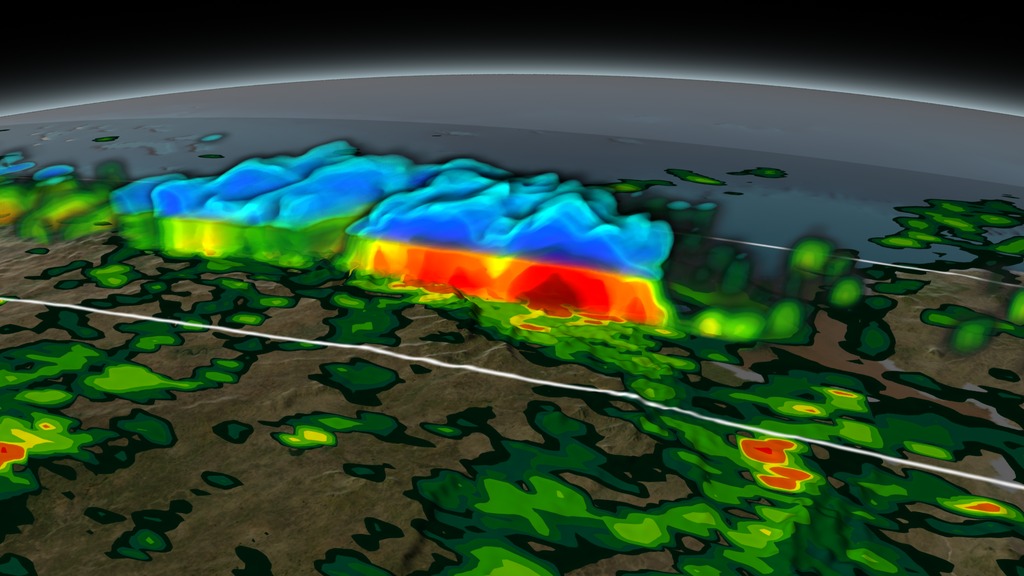
GPM sees Louisiana Floods
Go to this pageThis visualization begins with an overview of the United States showing the clouds and rainfall accumulation of the massive rain event over Louisiana beginning on August 11th, 2016 through August 13th, 2016. The camera then begins to zoom in as time resets to August 11th. Time then slows way down on August 12th to show the first of GPM's passes. In this close up of GPM's volumetric DPR data over Louisiana, a cutting plane materializes into view to show the inner structure of this giant storm system. From this view, one can clearly see the heavy amounts of rain in the center of the storm (depicted in yellow, orange, and red). The GPM data then dissolves away as time speeds up before slowing down again later on that same day. This time GPM captures a much larger swath of the storm. Dissolving in the cutting plane again reveals huge amounts of rainfall at this later time. As the GPM data dissolves away again, time speeds back up to show the rest of the rainfall accumulation partway through August 13. At this time, a large portion of Louisiana can be seen completely saturated with rainfall accumulations (depicted in shades of orange to red). || la_flood_rainaccum_w_dates.1190_print.jpg (1024x576) [106.8 KB] || la_flood_rainaccum_w_dates.1190_searchweb.png (320x180) [83.6 KB] || la_flood_rainaccum_w_dates.1190_thm.png (80x40) [6.6 KB] || la_flood_rainaccum_w_dates_1080p30_2.mp4 (1920x1080) [33.4 MB] || example_composite (1920x1080) [128.0 KB] || dates (1920x1080) [64.0 KB] || state_outlines (1920x1080) [128.0 KB] || dpr_clipped_1221Z (1920x1080) [64.0 KB] || dpr_1221Z (1920x1080) [64.0 KB] || dpr_clipped_0220Z (1920x1080) [64.0 KB] || dpr_0220Z (1920x1080) [64.0 KB] || rain_accumulation (1920x1080) [64.0 KB] || gpm_gprof (1920x1080) [128.0 KB] || cloudy_earth (1920x1080) [128.0 KB] || la_flood_rainaccum_w_dates_1080p30_2.webm (1920x1080) [5.7 MB] || la_flood_rainaccum_w_dates_1080p30_2.mp4.hwshow [244 bytes] ||
- ID: 4400 Visualization
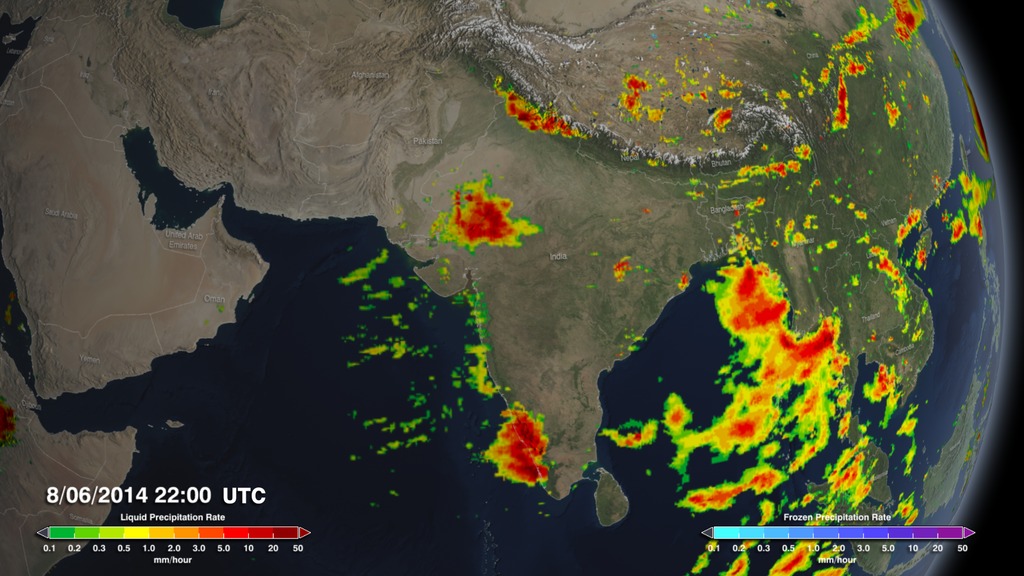
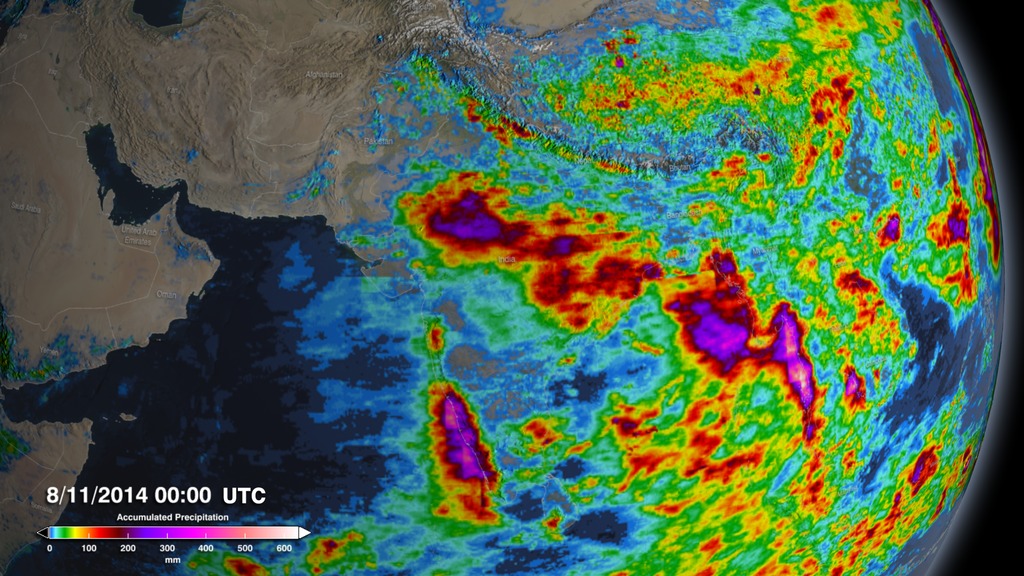
India Monsoon - July 2014
Go to this pageAnimation of a monsoon over the western coast of India on July 28th, 2014. As the camera moves in, a cutting plane reveals the inner structures of the storm. || india_monsoon_1080p_30fps.1250_print.jpg (1024x576) [137.3 KB] || india_monsoon_1080p_30fps.1250_searchweb.png (320x180) [86.0 KB] || india_monsoon_1080p_30fps.1250_thm.png (80x40) [6.9 KB] || 1920x1080_16x9_30p (1920x1080) [0 Item(s)] || india_monsoon_1080p_30fps.mp4 (1920x1080) [64.1 MB] || india_monsoon_1080p_30fps.webm (1920x1080) [4.9 MB] || india_monsoon_1080p_30fps.mp4.hwshow [191 bytes] ||
- ID: 12378 Produced Video
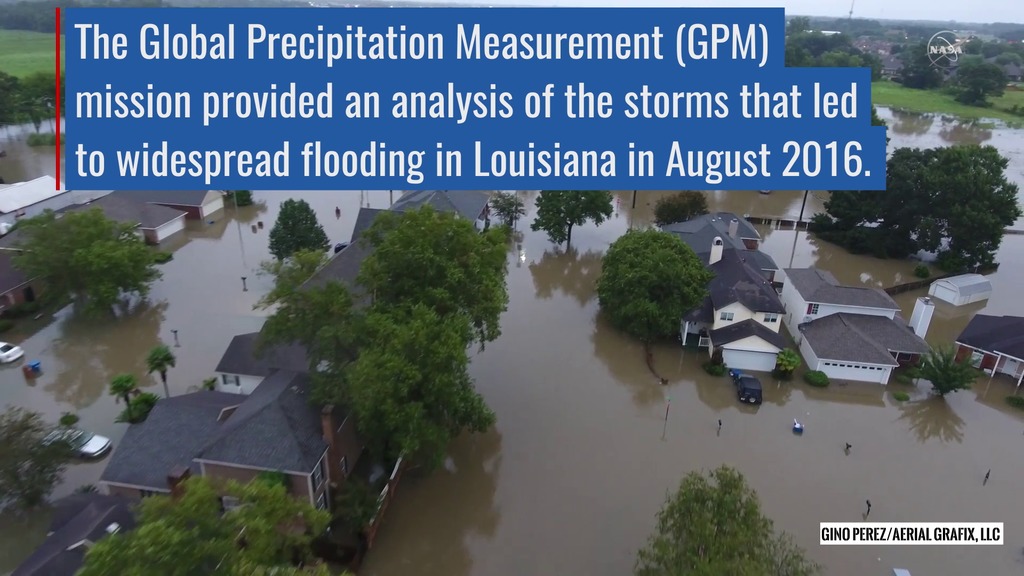
GPM Provides a Closer Look at the Louisiana Floods
Go to this pageMusic: Chris White, "Afterglow"Complete transcript available. || 12378_LAFlooding.00183_print.jpg (1024x576) [150.9 KB] || 12378_LAFlooding.00183_thm.png (80x40) [7.2 KB] || 12378_LAFlooding.00183_searchweb.png (320x180) [97.5 KB] || 12378_LAFlooding.mp4 (1920x1080) [78.8 MB] || 12378_LAFlooding_prores.mov (1920x1080) [998.2 MB] || 12378_LAFlooding_prores.webm (1920x1080) [7.5 MB] || 12378_LAFlooding.en_US.srt [1.4 KB] || 12378_LAFlooding.en_US.vtt [1.4 KB] ||
- ID: 12255 Produced Video
Monsoons: Wet, Dry, Repeat...
Go to this pageComplete transcript available.Music: Letting Go by Mario Lauer, 24 Dimensions by Christian Telford, David Travis Edwards, Matthew St. Laurent, and Robert Anthony Navarro || Monsoon_narrated_1080_30fps_youtube.00749_print.jpg (1024x576) [184.2 KB] || Monsoon_narrated_1080_30fps_youtube.00749_searchweb.png (180x320) [92.7 KB] || Monsoon_narrated_1080_30fps_youtube.00749_thm.png (80x40) [6.3 KB] || monsoonnarrfull.en_US.srt [4.9 KB] || monsoonnarrfull.en_US.vtt [4.9 KB] || 12255_Monsoons_1080_30fps.mp4 (1920x1080) [406.7 MB] || 12255_Monsoons_1080_60fps.mp4 (1920x1080) [409.0 MB] || 12255_Monsoons_4k_60fps_prores.mov (3840x2160) [27.8 GB] || 12255_Monsoons_4k30fps_youtube.mp4 (3840x2160) [1008.7 MB] || 12255_Monsoons_4k_60fps.webm (3840x2160) [131.9 MB] ||
- ID: 12254 Produced Video

Life of the Monsoon
Go to this pageAdditional footage: pond5.comMusic: Ruminations by Miriam Cutler, 24 Dimensions by Christian Telford, David Travis Edwards, Matthew St. Laurent, and Robert Anthony NavarroComplete transcript available.Watch this video on the NASA Goddard YouTube channel. || life_monsoon_still_print.jpg (1024x578) [133.9 KB] || life_monsoon_still_searchweb.png (320x180) [94.5 KB] || life_monsoon_still_thm.png (80x40) [9.4 KB] || 12254_Life_of_the_Monsoon_prores.mov (1920x1080) [7.6 GB] || 12254_Life_of_the_Monsoon.mpeg (1280x720) [933.1 MB] || 12254_Life_of_the_Monsoon_appletv.m4v (1280x720) [141.4 MB] || 12254_Life_of_the_Monsoon_youtube_hq.mov (1920x1080) [2.3 GB] || 12254_Life_of_the_Monsoon.webm (960x540) [112.9 MB] || 12254_Life_of_the_Monsoon_large.mp4 (1920x1080) [282.0 MB] || 12254_Life_of_the_Monsoon_appletv_subtitles.m4v (1280x720) [141.5 MB] || LifeMonsoon.en_US.srt [5.1 KB] || LifeMonsoon.en_US.vtt [5.1 KB] || 12254_Life_of_the_Monsoon_ipod_sm.mp4 (320x240) [49.6 MB] ||
- ID: 12583 Produced Video
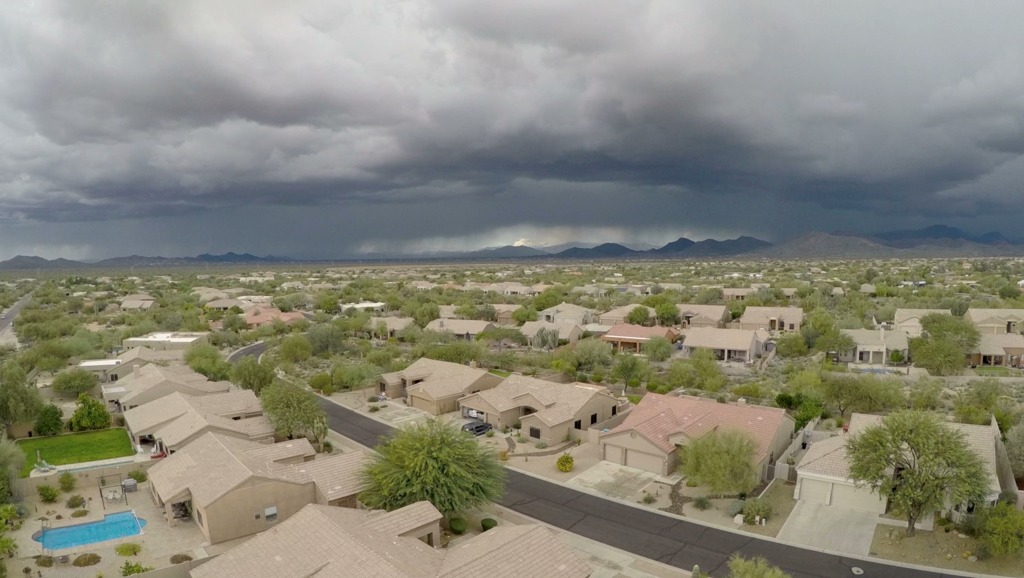
North American Monsoon
Go to this pageMusic: "Mesmerized Housewives," Donn WIlkersonComplete transcript available. || NAM_still_print.jpg (1024x578) [142.4 KB] || NAM_still_searchweb.png (320x180) [98.6 KB] || NAM_still_thm.png (80x40) [7.1 KB] || 12069_NAM_final_prores.mov (1920x1080) [2.7 GB] || 12069_NAM_final_1.mp4 (1920x1080) [160.4 MB] || 12069_NAM_final_large.mp4 (1920x1080) [108.5 MB] || 12069_NAM_final_appletv.m4v (1280x720) [68.8 MB] || 12069_NAM_final_prores.webm (1920x1080) [11.2 MB] || 12069_NAM_final_appletv_subtitles.m4v (1280x720) [68.8 MB] || 12069_NAM.en_US.srt [1.8 KB] || 12069_NAM.en_US.vtt [1.9 KB] ||
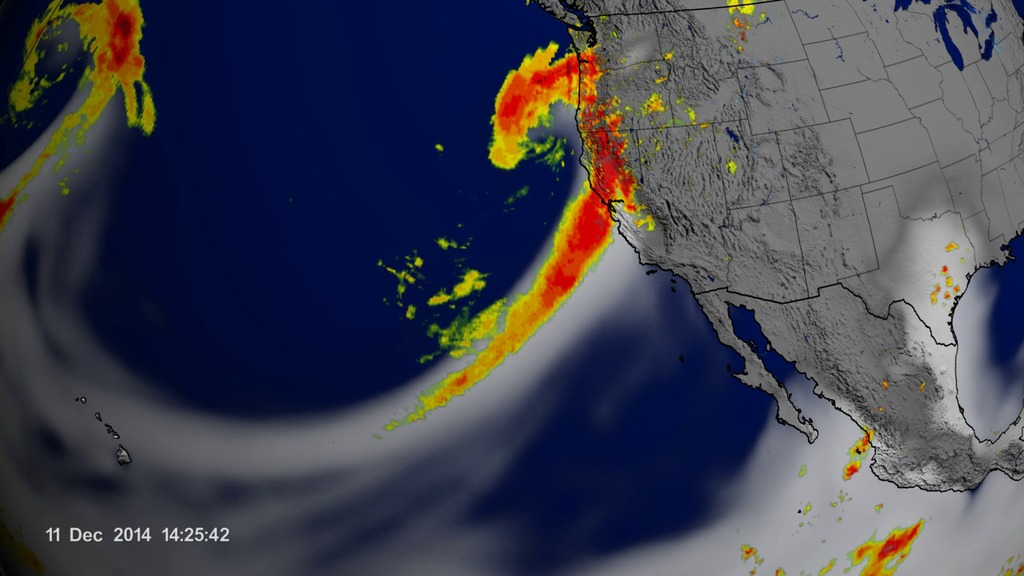
- ID: 12169 Produced Video
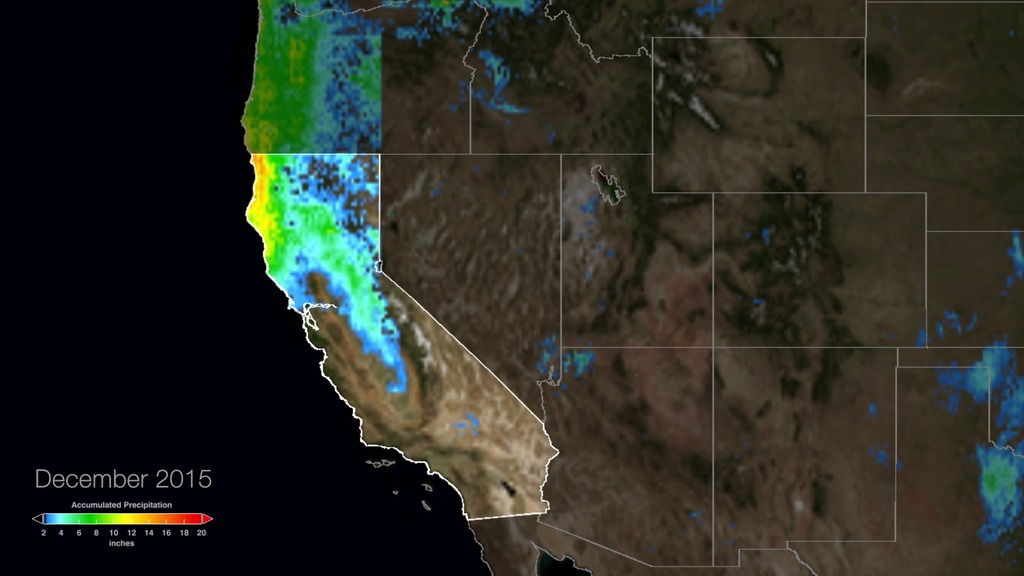
Tracking California Rains During El Niño
Go to this pageThis winter, areas across the globe experienced a shift in rain patterns due to the natural weather phenomenon known as El Niño. New NASA visualizations of rainfall data show the various changes to California.According to the National Oceanic and Atmospheric Administration, El Niño was expected to produce wetter-than-average conditions from December 2015 to February 2016. Scientists refer to historical weather patterns and to look at trends of where precipitation normally occurs during El Niño events. Also, several factors—not just El Niño—can contribute to unusual weather pattern. ||
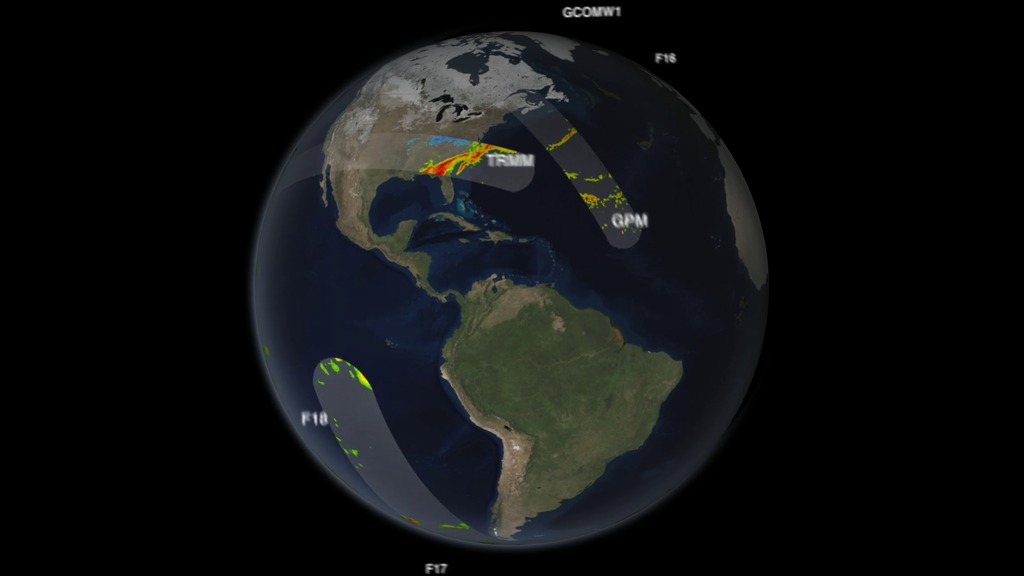
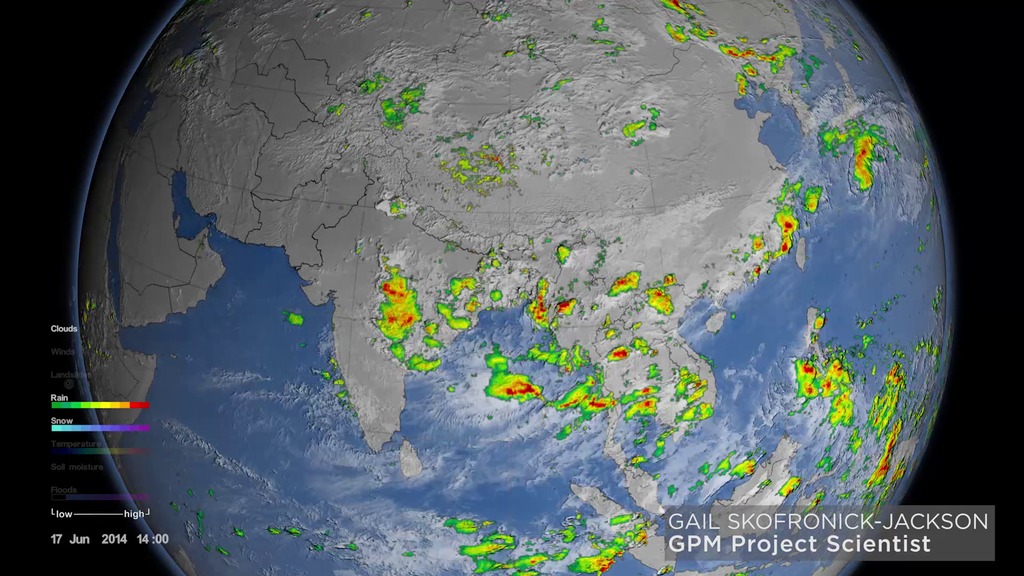
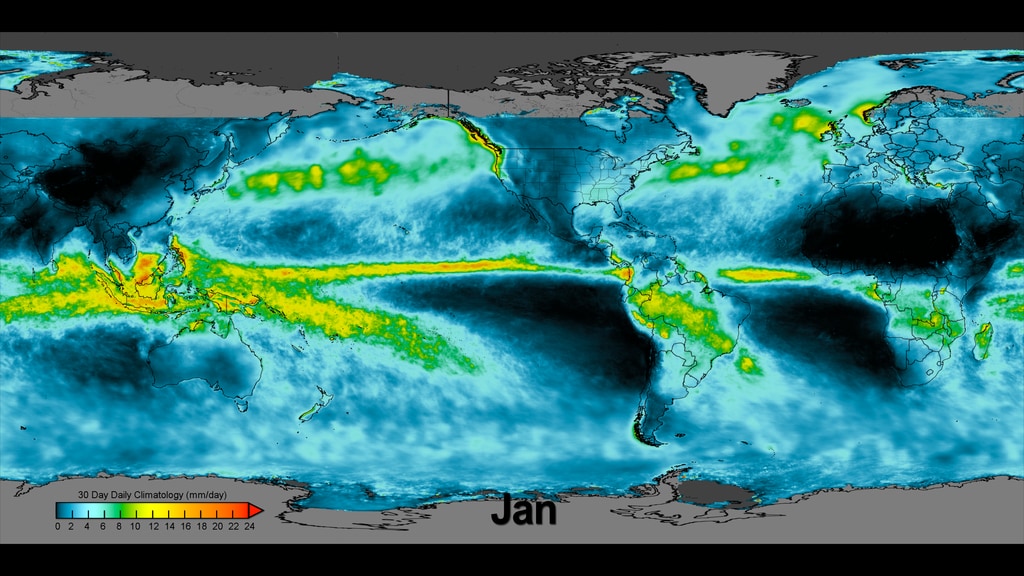
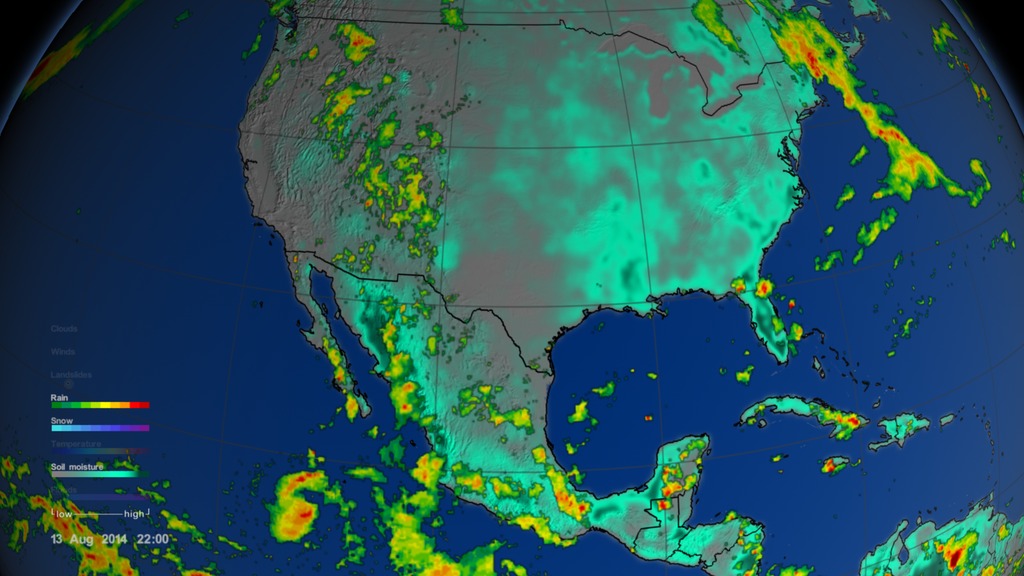
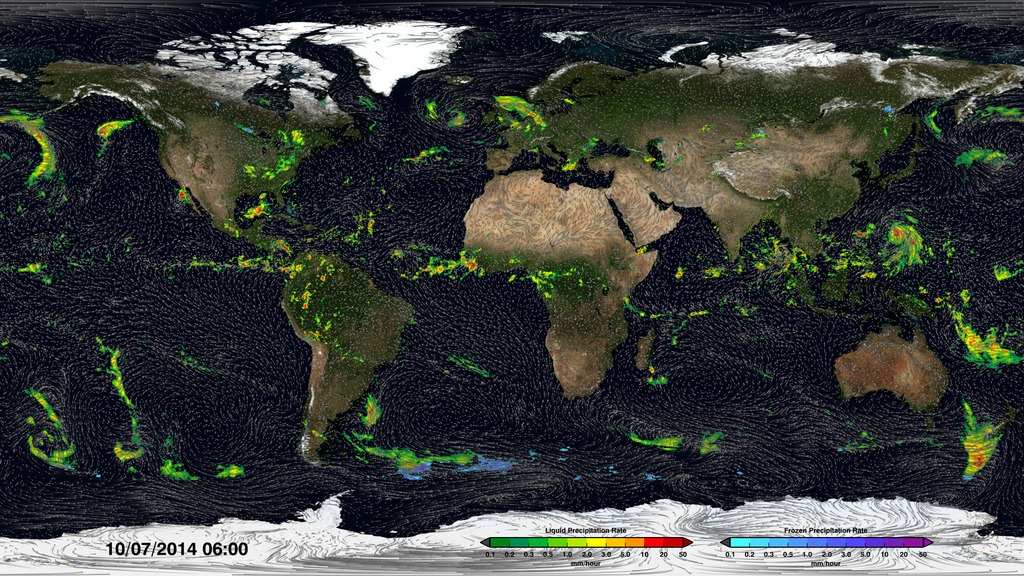
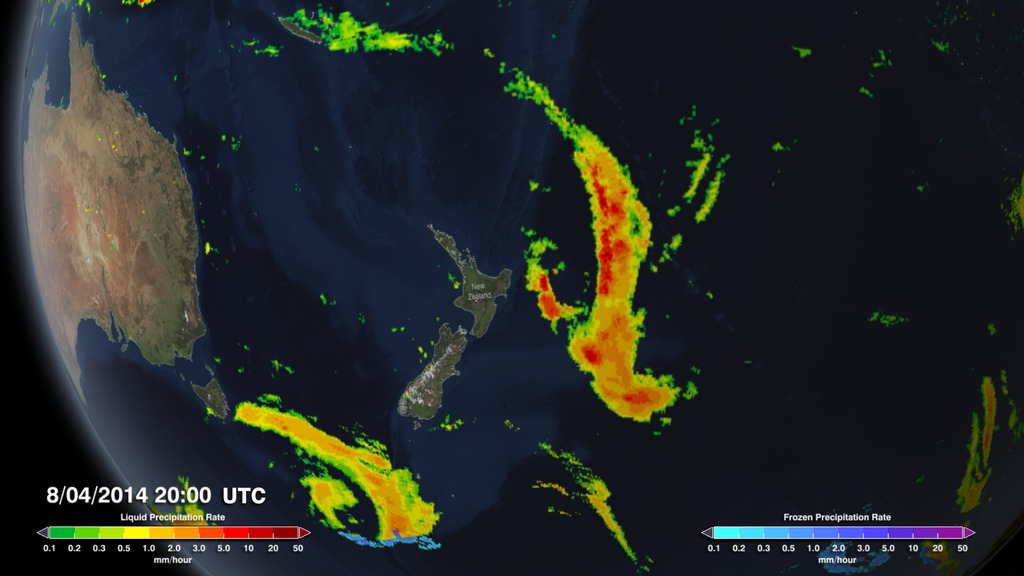
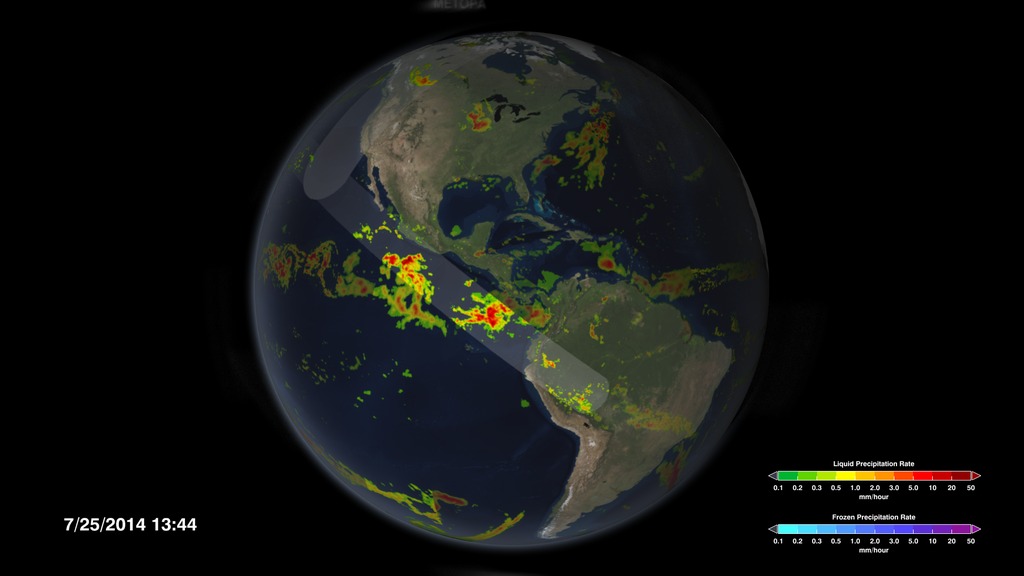
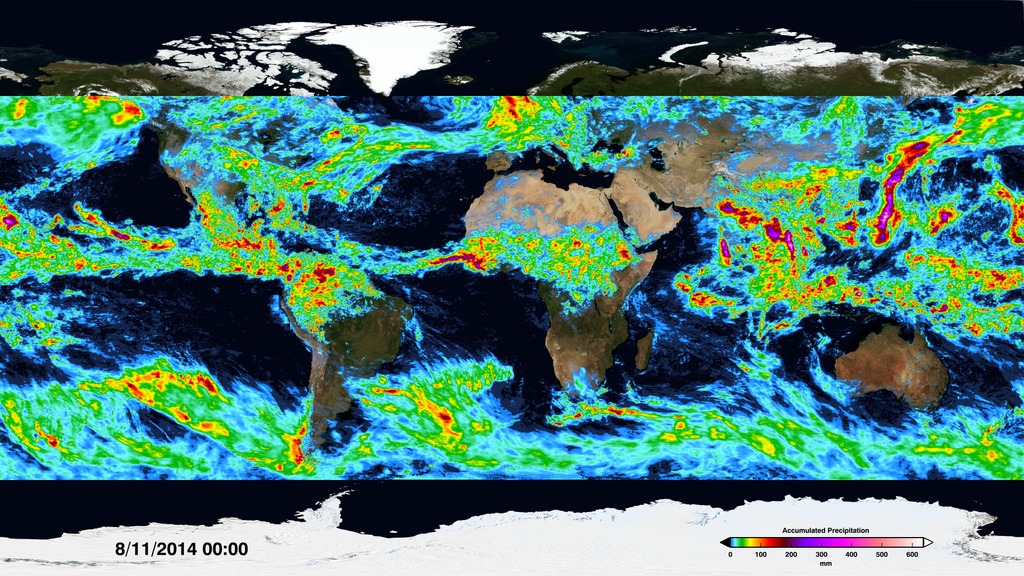
IMERG Visualizations
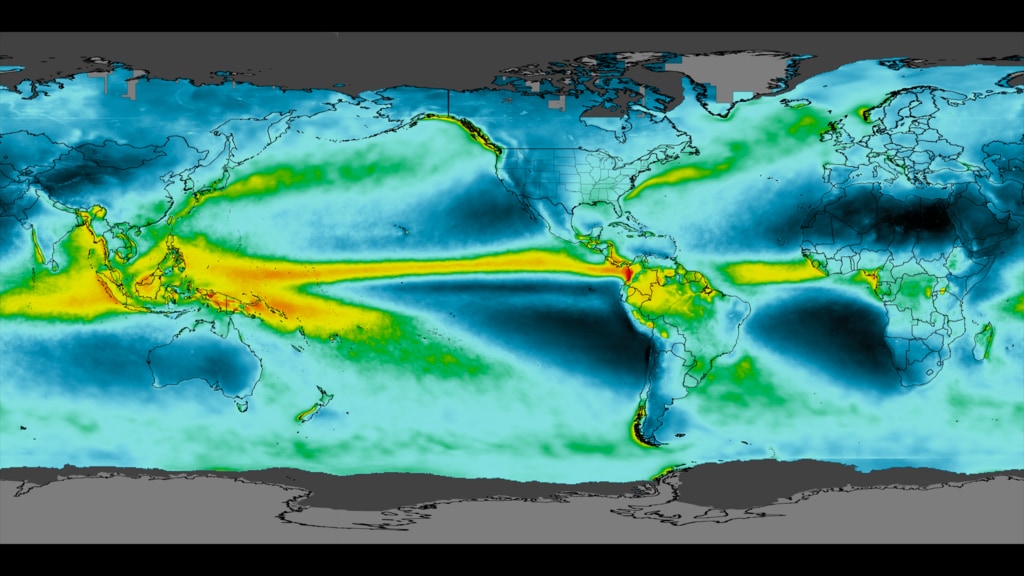
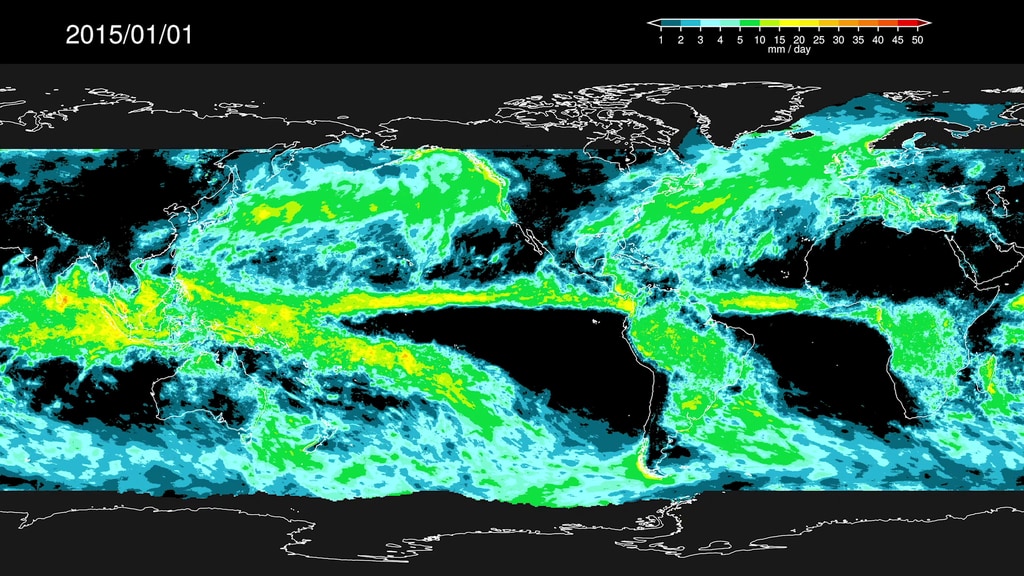
The satellites in the Global Precipitation Measurement Constellation provide unprecedented information about the rain and snow across the entire Earth. These visualizations show the constellation in action, taking precipitation measurements underneath the satellite orbits. As time progresses and the Earth's surface is covered with measurements, the structure of the Earth's preciptation becomes clearer, from the constant rainfall patterns along the Equator to the storm fronts in the mid-latitudes.
- ID: 5018
 Visualization
 - ID: 4815
 Visualization
 - ID: 4759
 Visualization
 - ID: 4760
 Visualization
 - ID: 13346
 Produced Video
 - ID: 13347
 Produced Video
 - ID: 4555
 Visualization
 - ID: 4547
 Visualization
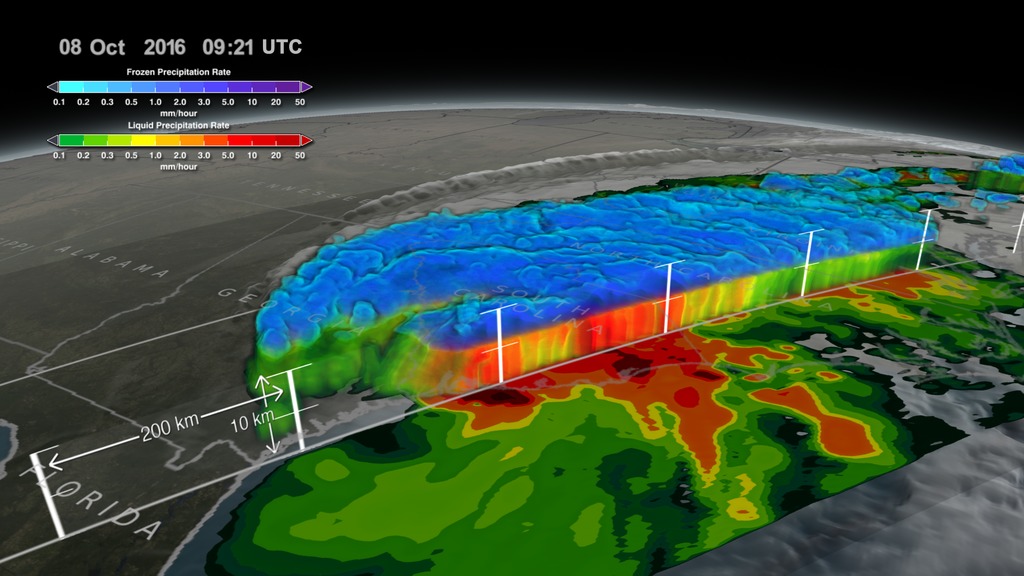
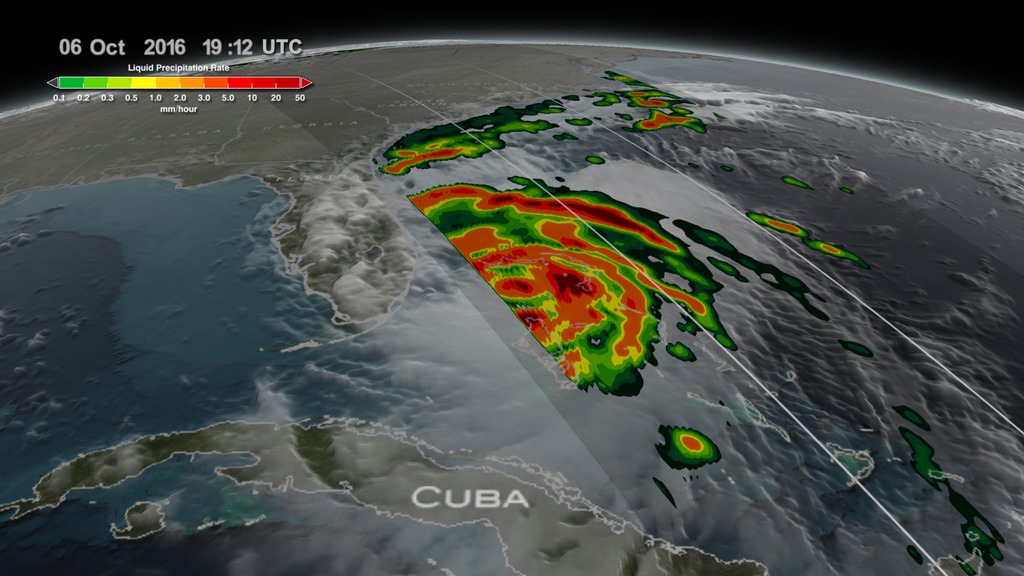
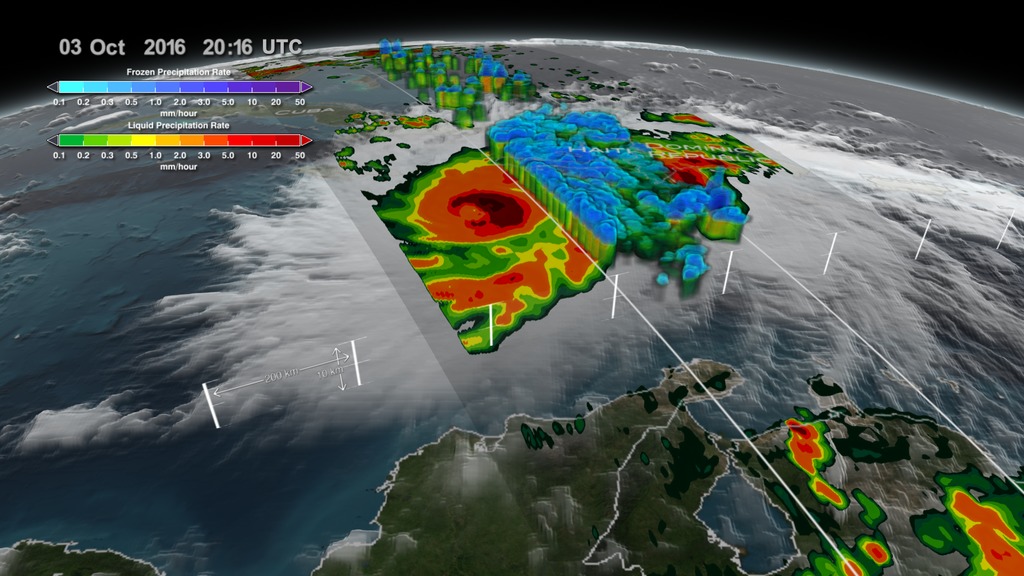
 ![NASA’s Global Precipitation Measurement Mission or GPM core satellite captured Hurricane Matthew in 3-D as it made landfall on Haiti and as it travelled up to the Florida coast. GPM flew directly over the storm several times between October 2 - October 6, 2016. The most recent view on October 6 reveals massive amounts of rainfall being produced by the storm as it approaches Florida.The GPM core satellite carries two instruments that show the location and intensity of rain and snow, which defines a crucial part of the storm structure – and how it will behave. The GPM Microwave Imager sees through the tops of clouds to observe how much and where precipitation occurs, and the Dual-frequency Precipitation Radar observes precise details of precipitation in 3-dimensions.For more information about the science behind Hurricane Matthew visit: http://www.nasa.gov/matthewFor the latest storm warnings and safety information please consult your local news channels and the National Hurricane Center: http://www.nhc.noaa.gov/Video credit: NASA's Goddard Space Flight Center/Joy NgMusic credit: Diamond Skies by Andrew Skeet [PRS], Anthony Phillips [PRS] from the KillerTracks catalog](/vis/a010000/a012300/a012389/LARGE_MP4-12389_Hurricane_Matthew_IMERG_CloseUp_WithColorBar_large.00539_searchweb.png)
- ID: 4490

- ID: 4473
- ID: 4474
 Visualization
 - ID: 4443
 Visualization
 - ID: 4432
- ID: 4382
 Visualization
 - ID: 4359
 Visualization
 - ID: 4334
 Visualization
 - ID: 4337
- ID: 4304
- ID: 4305
- ID: 4290
 Visualization
 - ID: 4291
 Visualization
 - ID: 4297
- ID: 4292
- ID: 4283
 Visualization
 - ID: 4284
- ID: 4286
 Visualization
 - ID: 4296
 Visualization
 - ID: 4298
- ID: 4294
 Visualization
 - ID: 4299
- ID: 4295
 Visualization
 - ID: 4300
 Visualization
 - ID: 4293
 Visualization
 - ID: 11784
 Produced Video
 - ID: 11829
 Produced Video
GPM Applications
Videos focusing on the application of GPM data around the world.
- ID: 13646 Produced Video

NASA Satellites Help Farmers in Central America's Dry Corridor
Go to this pageMusic: "Beautiful Serenity," Samuel Karl Bohn & Anthony Phillips, Universal Production Music.Complete transcript available. || Elsalvador_thumb_print.jpg (1024x570) [271.1 KB] || Elsalvador_thumb_searchweb.png (320x180) [151.0 KB] || Elsalvador_thumb_thm.png (80x40) [11.9 KB] || ElSalvador_Twitter.mp4 (1920x1080) [43.5 MB] || ElSalvador_prores.mov (1920x1080) [2.7 GB] || ElSalvador_YouTube.mp4 (1920x1080) [325.4 MB] || ElSalvador_prores.webm (1920x1080) [27.3 MB] || elsalvador.en_US.srt [3.6 KB] || elsalvador.en_US.vtt [3.6 KB] ||
- ID: 13592 Produced Video
![Complete transcript available.Music credits: “Billy” by Rob Jager [BUMA]; “Perfect Space” by Anthony Edwin Phillips [PRS], Samuel Karl Bohn [PRS]; “Games Show Spheres 07” by Anselm Kreuzer [GEMA]; “Hope Will Save Us” by Christopher John Hutchings [PRS]
Additional imagery credit: University of Washington Watch this video on the NASA Goddard YouTube channel.](/vis/a010000/a013500/a013592/13592_FarmersGPM_YouTube.00001_print.jpg)
Guiding Farmers with NASA Satellites
Go to this pageAgriculture in Pakistan is dependent on irrigation from the Indus River, but over the years, these freshwater resources have become scarce. Today, it is one of the world’s most depleted basins. To tackle this, farmers are attempting to predict and track freshwater resources with the help of NASA satellites and cell phones. ||
- ID: 12667 Produced Video

NASA Rainfall Data and Global Fire Weather
Go to this pageAdditional footage courtesy of Greenpeace.Music: "Vulnerable Moment," John Ashton Thomas, Atmosphere Music Ltd.; "Inducing Waves," Ben Niblett and Jon Cotton, Atmosphere Music Ltd.Complete transcript available. || fires_thumb_print.jpg (1024x578) [88.2 KB] || fires_thumb_searchweb.png (320x180) [93.8 KB] || fires_thumb_thm.png (80x40) [7.0 KB] || Fires_GPM_prores.mov (1920x1080) [3.7 GB] || Fires_GPM_facebook_720.mp4 (1280x720) [385.5 MB] || Fires_GPM_large.mp4 (1920x1080) [271.4 MB] || Fires_GPM_twitter_720.mp4 (1280x720) [60.4 MB] || Fires_GPM_youtube_720.mp4 (1280x720) [513.6 MB] || Fires_GPM_youtube_1080.mp4 (1920x1080) [526.2 MB] || Fires_GPM_prores.webm (1920x1080) [30.3 MB] || 12667_Fires.en_US.srt [5.2 KB] || 12667_Fires.en_US.vtt [5.2 KB] ||
- ID: 12958 Produced Video

Using Precipitation Data to Assess Risk of Cholera Outbreaks
Go to this pageMusic: "A New Hope," Al Lethbridge, Atmosphere Music Ltd PRS; "Spirals within a Sphere," Adam Salkeld, Atmosphere Music Ltd PRSComplete transcript available. || cholera_still_print.jpg (1024x695) [243.6 KB] || cholera_still_searchweb.png (320x180) [119.4 KB] || cholera_still_thm.png (80x40) [7.6 KB] || 12958_Cholera_GPM_prores.mov (1920x1080) [3.1 GB] || 12958_Cholera_GPM_twitter_720.mp4 (1280x720) [54.2 MB] || 12958_Cholera_GPM_youtube_720.mp4 (1280x720) [430.0 MB] || 12958_Cholera_GPM_facebook_720.mp4 (1280x720) [337.4 MB] || 12958_Cholera_GPM_youtube_1080.mp4 (1920x1080) [490.1 MB] || 12958_Cholera_GPM_prores.webm (1920x1080) [23.6 MB] || 12958_Cholera_GPM_large.mp4 (1920x1080) [235.1 MB] || 12958_Cholera.en_US.srt [4.2 KB] || 12958_Cholera.en_US.vtt [4.2 KB] ||
- Section

New NASA Model Finds Landslide Threats in Near Real-Time During Heavy Rains
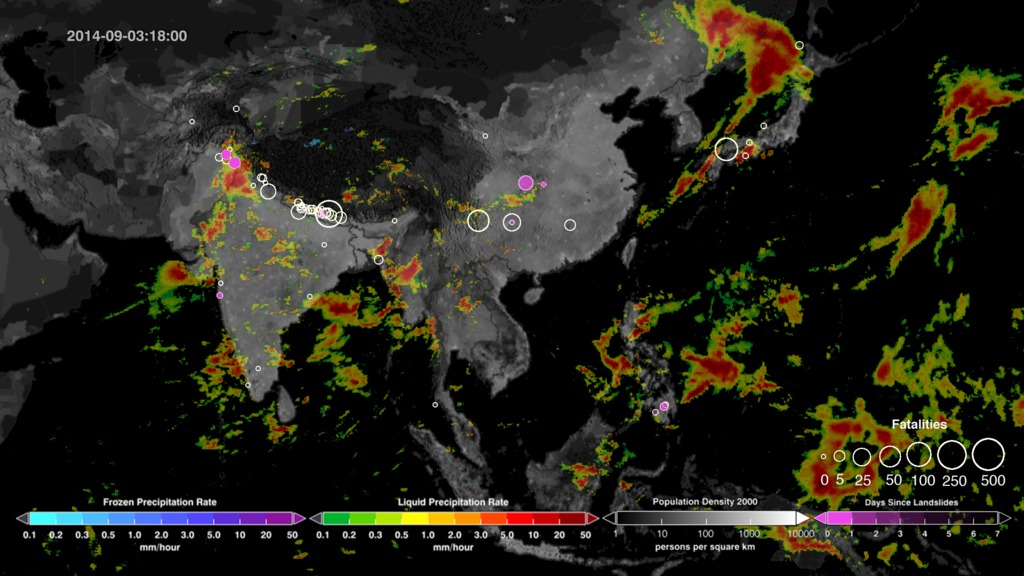
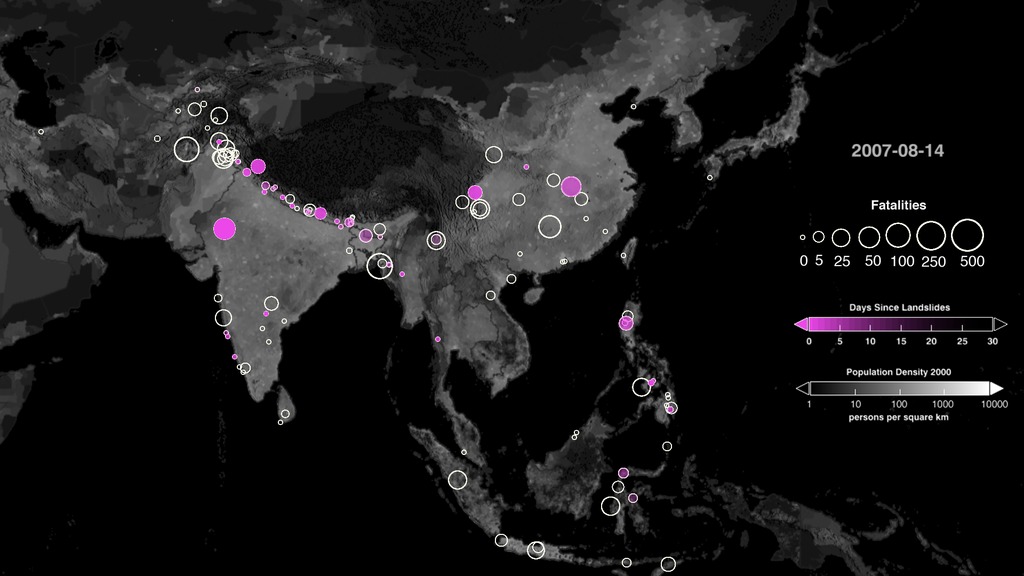
Go to this sectionA new model has been developed to look at how potential landslide activity is changing around the world. A global Landslide Hazard Assessment model for Situational Awareness (LHASA) has been developed to provide an indication of where and when landslides may be likely around the world every 30 minutes. This model uses surface susceptibility (including slope, vegetation, road networks, geology, and forest cover loss) and satellite rainfall data from the Global Precipitation Measurement (GPM) mission to provide moderate to high “nowcasts.” This visualization shows the landslide nowcast results leveraging nearly two decades of Tropical Rainfall Measurement Mission (TRMM) rainfall over 2001-2016 to identify a landslide climatology by month at a 1 km grid cell. The average nowcast values by month highlight the key landslide hotspots, such as the Southeast Asia during the monsoon season in June through August and the U.S. Pacific Northwest in December and January.
Overlaid with these nowcasts values are a Global Landslide Catalog(GLC) that was developed with the goal of identifying rainfall-triggered landslide events around the world, regardless of size, impact, or location. The GLC considers all types of mass movements triggered by rainfall, which have been reported in the media, disaster databases, scientific reports, or other sources. The visualization shows the distribution of landslides each month based on the estimated number of fatalities the event caused. The GLC has been compiled since 2007 at NASA's Goddard Space Flight Center and contains over 11,000 reports and growing. A new project called the Community the Cooperative Open Online Landslide Repository, or COOLR, provides the opportunity for the community to view landslide reports and contribute their own. The goal of the COOLR project is to create the largest global public online landslide catalog available and open to for anyone everyone to share, download, and analyze landslide information. More information on this system is available at: https://landslides.nasa.gov.
Landslides occur when an environmental trigger like an extreme rain event, often a severe storm or hurricane, and gravity's downward pull sets soil and rock in motion. Conditions beneath the surface are often unstable already, so the heavy rains act as the last straw that causes mud, rocks, or debris- or all combined- to move rapidly down mountains and hillsides. Unfortunately, people and property are often swept up in these unexpected mass movements. Landslides can also be caused by earthquakes, surface freezing and thawing, ice melt, the collapse of groundwater reservoirs, volcanic eruptions, and erosion at the base of a slope from the flow of river or ocean water. But torrential rains most commonly activate landslides. - ID: 12603 Produced Video
![Complete transcript available.Music credits: ‘Inner Confusion’ by Laurent Levesque [SACEM], ‘The Awakening’ by Benjamin Krause [GEMA], Scott Goodman [ASCAP], ‘Cellular Signals’ by Laurent Levesque [SACEM]Watch this video on the NASA Goddard YouTube channel.](/vis/a010000/a012600/a012603/LARGE_MP4-12603_PredictingMalaria_large.00183_print.jpg)
Predicting Malaria Outbreaks With NASA Satellites
Go to this pageIn the Amazon Rainforest, few animals are as dangerous to humans as mosquitos that transmit malaria. The tropical disease can bring on severe fever, headaches and chills and is particularly severe for children and the elderly and can cause complications for pregnant women. In rainforest-covered Peru the number of malaria cases has spiked such that, in the past five years, it has had on average the second highest rate in the South American continent. In 2014 and 2015 there were 65,000 reported cases in the country.Containing malaria outbreaks is challenging because it is difficult to figure out where people are contracting the disease. As a result, resources such as insecticide-treated bed nets and indoor sprays are often deployed to areas where few people are getting infected, allowing the outbreak to grow.To tackle this problem, university researchers have turned to data from NASA’s fleet of Earth-observing satellites, which are able to track the types of human and environmental events that typically precede an outbreak. With funding from NASA’s Applied Sciences Program, they are working in partnership with the Peruvian government to develop a system that uses satellite and other data to help forecast outbreaks at the household level months in advance and prevent outbreaks.Additional imagery from: Christopher B. Plunkett FortJames GathanyFábio Medeiros da Costa ||
- ID: 12635 Produced Video
A New Multi-dimensional View of a Hurricane
Go to this pageMusic: "Buoys," Donn Wilkerson, Killer Tracks; "Late Night Drive," Donn Wilkerson, Killer Tracks.Complete transcript available. || Matthew_screengrab_print.jpg (1024x574) [158.4 KB] || Matthew_screengrab_searchweb.png (320x180) [114.3 KB] || Matthew_screengrab_thm.png (80x40) [8.1 KB] || 12635_Hurricane_Matthew_prores.webm (1920x1080) [25.4 MB] || 12635_Hurricane_Matthew_twitter_720.mp4 (1280x720) [49.8 MB] || 12635_Hurricane_Matthew.mp4 (1920x1080) [236.9 MB] || 12635_Hurricane_Matthew_facebook_720.mp4 (1280x720) [271.2 MB] || 12635_Hurricane_Matthew_prores_youtube_720.mp4 (1280x720) [362.8 MB] || 12635_Hurricane_Matthew_youtube_1080.mp4 (1920x1080) [362.9 MB] || 12635_Hurricane_Matthew.en_US.srt [4.1 KB] || 12635_Hurricane_Matthew.en_US.vtt [4.1 KB] || 12635_Hurricane_Matthew_prores.mov (1920x1080) [3.0 GB] ||
- ID: 12206 Produced Video

Hurricane Forecasts Rely on Modeling the Past
Go to this pageComplete transcript available.Music: Chris White, Afterglow || 12206_Hurricanes_youtube.00229_print.jpg (1024x576) [119.1 KB] || 12206_Hurricanes_youtube.00229_searchweb.png (180x320) [87.4 KB] || 12206_Hurricanes_youtube.00229_thm.png (80x40) [6.6 KB] || 12206_Hurricane_modeling_MASTER.webm (960x540) [72.0 MB] || Hurricane_modeling.webm (1080x606) [34.9 MB] || 12206_Hurricanes_youtube.mp4 (1920x1080) [190.4 MB] || 12206_Hurricane_modeling_MASTER.mpeg (1280x720) [610.1 MB] || 12206_Hurricanes.en_US.srt [3.8 KB] || 12206_Hurricanes.en_US.vtt [3.8 KB] || 12206_Hurricane_modeling_MASTER_ipod_sm.mp4 (320x240) [32.3 MB] || Hurricane_modeling_prores.mov (1920x1080) [2.5 GB] ||
- ID: 11091 Produced Video
GPM Applications
Go to this pageWater is fundamental to life on Earth. Knowing where and how much rain and snow falls globally is vital to understanding how weather and climate impact both our environment and Earth's water and energy cycles, including effects on agriculture, fresh water availability, and responses to natural disasters. Since rainfall and snowfall vary greatly from place to place and over time, satellites can provide more uniform observations of rain and snow around the globe than ground instruments, especially in areas where surface measurements are difficult. GPM's next-generation global precipitation data will lead to scientific advances and societal benefits in the following areas: Improved knowledge of the Earth's water cycle and its link to climate change New insights into precipitation microphysics, storm structures and large-scale atmospheric processes Better understanding of climate sensitivity and feedback processes Extended capabilities in monitoring and predicting hurricanes and other extreme weather events Improved forecasting capabilities for natural hazards, including floods, droughts and landslides. Enhanced numerical prediction skills for weather and climate Better agricultural crop forecasting and monitoring of freshwater resources.For more information and resources please visit the Precipitation Measurement Missions web site. ||
Video Features
Produced web shorts on science topics, engineering features, and team member profiles.
- ID: 14617
 Produced Video
 - ID: 14312
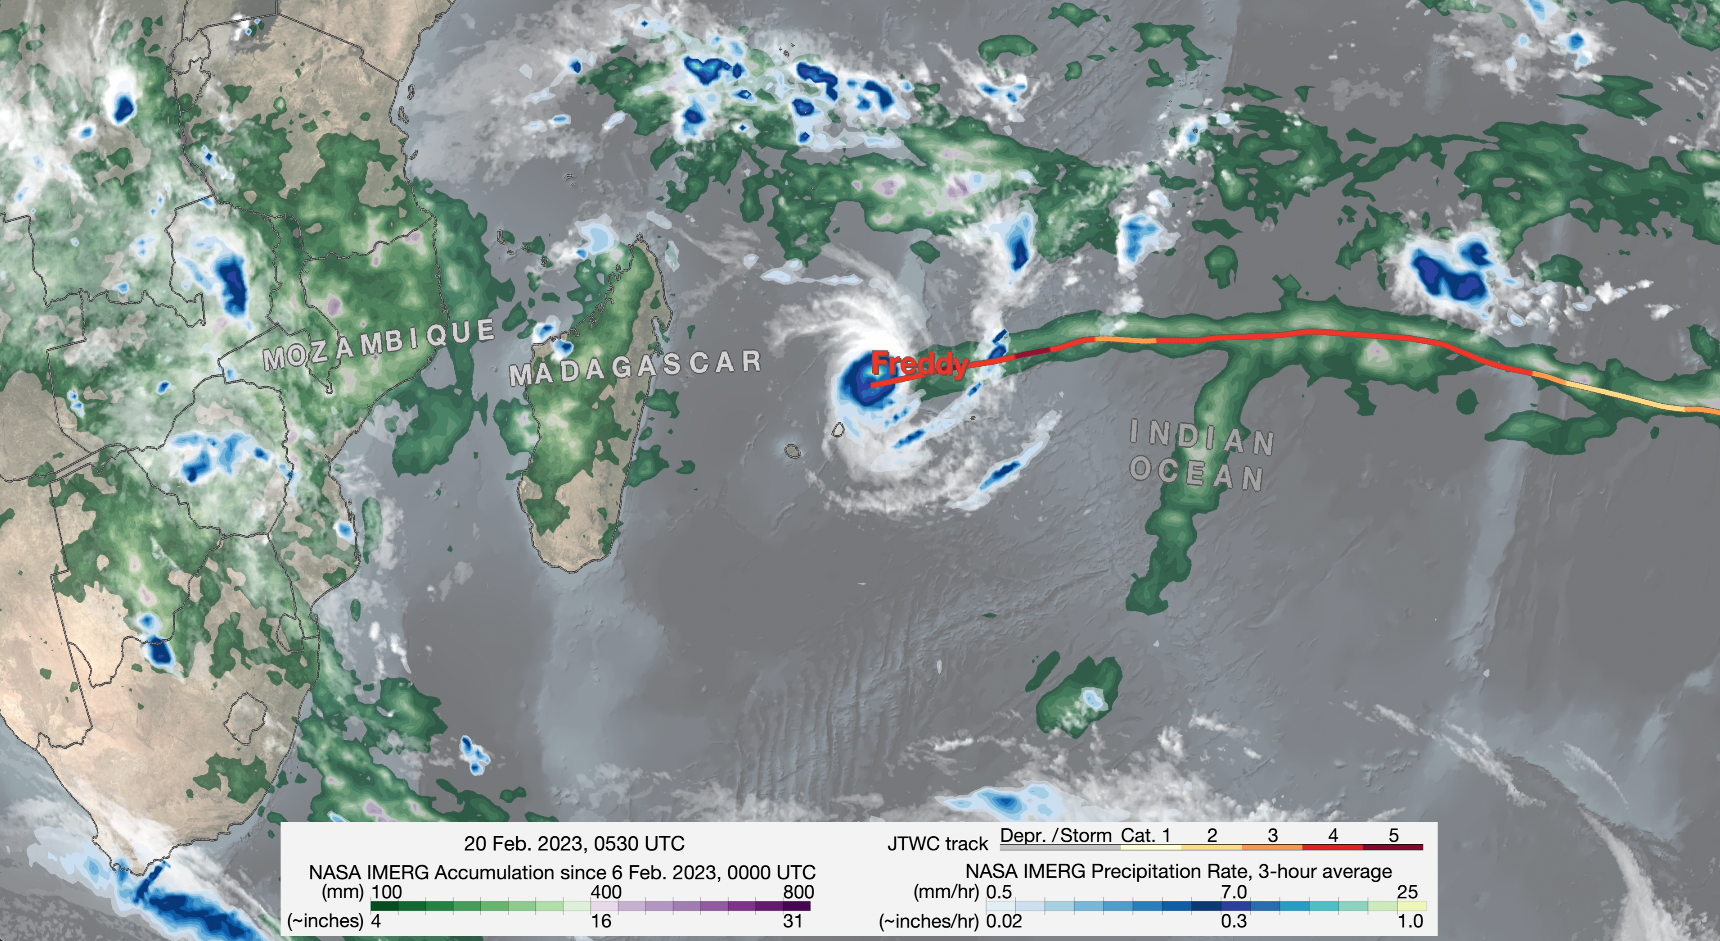 Produced Video
 - ID: 13909
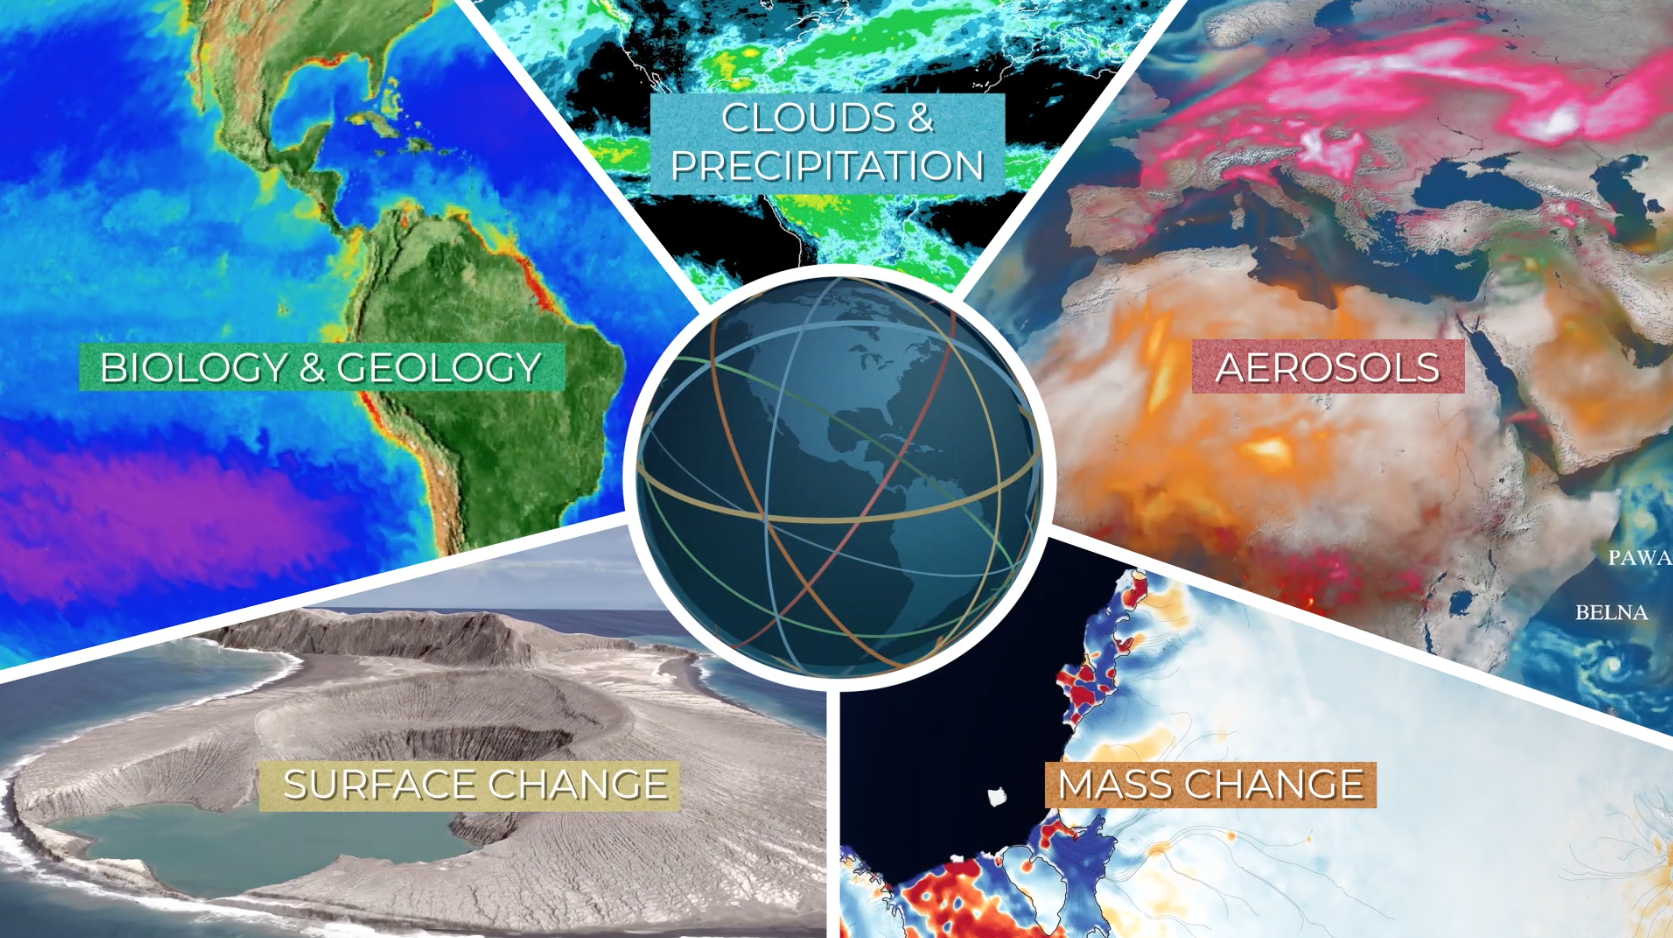 Produced Video
 - ID: 13345
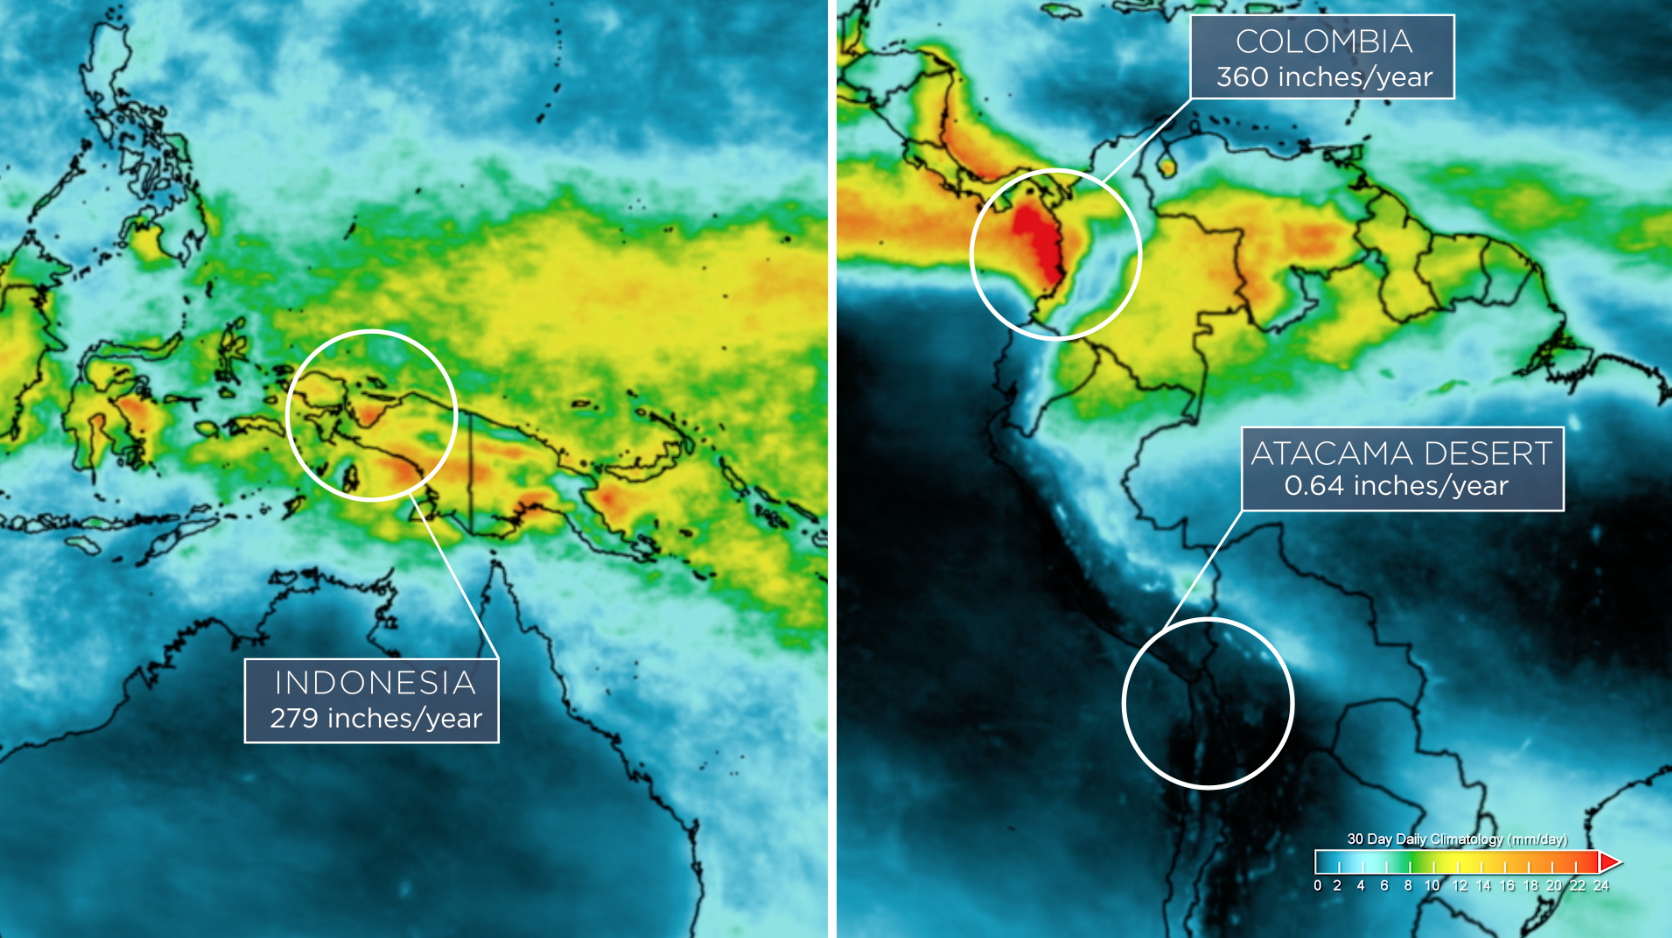 Produced Video
 - ID: 13348
![Complete transcript available.Music Credits: "Battle For Our Future" and "Wonderful Orbit" by Tom Furse Fairfax Cowan [PRS], "Transitions" by Ben Niblett [PRS] and Jon Cotton [PRS], "Emerging Discovery by "Rik Carter [PRS] from Killer Tracks](/vis/a010000/a013300/a013348/13348_DailyCycleOfRain_YouTube.00561_print.jpg) Produced Video
Produced Video - ID: 13216
![Complete transcript available.Music credits: “Northern Breeze” by Denis Levaillant [SACEM], “Stunning Horizon” by Maxime Lebidois [SACEM], Ronan Maillard [SACEM], “Magnetic Force” by JC Lemay [SACEM] from Killer TracksWatch this video on the NASA Goddard YouTube channel.This video can be freely shared and downloaded. While the video in its entirety can be shared without permission, some individual imagery provided by pond5.com is obtained through permission and may not be excised or remixed in other products. Specific details on stock footage may be found here. For more information on NASA’s media guidelines, visit https://www.nasa.gov/multimedia/guidelines/index.html.Notes on footage:• 0:03 - 0:17 provided by Pond5• 1:38 - 1.43 provided by Pond5• 1:49 - 1:52 provided by Pond5• 2:21 - 1:27 provided by Pond5](/vis/a010000/a013200/a013216/13216_NASA_Has_Eyes_On_The_Atlantic_Hurricane_Season_YouTube.00050_print.jpg) Produced Video
Produced Video - ID: 13151
 Produced Video
 - ID: 12126
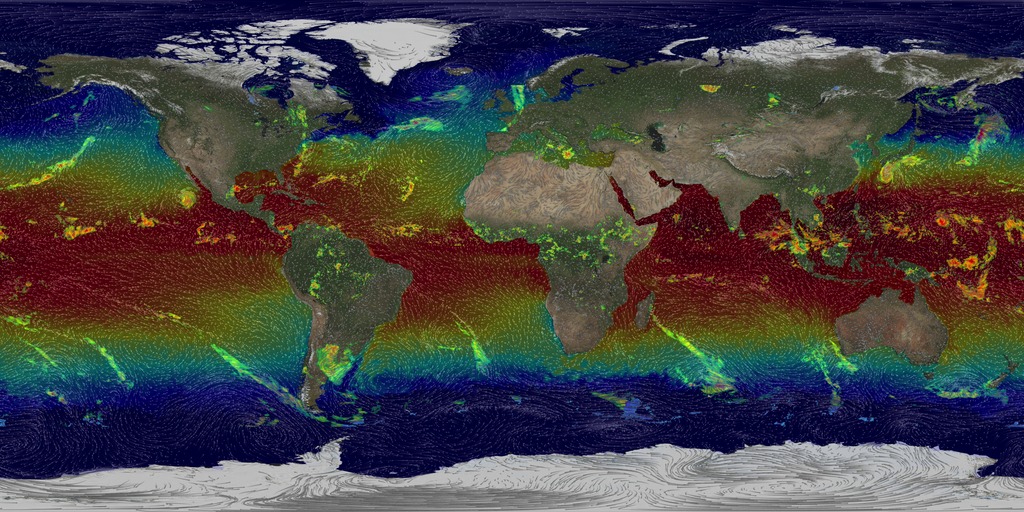
- ID: 12182
 Produced Video
 - ID: 12099
 Produced Video
 - ID: 11877
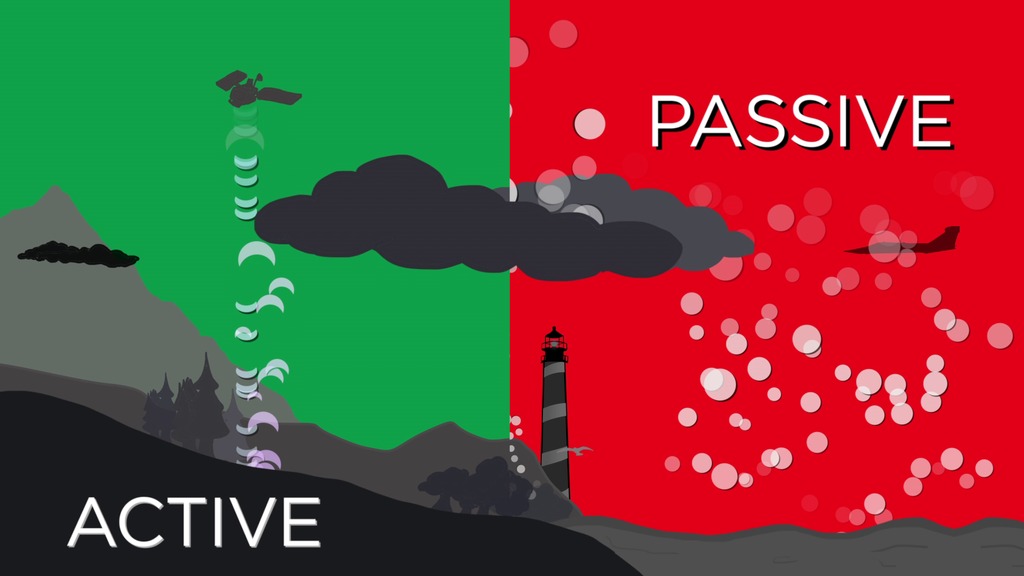 Produced Video
 - ID: 11764
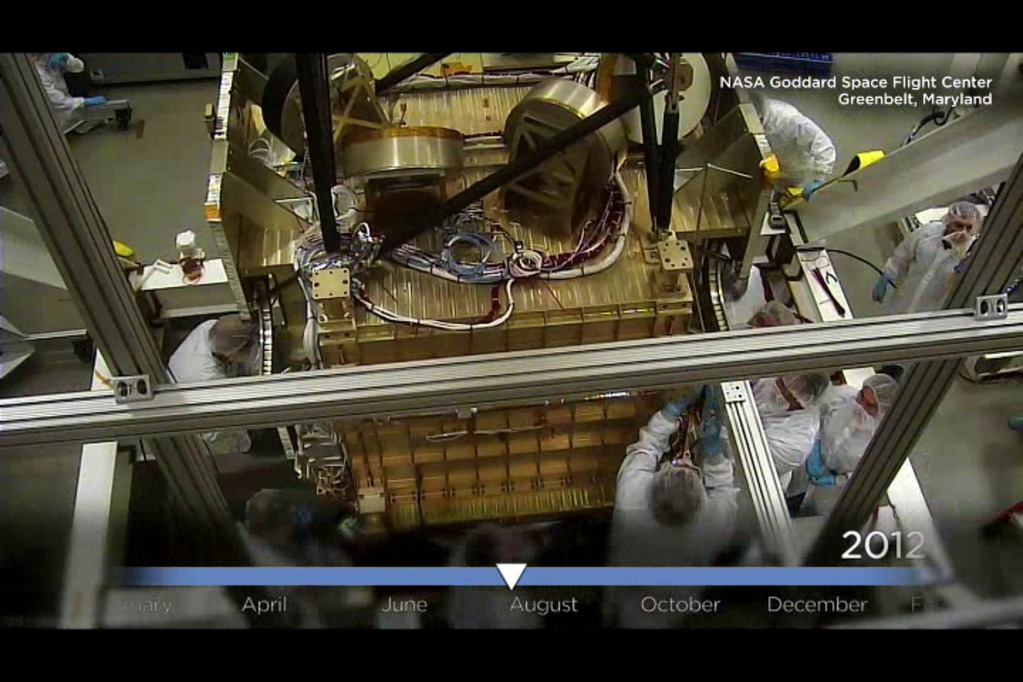 Produced Video
 - ID: 11431
 Produced Video
 - ID: 11619
 Produced Video
 - ID: 11508
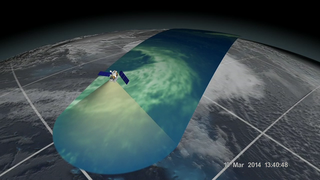 Produced Video
 - ID: 10786
 Produced Video
 - ID: 11439
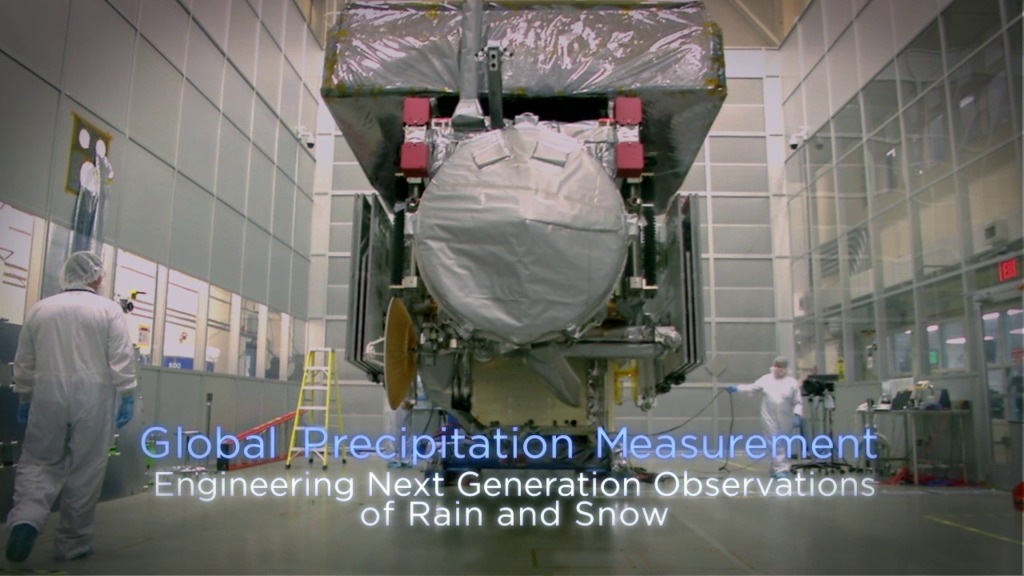 Produced Video
 - ID: 11288
 Produced Video
 - ID: 11333
 Produced Video
 - ID: 11219
 Produced Video
 - ID: 11221
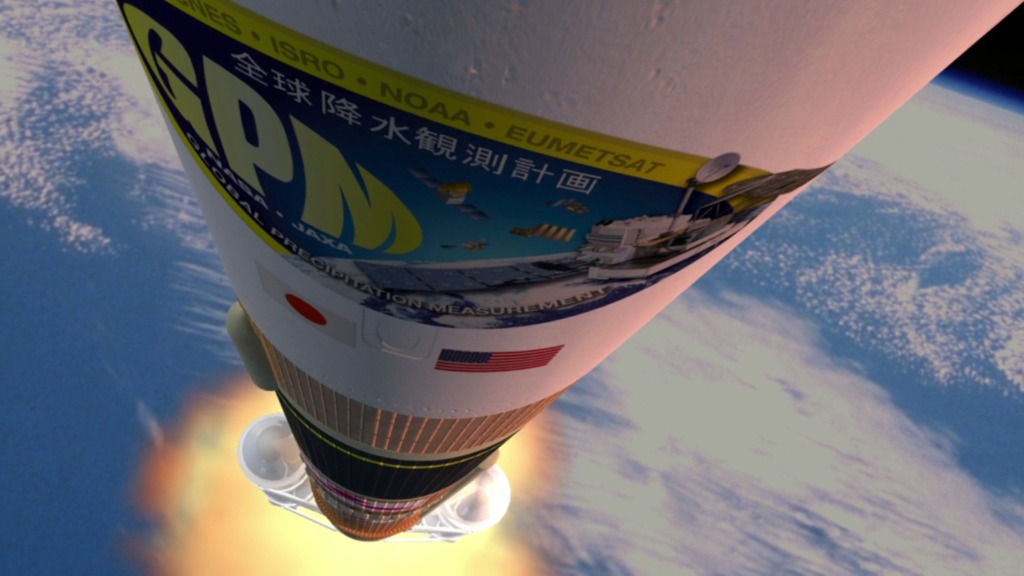 Produced Video
 - ID: 11134
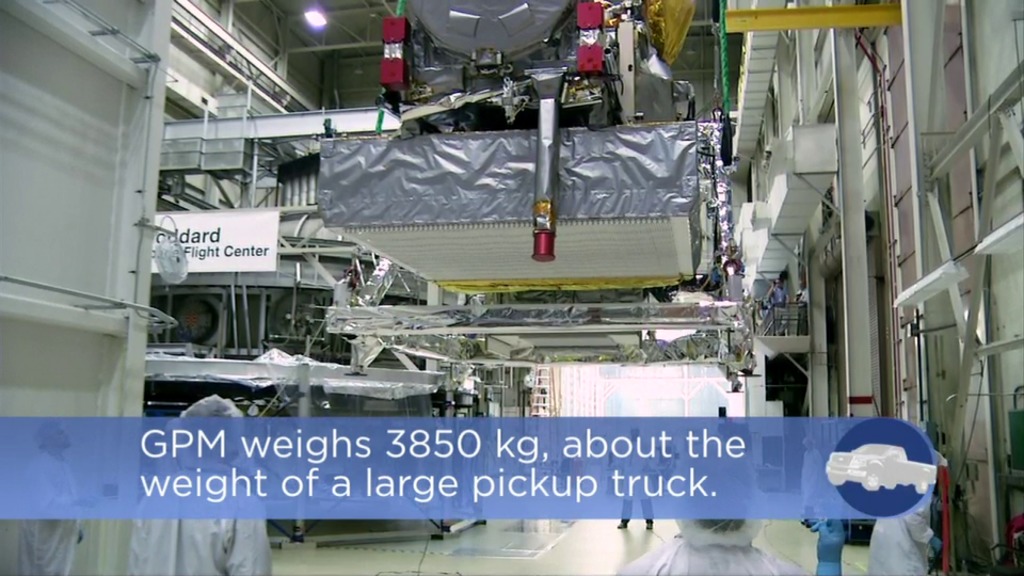 Produced Video
 - ID: 11154
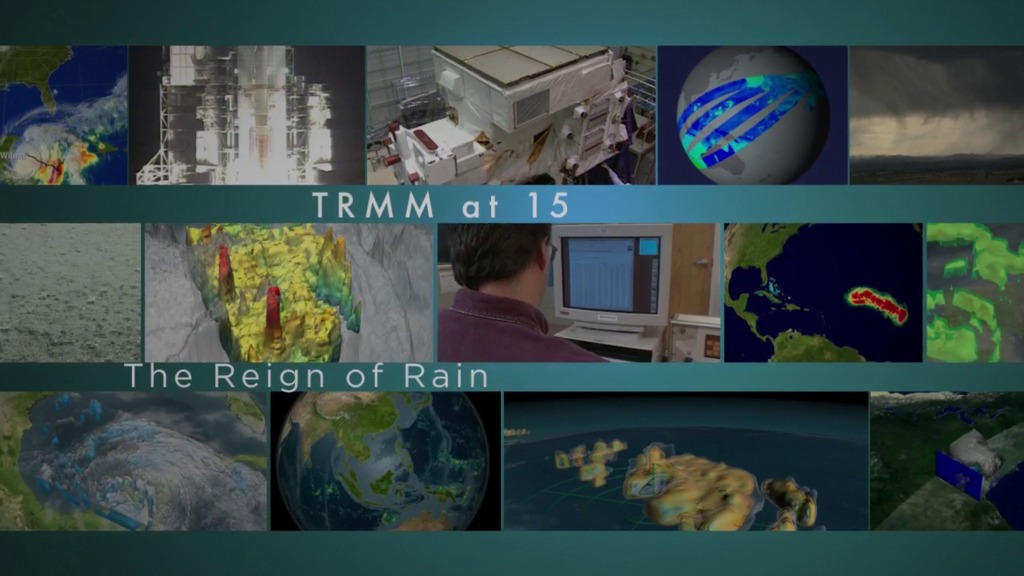 Produced Video
 - ID: 10989
 Produced Video
 - ID: 10940
 Produced Video
Live Broadcasts
Archives of live broadcast events.
- ID: 13212 Produced Video
NASA Science Live: Storms Across the Solar System (Episode 04)
Go to this pageNASA Science Live: Storms Across the Solar SystemProgram Aired May 22, 2019 || 13212_NSL_Ep4_youtube_720.00001_print.jpg (1024x576) [83.3 KB] || 13212_NSL_Ep4_youtube_720.00001_searchweb.png (320x180) [81.7 KB] || 13212_NSL_Ep4_youtube_720.00001_thm.png (80x40) [5.7 KB] || 13212_NSL_Ep4_lowres.mp4 (1280x720) [551.2 MB] || 13212_NSL_Ep4_youtube_720.mp4 (1280x720) [3.1 GB] || 13212_NSL_Ep4.mov (1280x720) [19.4 GB] || 13212_NSL_Ep4.webm (960x540) [824.7 MB] || 13212_NSL_Ep4.mov.en_US.srt [69.0 KB] || 13212_NSL_Ep4.mov.en_US.vtt [65.1 KB] ||
 Link
LinkHurricane Matthew Live
We’re talking about the science behind Hurricane Matthew using NASA satellite observations from space. NASA’s Global Precipitation Measurement Mission or GPM core satellite saw tremendous amounts of rainfall throughout Haiti. GPM has now captured Matthew near the Florida coast undergoing an eyewall replacement cycle, a process that may re-intensify the storm.
Go to this link Link
LinkExtreme Rainfall Live
Ever wonder where in the world we get the most extreme rainfall (and how we know)? Or if climate change is going to cause more frequent and intense hurricanes? Join NASA scientists for a live discussion of how we study extreme weather from space and to get a behind-the-scenes tour of the Global Precipitation Measurement Mission Operations Center.
Go to this link
Data Visualizations
Animated sequences based on actual data and/or simulations.
- ID: 5377
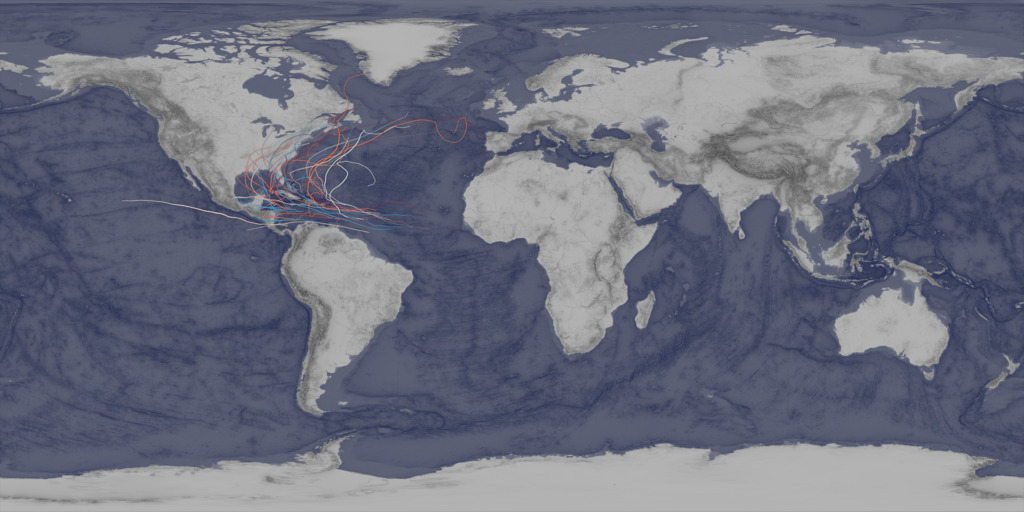 Visualization
 - ID: 5361
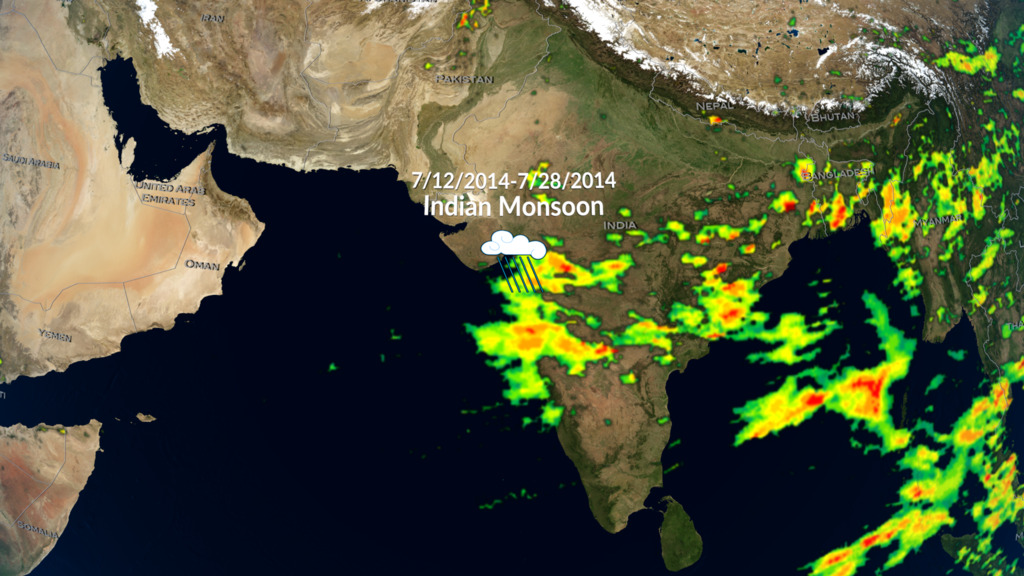 Visualization
 - ID: 4960
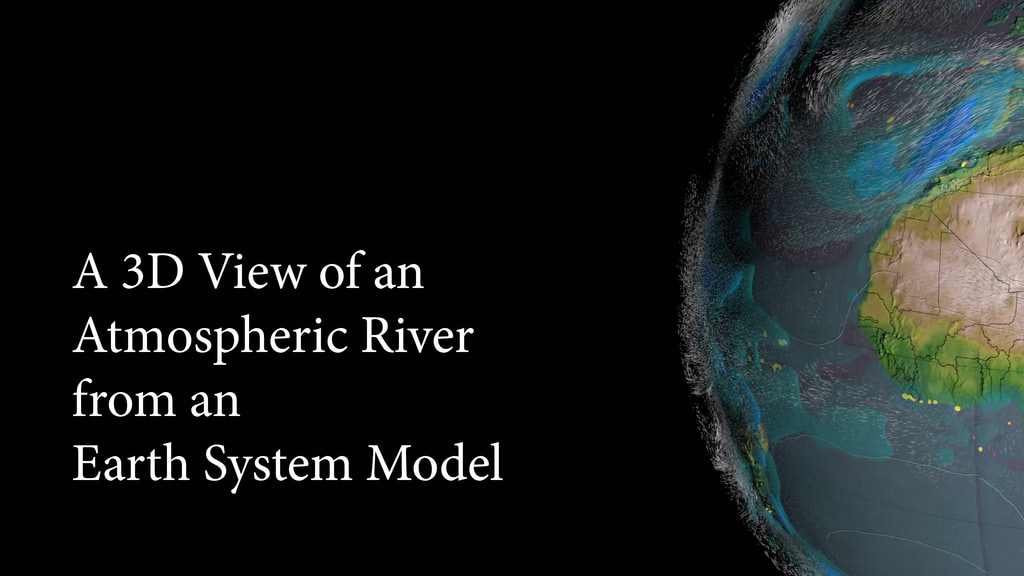
- ID: 4897
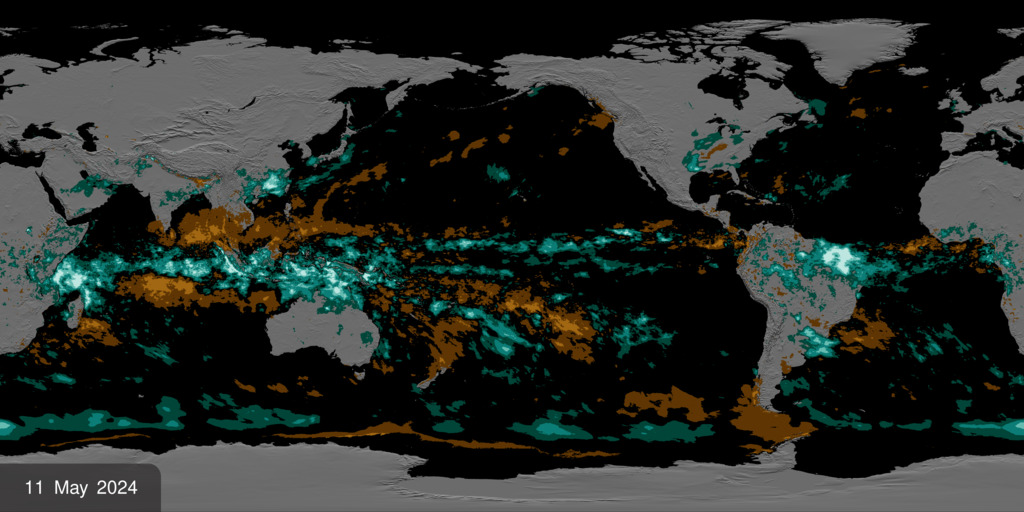
- ID: 4928
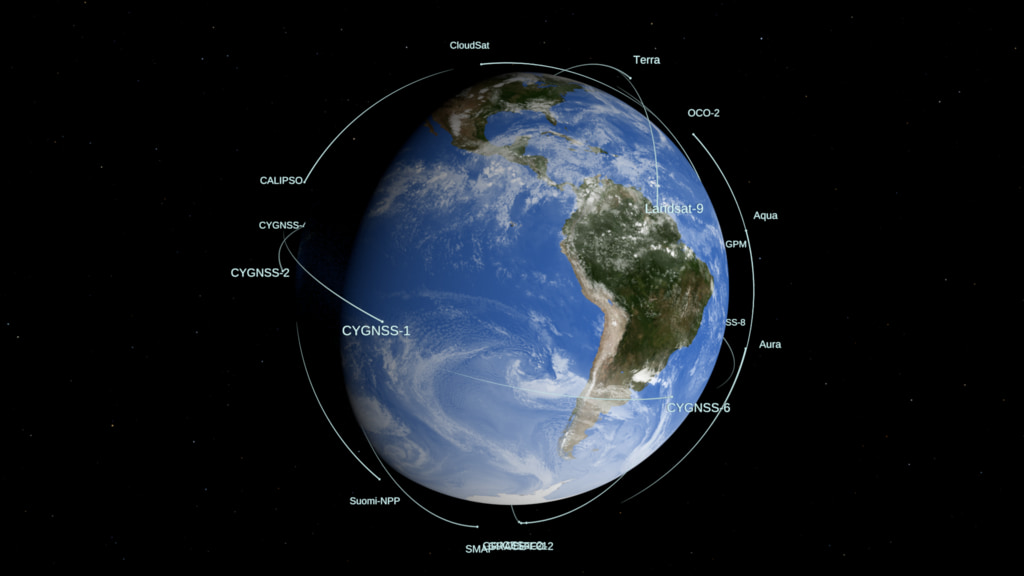 Visualization
 - ID: 4634
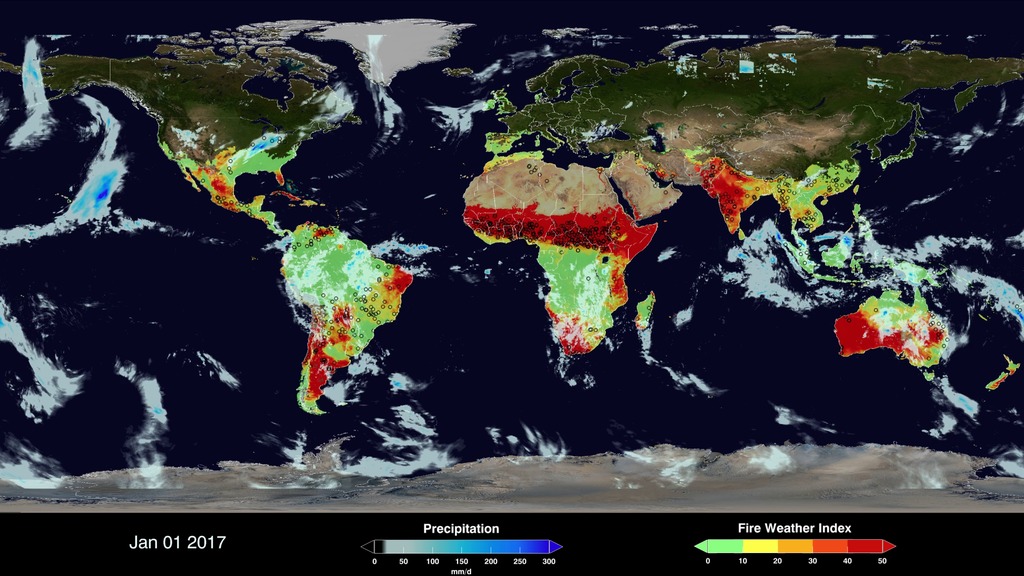 Visualization
 - ID: 4603
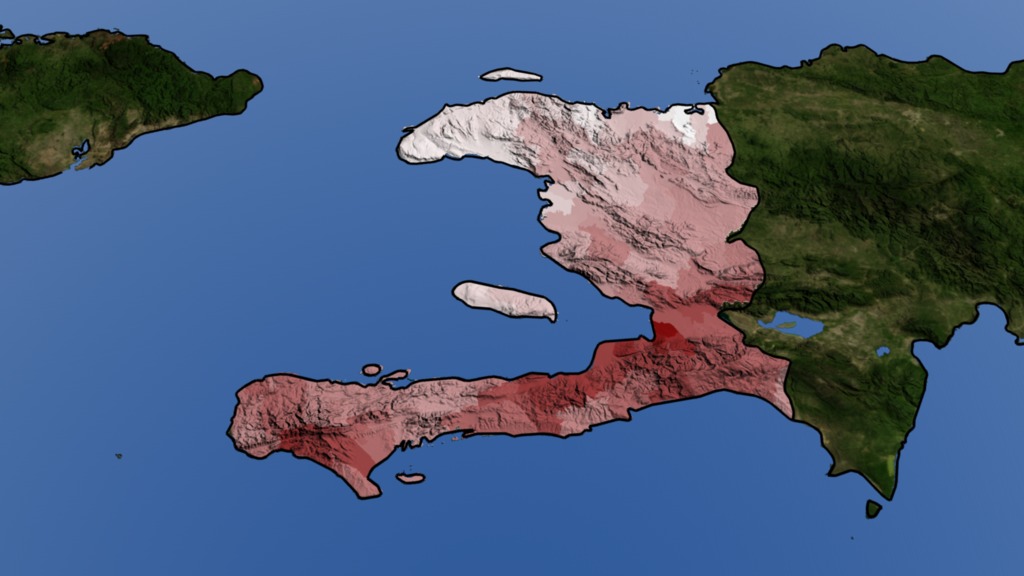 Visualization
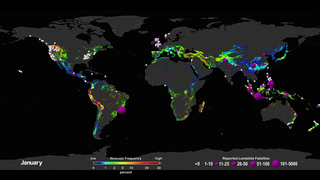
- ID: 4631
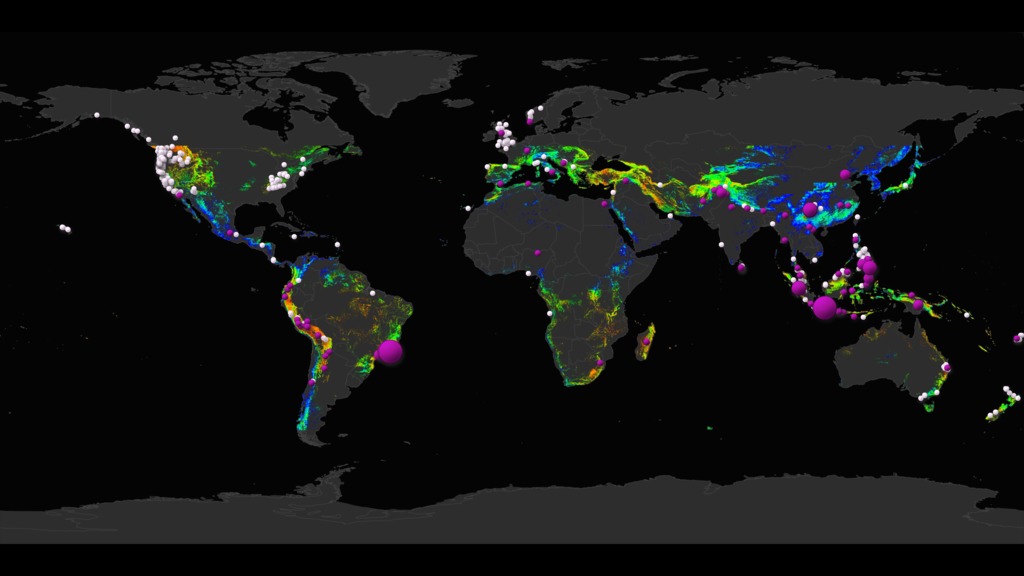
- ID: 4397
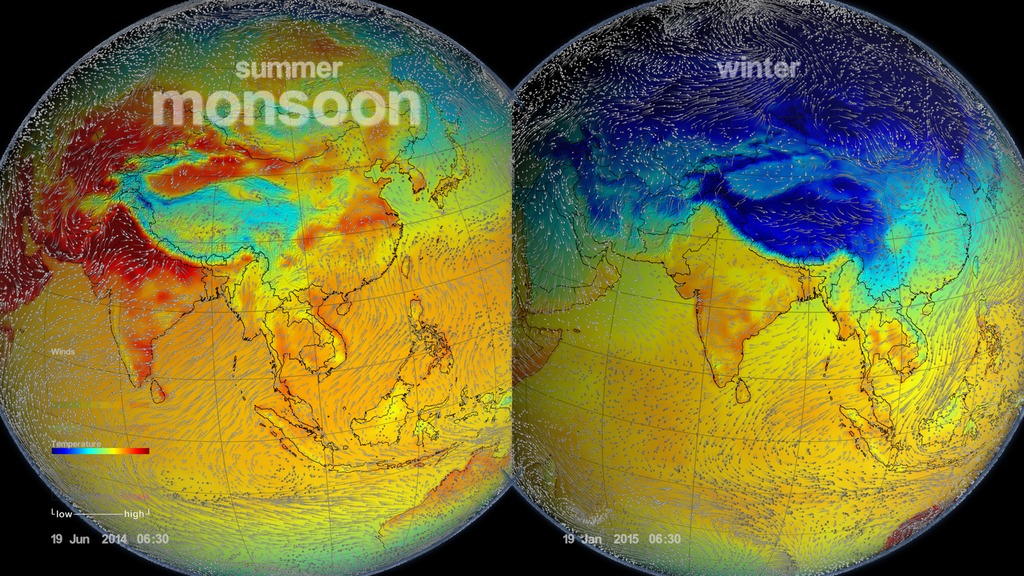 Visualization
 - ID: 4439
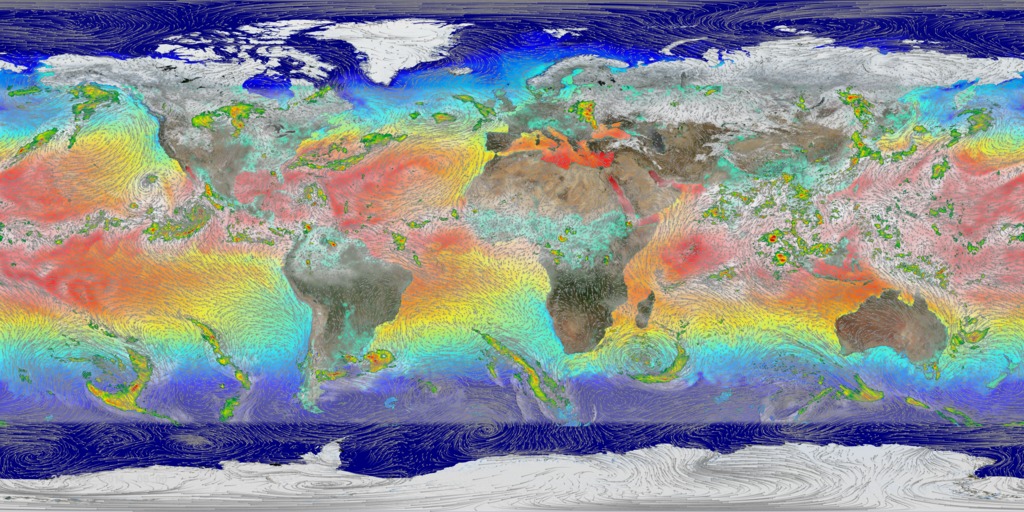
- ID: 4284
- ID: 4257
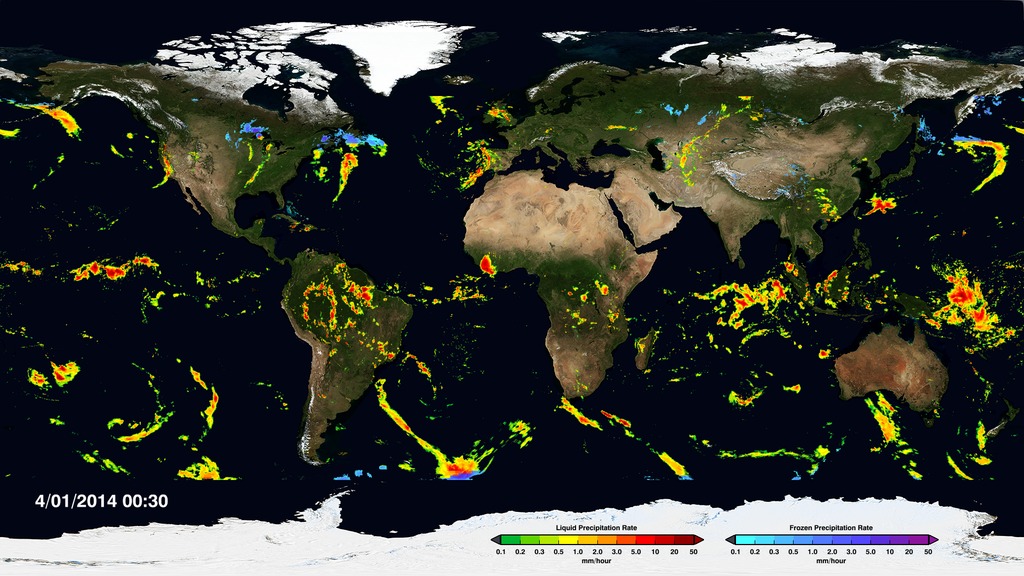 Visualization
 - ID: 4153
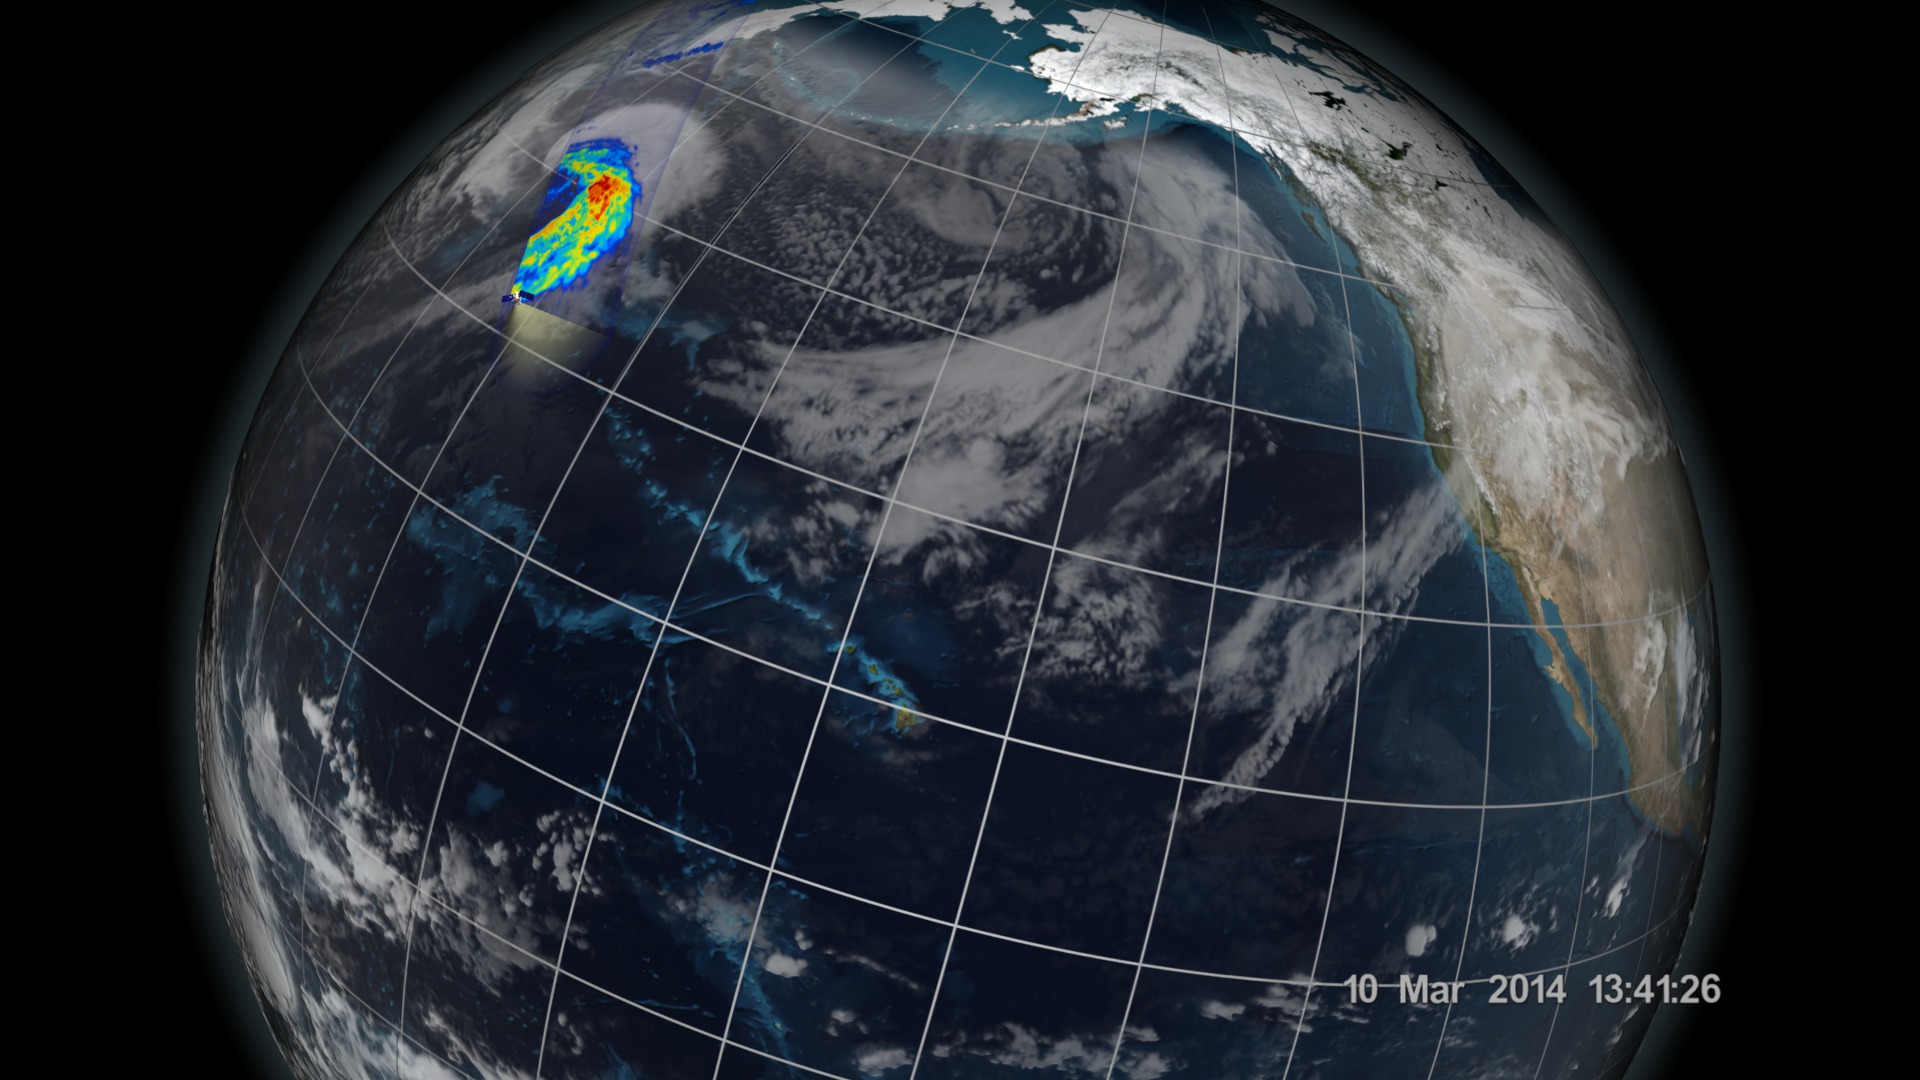 Visualization
 - ID: 11509
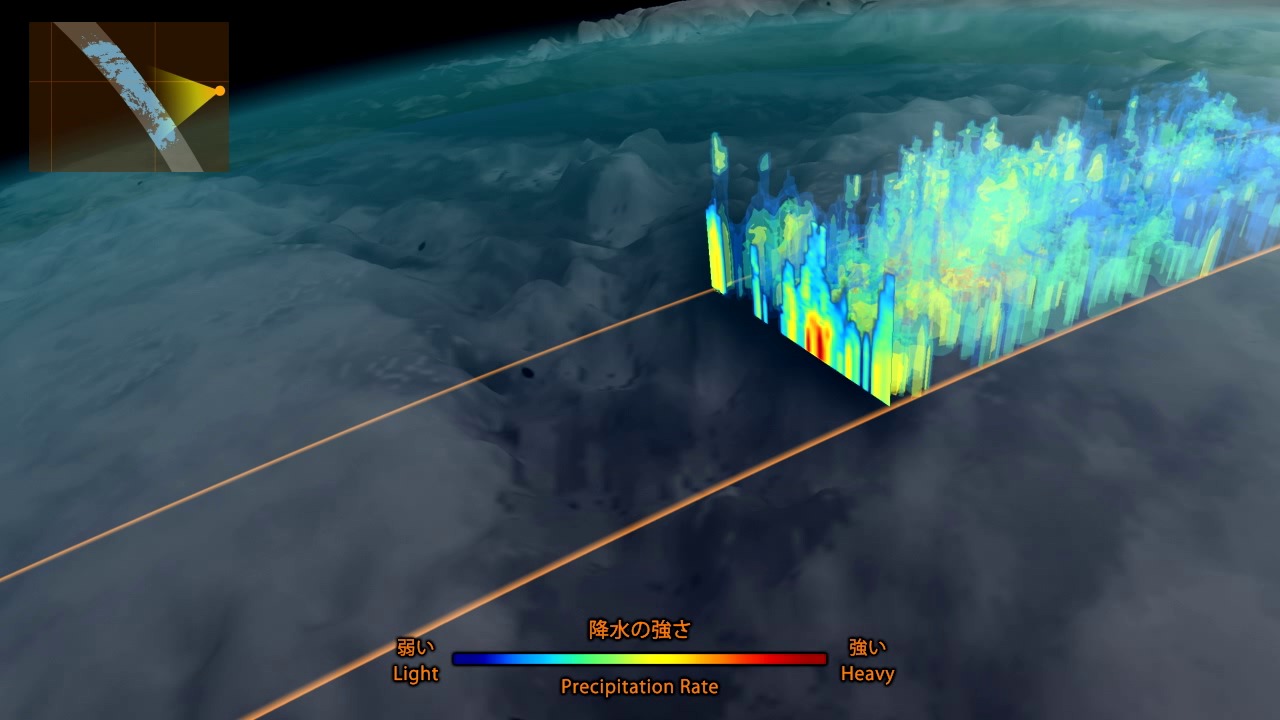 Produced Video
 - ID: 4147
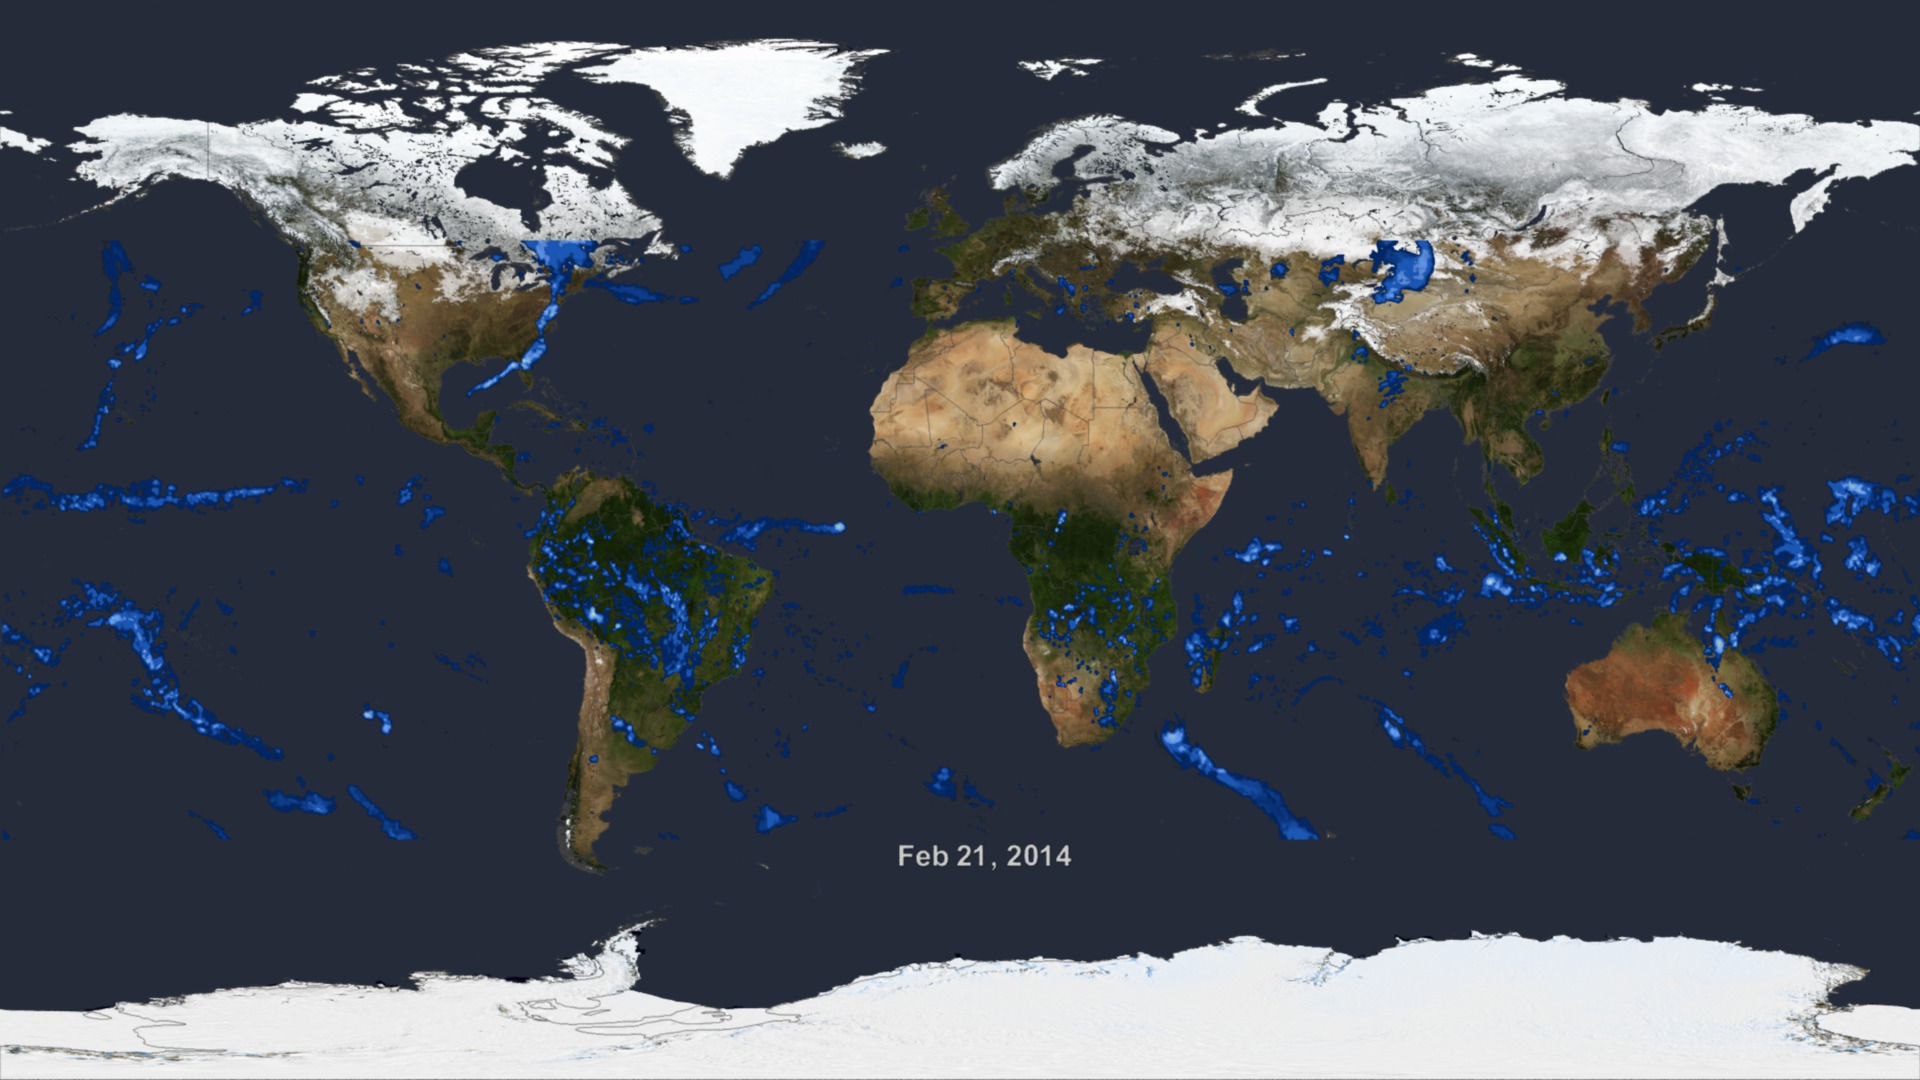
- ID: 4016
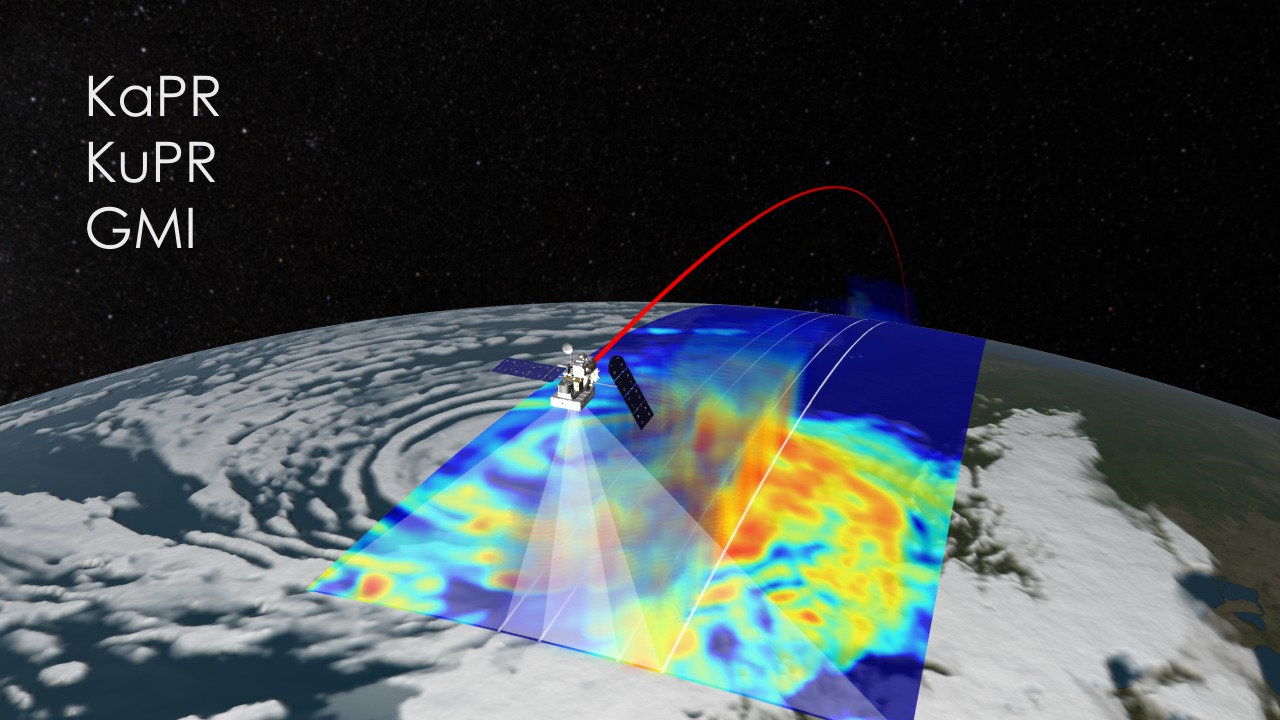
- ID: 3971
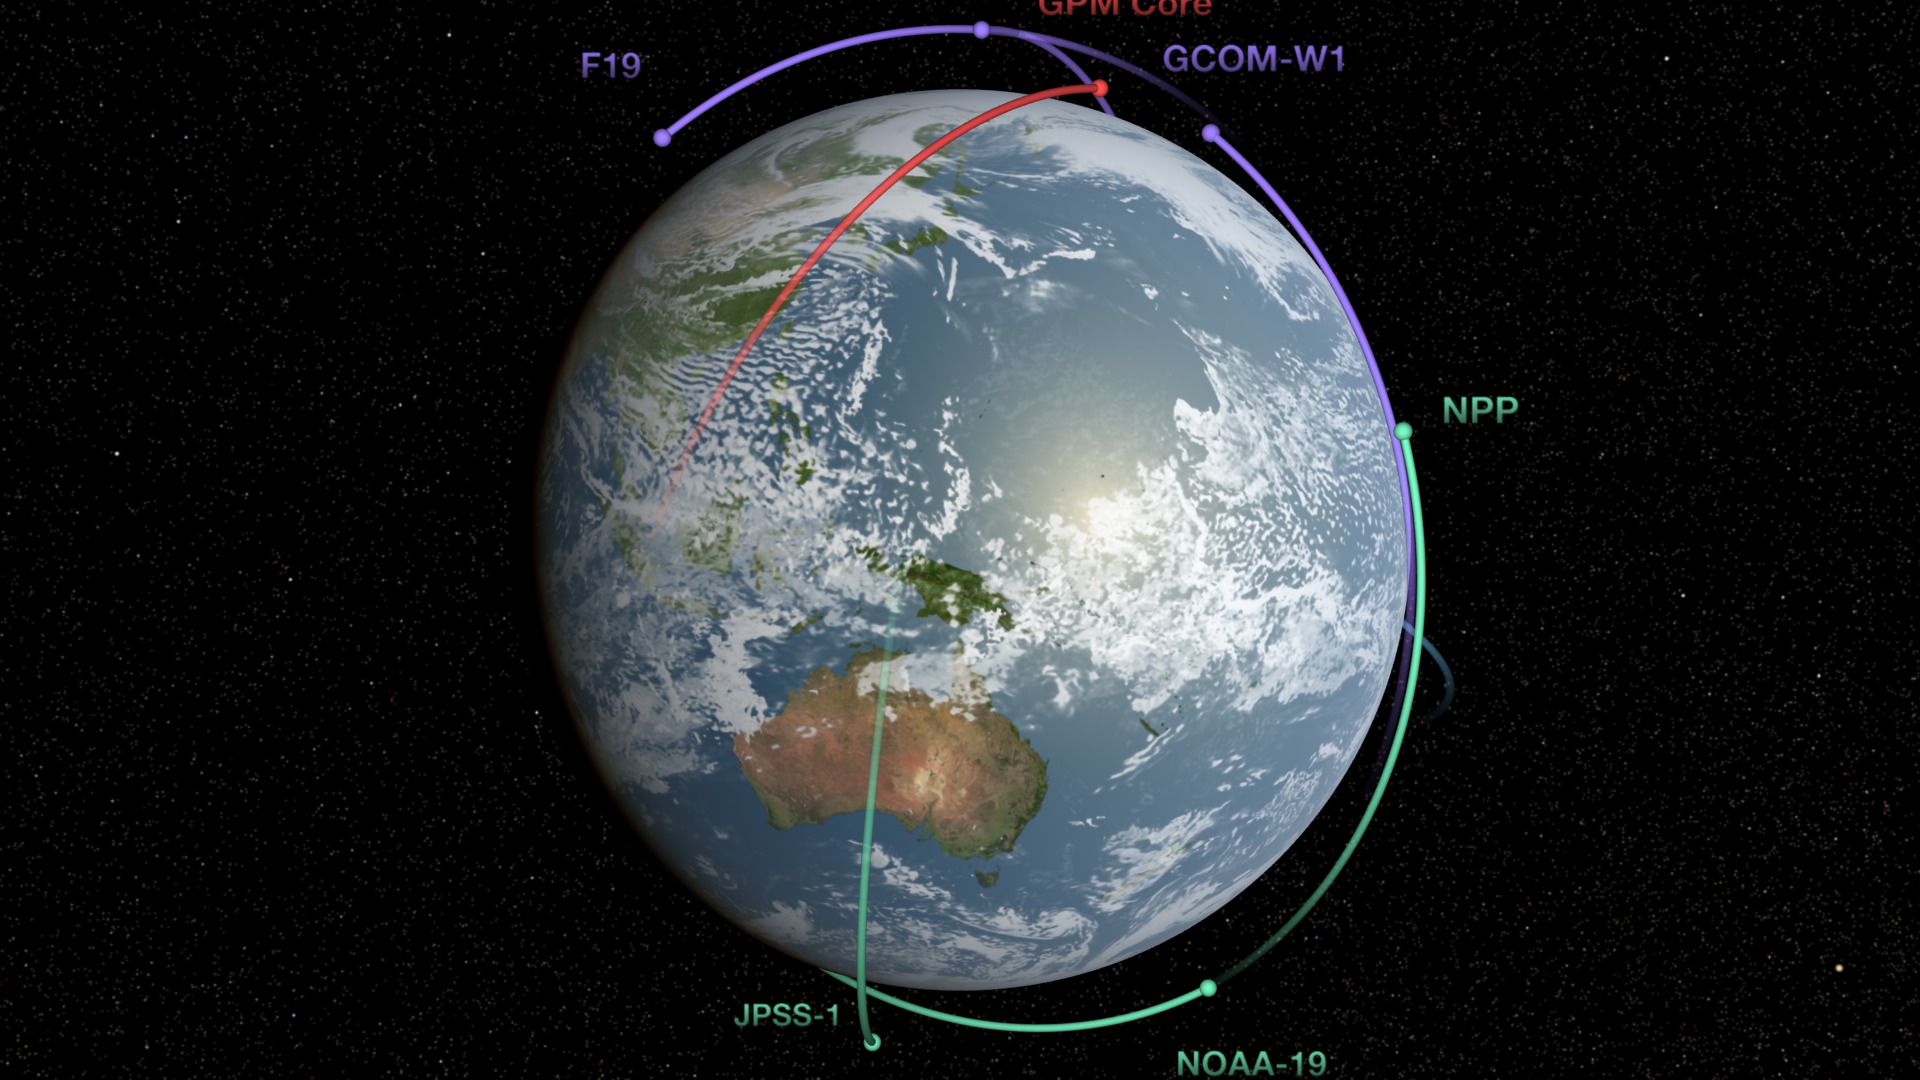 Visualization
 - ID: 3907
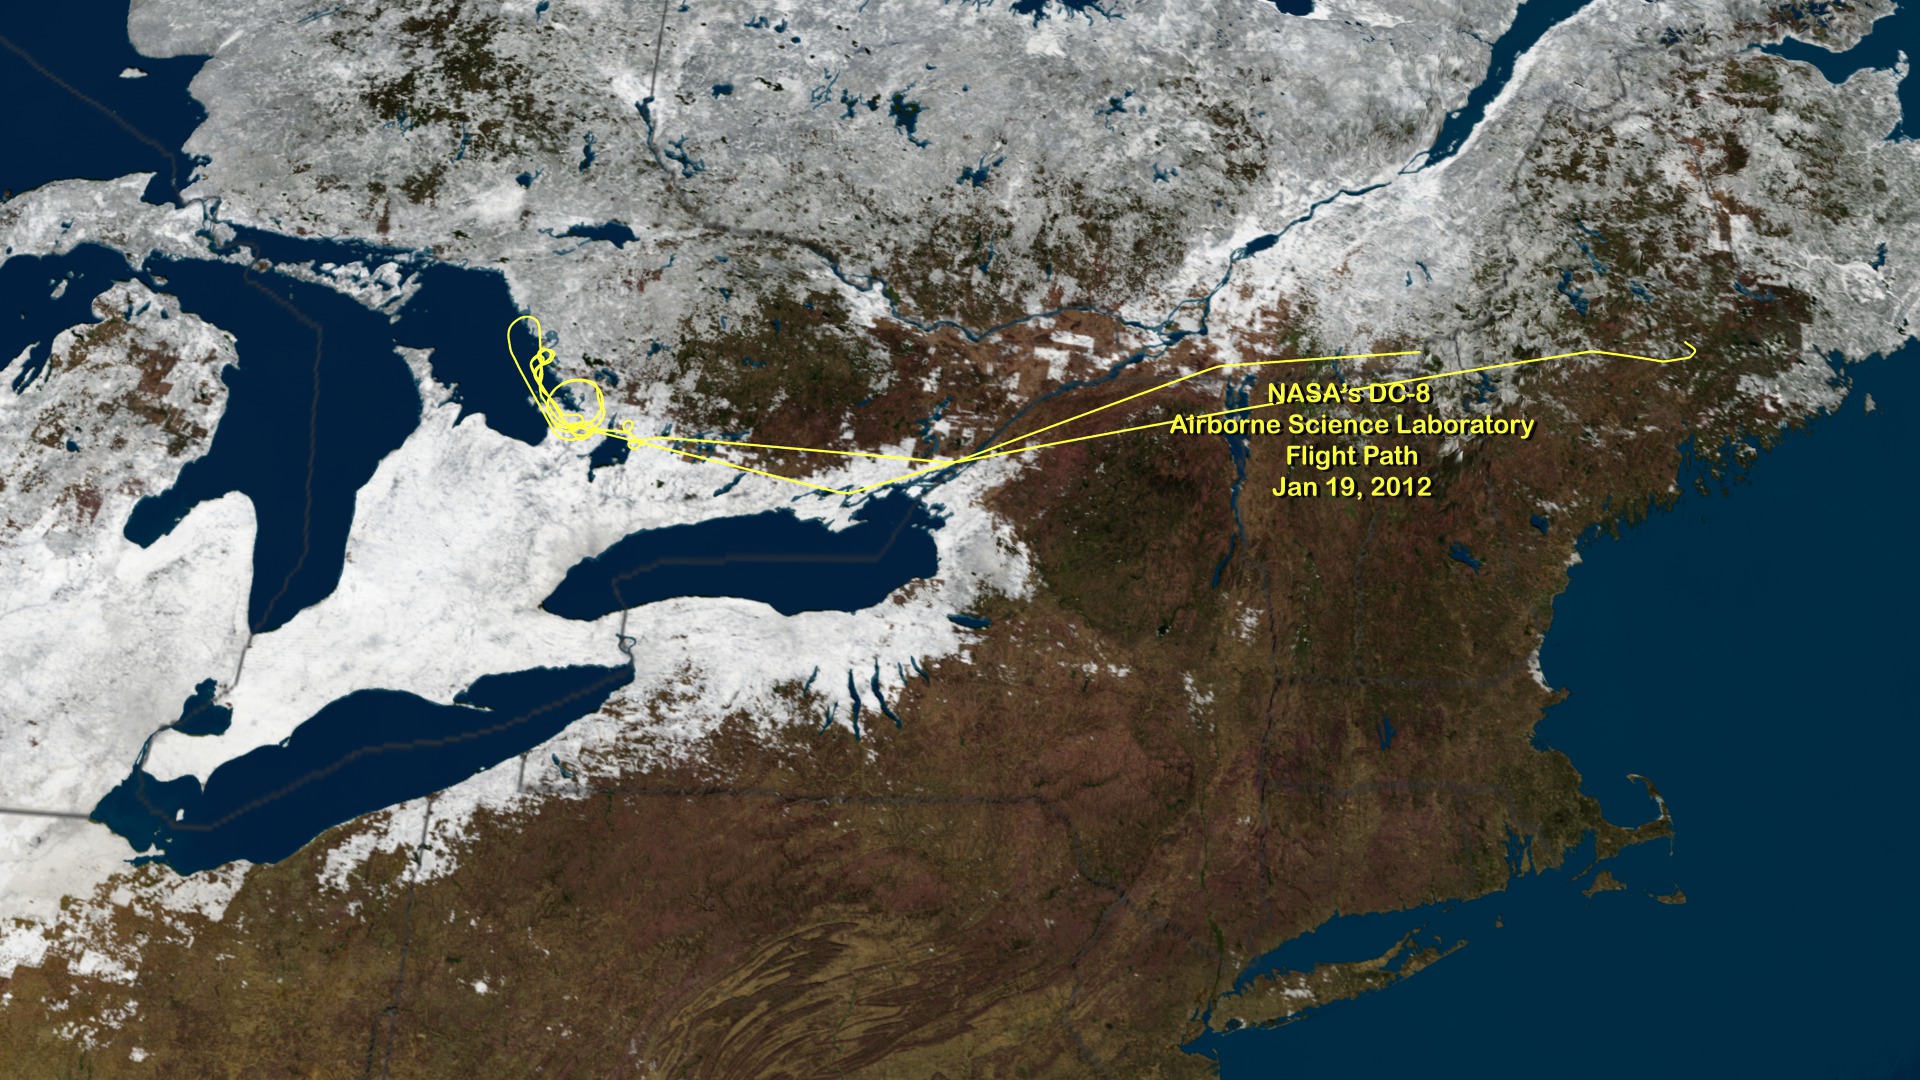
Animations
Conceptual and illustrative animations of GPM instruments and science concepts.
- ID: 12494 Produced Video

GPM Has Best Calibrated Microwave Imager in the World
Go to this pageThis is an infographic describing how the GPM Microwave Imager works and maintains its high degree of calibration, as well as how it contributes to the precipitation rates produced by the mission. || GMI_Calibration_Infographic_10_Final.jpg (1275x5978) [2.9 MB] || GMI_thumbnail_searchweb.png (320x180) [39.4 KB] || GMI_thumbnail_thm.png (80x40) [4.2 KB] ||
- Section

Drop Size Distribution
Go to this sectionNot all raindrops are created equal. The size of falling raindrops depends on several factors, including where the cloud producing the drops is located on the globe and where the drops originate in the cloud. For the first time, scientists have three-dimensional snapshots of raindrops and snowflakes around the world from space, thanks to the joint NASA and Japan Aerospace Exploration Agency Global Precipitation Measurement (GPM) mission. With the new global data on raindrop and snowflake sizes this mission provides, scientists can improve rainfall estimates from satellite data and in numerical weather forecast models, helping us better understand and prepare for extreme weather events. Watch this video on the NASA Goddard YouTube Channel.
- ID: 20226 Animation
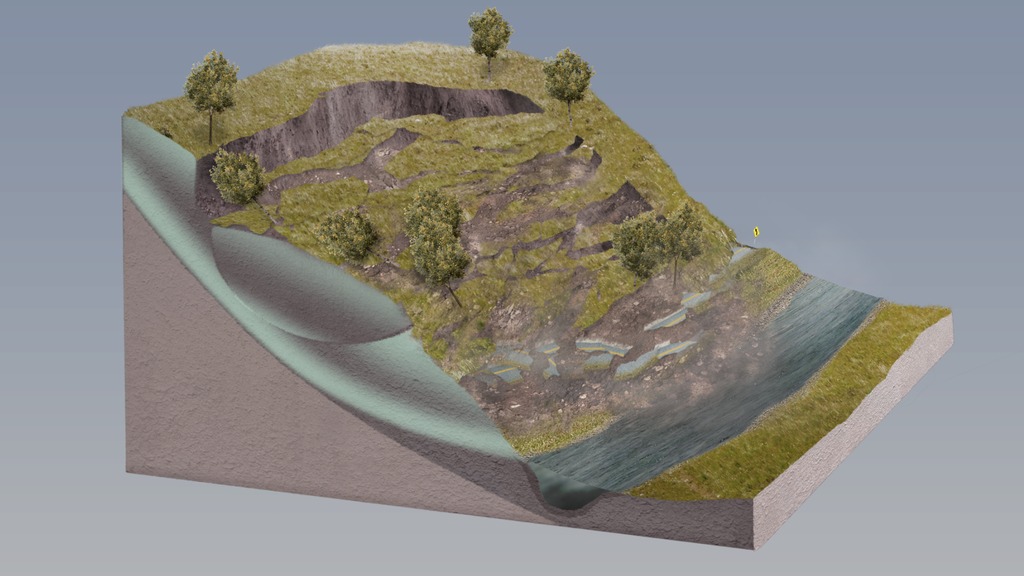
Landslide Animation
Go to this pageLandslide animation - rotational landslide. || landslide_seq_00660_print.jpg (1024x576) [113.4 KB] || landslide_seq_00660_searchweb.png (320x180) [59.1 KB] || landslide_seq_00660_thm.png (80x40) [5.0 KB] || Landslide_final_59fps_prores.webm (1920x1080) [1.8 MB] || 1920x1080_16x9_60p (1920x1080) [128.0 KB] || Landslide_final_59fps_h264.mov (1920x1080) [605.4 MB] || Landslide_final_59fps_prores.mov (1920x1080) [907.5 MB] || landslide.mp4 (1920x1080) [14.9 MB] ||
- ID: 11392 Produced Video
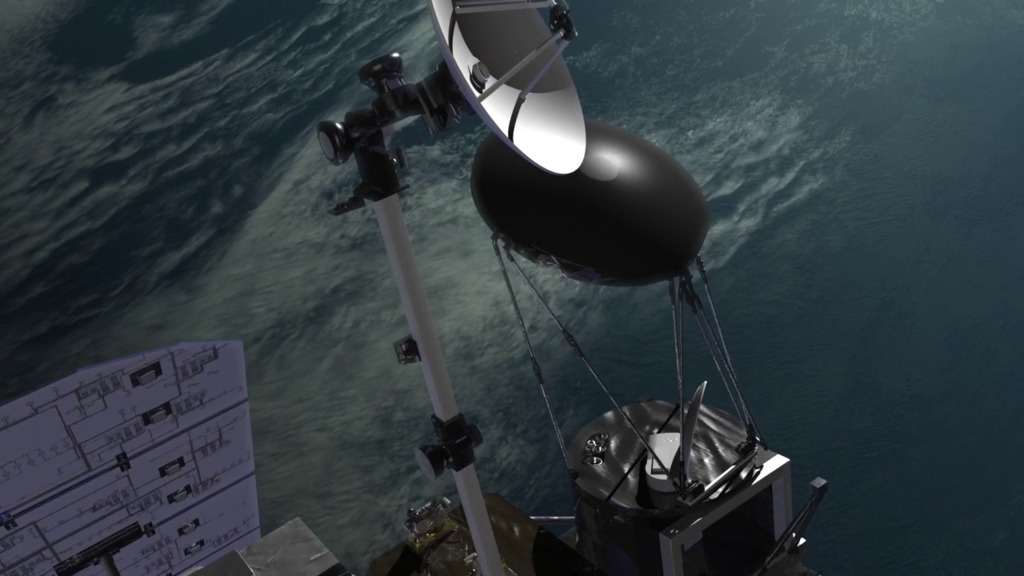
GPM Core Spacecraft Beauty Passes
Go to this pageA variety of animated beauty passes of the Global Precipitation Measurement (GPM) Core spacecraft. ||
- ID: 11129 Produced Video

GPM Launch and Deploy Animation
Go to this pageThis version contains music and sound effects. || GPM_Launch_Oct2012_youtube_hq.00252_print.jpg (1024x576) [56.9 KB] || GPM_Launch_Oct2012_youtube_hq_web.png (320x180) [155.8 KB] || GPM_Launch_Oct2012_youtube_hq_thm.png (80x40) [14.8 KB] || 1280x720_16x9_60p (1280x720) [0 Item(s)] || GPM_Launch_Oct2012_1280x720.wmv (1280x720) [62.8 MB] || GPM_Launch_Oct2012_appletv.m4v (960x540) [57.0 MB] || GPM_Launch_Oct2012_youtube_hq.mov (1280x720) [73.3 MB] || GPM_Launch_Oct2012_720x480.webmhd.webm (960x540) [29.1 MB] || GPM_Launch_Oct2012.mov (640x360) [53.6 MB] || GPM_Launch_Oct2012_720x480.wmv (720x480) [52.8 MB] || GPM_Launch_Oct2012_ipod_lg.m4v (640x360) [23.1 MB] || GSFC_20121101_GPM_m11129_Launch.en_US.vtt [59 bytes] || GPM_Launch_Oct2012_prores.mov (1280x720) [2.0 GB] ||
- ID: 11253 Produced Video

GPM Instrument Animations
Go to this pageThis conceptual animation shows the GPM Microwave Imager (GMI) and the Dual-frequency Precipitation Radar (DPR) scanning through a cloud detecting various precipitation particles. ||
People of GPM
 Section
 Section
 Section
 Section
 Section
 Section
 Section
 Section
 Section
 Section
 Section
 Section
 Section
OLYMPEX Field Campaign 2015-2016
The Olympic Mountain Experiment, or OLYMPEX, is a NASA-led field campaign, which will take place on the Olympic Peninsula of Washington State from November 2015 through February 2016. The goal of the campaign is to collect detailed atmospheric measurements that will be used to evaluate how well rain-observing satellites measure rainfall and snowfall from space. In particular, OLYMPEX will be assessing satellite measurements made by the Global Precipitation Measurement (GPM) mission Core Observatory.
- ID: 40261 Gallery

OLYMPEX
Go to this pageThe Olympic Mountain Experiment, or OLYMPEX, is a NASA-led field campaign, which will take place on the Olympic Peninsula of Washington State from November 2015 through February 2016. The goal of the campaign is to collect detailed atmospheric measurements that will be used to evaluate how well rain-observing satellites measure rainfall and snowfall from space. In particular, OLYMPEX will be assessing satellite measurements made by the Global Precipitation Measurement (GPM) mission Core Observatory, a joint mission by NASA and the Japan Aerospace Exploration Agency (JAXA), which launched in 2014. For more information: http://pmm.nasa.gov/olympex
Launch Coverage
GPM launched at 1:37 PM EST on February 27, 2014, from Tanegashima Space Center, Japan.
- ID: 11496 Produced Video
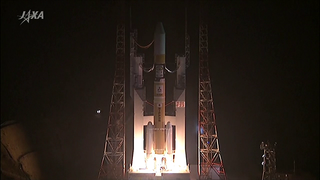
GPM Launch Multimedia Package
Go to this pageA Japanese H-IIA rocket with the NASA-Japan Aerospace Exploration Agency (JAXA), Global Precipitation Measurement (GPM) Core Observatory onboard, is seen launching from th Tanegashima Space Center, 1:37 PM (EST) on Friday, Feb. 28, 2014, Tanegashima Space Center. The GPM spacecraft will collect information that unifies data from an international network of existing and future satellites to map global rainfall and snowfall every three hours. ||
- Section

Live Launch Coverage
Go to this sectionA Japanese H-IIA rocket with the NASA-Japan Aerospace Exploration Agency (JAXA), Global Precipitation Measurement (GPM) Core Observatory onboard, is seen launching from th Tanegashima Space Center, 1:37 PM (EST) on Friday, Feb. 28, 2014, Tanegashima Space Center. The GPM spacecraft will collect information that unifies data from an international network of existing and future satellites to map global rainfall and snowfall every three hours.
- Section
Launch Video File
Go to this sectionA Japanese H-IIA rocket with the NASA-Japan Aerospace Exploration Agency (JAXA), Global Precipitation Measurement (GPM) Core Observatory onboard, is seen launching from th Tanegashima Space Center, 1:37 PM (EST) on Friday, Feb. 28, 2014, Tanegashima Space Center. The GPM spacecraft will collect information that unifies data from an international network of existing and future satellites to map global rainfall and snowfall every three hours.
- Section

Postlaunch Briefing from Japan
Go to this sectionA Japanese H-IIA rocket with the NASA-Japan Aerospace Exploration Agency (JAXA), Global Precipitation Measurement (GPM) Core Observatory onboard, is seen launching from th Tanegashima Space Center, 1:37 PM (EST) on Friday, Feb. 28, 2014, Tanegashima Space Center. The GPM spacecraft will collect information that unifies data from an international network of existing and future satellites to map global rainfall and snowfall every three hours.
- ID: 11489 Produced Video

Global Precipitation Measurement (GPM) Live Shot broll
Go to this pageNASA scientists talk about the GPM mission ahead of launch. ||
- ID: 11488 Produced Video
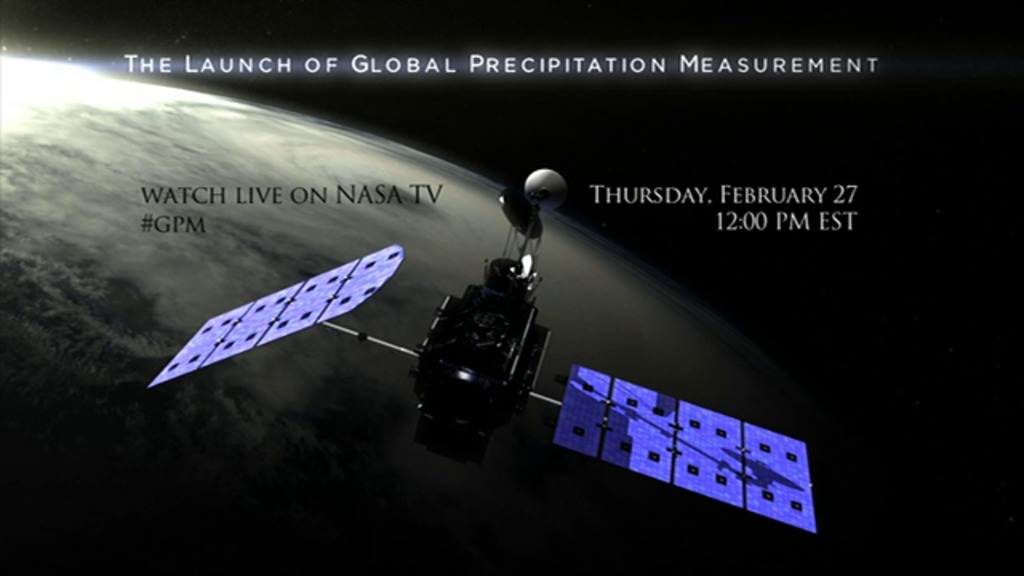
GPM Launch Coverage Promo
Go to this pageJoin NASA as we count down the launch of the Global Precipitation Measurement (GPM) mission at 12:00 PM EST, Thursday, February 27, 2014. GPM is a joint mission between NASA and the Japan Aerospace Exploration Agency (JAXA) and it will set a new standard in measuring rain and snow around the world. As we build up to the launch from Tanegashima Space Center in Japan, our NASA scientists will discuss the satellite's major innovations and the big questions GPM will set out to answer. Follow along on NASA Television (www.nasa.gov/ntv) and ask your big questions to the experts using #gpm on Twitter. GPM is scheduled to launch from Tanegashima Space Center at 1:07 PM EST on February 27, 2014. For more information, visit www.nasa.gov/GPM. ||
Countdown to Launch
Short videos highlighting major steps along the way from Goddard Space Flight Center, Md., to launch from Tanegashima Island, Japan.
- Section

Waiting for Launch
Go to this sectionGPM is a joint mission between NASA and the Japan Aerospace Exploration Agency (JAXA). The Core Observatory will link data from a constellation of current and planned satellites to produce next-generation global measurements of rainfall and snowfall from space.The GPM mission is the first coordinated international satellite network to provide near real-time observations of rain and snow every three hours anywhere on the globe. The GPM Core Observatory anchors this network by providing observations on all types of precipitation. The observatory's data acts as the measuring stick by which partner observations can be combined into a unified data set. The data will be used by scientists to study climate change, freshwater resources, floods and droughts, and hurricane formation and tracking.
- Section

GPM's Last Stop Before Orbit
Go to this sectionGPM is a joint mission between NASA and the Japan Aerospace Exploration Agency (JAXA). The Core Observatory will link data from a constellation of current and planned satellites to produce next-generation global measurements of rainfall and snowfall from space.The GPM mission is the first coordinated international satellite network to provide near real-time observations of rain and snow every three hours anywhere on the globe. The GPM Core Observatory anchors this network by providing observations on all types of precipitation. The observatory's data acts as the measuring stick by which partner observations can be combined into a unified data set. The data will be used by scientists to study climate change, freshwater resources, floods and droughts, and hurricane formation and tracking.
- Section

Greetings from Minamitane!
Go to this sectionGPM is a joint mission between NASA and the Japan Aerospace Exploration Agency (JAXA). The Core Observatory will link data from a constellation of current and planned satellites to produce next-generation global measurements of rainfall and snowfall from space.The GPM mission is the first coordinated international satellite network to provide near real-time observations of rain and snow every three hours anywhere on the globe. The GPM Core Observatory anchors this network by providing observations on all types of precipitation. The observatory's data acts as the measuring stick by which partner observations can be combined into a unified data set. The data will be used by scientists to study climate change, freshwater resources, floods and droughts, and hurricane formation and tracking.
- Section

Fairing Encapsulation
Go to this sectionGPM is a joint mission between NASA and the Japan Aerospace Exploration Agency (JAXA). The Core Observatory will link data from a constellation of current and planned satellites to produce next-generation global measurements of rainfall and snowfall from space.The GPM mission is the first coordinated international satellite network to provide near real-time observations of rain and snow every three hours anywhere on the globe. The GPM Core Observatory anchors this network by providing observations on all types of precipitation. The observatory's data acts as the measuring stick by which partner observations can be combined into a unified data set. The data will be used by scientists to study climate change, freshwater resources, floods and droughts, and hurricane formation and tracking.
- ID: 11427 Produced Video

GPM: Journey to Launch
Go to this pageAn international satellite that will set a new standard for global precipitation measurements from space has completed a 7,300-mile journey from the United States to Japan, where it now will undergo launch preparations.A U.S. Air Force C-5 transport aircraft carrying the Global Precipitation Measurement (GPM) Core Observatory landed at Kitakyushu Airport, about 600 miles southwest of Tokyo, at approximately 10:30 p.m. EST Saturday, Nov. 23.The spacecraft, the size of a small private jet, is the largest satellite ever built at NASA’s Goddard Space Flight Center in Greenbelt, Md. It left Goddard inside a large shipping container Nov. 19 and began its journey across the Pacific Ocean Nov. 21 from Joint Base Andrews in Maryland, with a refueling stop in Anchorage, Alaska.From Kitakyushu Airport, the spacecraft was loaded onto a barge heading to the Japan Aerospace Exploration Agency's (JAXA's) Tanegashima Space Center on Tanegashima Island in southern Japan, where it will be prepared for launch in early 2014 on an H-IIA rocket. ||
Raw Media for Broadcast
HD broadcast-quality footage of the GPM Core spacecraft in various stages of integration and testing, as well as the shipping of the spacecraft to Japan in preparation for launch.
- ID: 11617 B-Roll
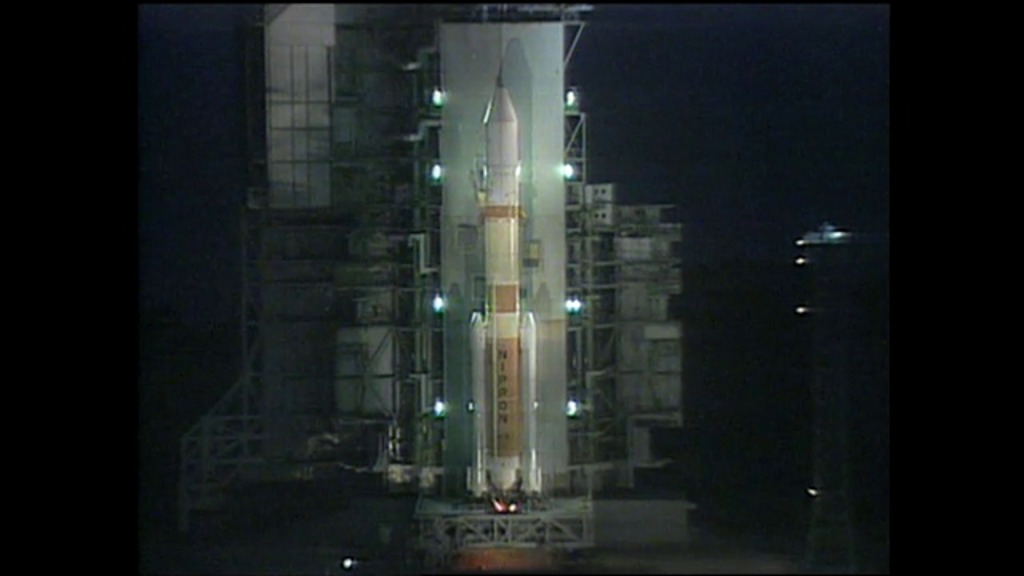
- ID: 11456 B-Roll

GPM Arrives in Japan Extended B-roll
Go to this pageExtended b-roll of GPM's arrival in Japan and journey to Tanegashima Space Center, Japan.Built at NASA's Goddard Space Flight Center in Greenbelt, Md., the GPM spacecraft travelled roughly 7,300 miles (11,750 kilometers) to its launch site at Tanegashima Space Center on Tanegashima Island, Japan, where it is scheduled for liftoff on Feb 27, 2014 1:07 pm (EST). GPM's Core Observatory is a joint mission between NASA and the Japan Aerospace Exploration Agency to study rainfall and snowfall around the globe, including weather and storms that the Core Observatory previewed on its trans-Pacific journey. ||
- ID: 11424 Produced Video

GPM Ships Out to Japan for Launch
Go to this pageAn international satellite that will set a new standard for global precipitation measurements from space began its 7,300-mile journey from Maryland to Japan where it will undergo launch preparations. The Global Precipitation Measurement (GPM) mission is a partnership led by NASA and the Japan Aerospace Exploration Agency (JAXA). GPM’s Core Observatory satellite is designed to unify precipitation measurements made by a constellation of U.S. and international partner satellites to achieve global coverage of rain and snow every three hours. The spacecraft was carried by truck from its design and testing home at NASA's Goddard Space Flight Center in Greenbelt, Md., on Nov. 19th inside a large transportation container to Andrews Air Force Base, Md. The container was loaded onto an Air Force C-5 transport aircraft, which left Andrews early on Nov. 21 for a 15-hour flight to the Kitakyushu Airport in Japan. From the Kitakyushu Airport the spacecraft will be loaded onto a barge and shipped to JAXA’s Tanegashima Space Center on Tanegashima Island in southern Japan where it will be prepared for launch in early 2014 on a H-IIA rocket. The GPM Core Observatory satellite, which is the size of a small business jet, is the largest Earth science satellite ever built at NASA Goddard.This is footage of the GPM Core spacecraft leaving Goddard Space Flight Center and traveling to Andrews Air Force Base for travel to Japan for launch. ||
- ID: 11398 Produced Video
GPM Video File
Go to this pageThe Global Precipitation Measurement (GPM) mission is an international satellite mission that will set a new standard for precipitation measurements from space, providing the next-generation observations of rain and snow worldwide every three hours. GPM data will advance our understanding of the water and energy cycles and extend the use of precipitation data to directly benefit society. JAXA, the Japan Aerospace Exploration Agency, is NASA's main partner in GPM. GPM will launch in early 2014. ||
- ID: 10999 Produced Video

GPM Core Spacecraft Integration and Testing
Go to this pageA selection of footage of the GPM Core Observatory building, testing, and integration. ||
- ID: 11067 Produced Video
GPM: What We Don't Know About Snow
Go to this pageGPM Deputy Project Scientist Gail Skofronick-Jackson discusses GPM's snowfall measurement capabilities and the challenges of measuring snow. ||
- ID: 10890 Produced Video

NASA Airborne Cold Weather Experiment Measures Falling Snow
Go to this pageNASA is flying an airborne science laboratory through Canadian snowstorms for six weeks in support of a difficult task of the upcoming Global Precipitation Measurement (GPM) mission: measuring snowfall from space. GPM is an international satellite mission scheduled for launch in 2014 that will provide next-generation observations of worldwide rain and snow every three hours. It is the first precipitation mission designed to detect falling snow from space. ||
Prelaunch Press Briefings
Press briefings held on January 27, 2014, from Goddard Space Flight Center.
- ID: 11462 Produced Video
GPM L-30 Mission and Science Briefings
Go to this pageNASA held a series of media events Monday, Jan. 27, in advance of the February launch of the Global Precipitation Measurement (GPM) Core Observatory from Japan. The events were held at NASA’s Goddard Space Flight Center in Greenbelt, Md.GPM is an international satellite mission led by NASA and the Japan Aerospace Exploration Agency (JAXA) that will provide next-generation observations of rain and snow worldwide. GPM data also will contribute to climate research and the forecasting of extreme weather events such as floods and hurricanes.The GPM Core Observatory is scheduled to lift off Feb. 27, between 1:07 and 3:07 p.m. EST, from JAXA's Tanegashima Space Center in Japan.Media events include briefings on the GPM mission and science. Briefing panelists are: Steven Neeck, deputy associate director, flight program, Earth Science, NASA Headquarters, Washington Kinji Furukawa, GPM Dual-frequency Precipitation Radar deputy project manager, JAXA, Tsukuba Art Azarbarzin, GPM project manager, Goddard Ramesh Kakar, GPM program scientist, Headquarters Gail Skofronick-Jackson, GPM deputy project scientist, Goddard Riko Oki, GPM/DPR program scientist, JAXATo view on YouTube, click here for the Mission Briefing and the Science Briefing. ||
High Resolution Still Images
Large images of the GPM Core spacecraft over several building, testing and integration milestones.
- ID: 11294 Produced Video
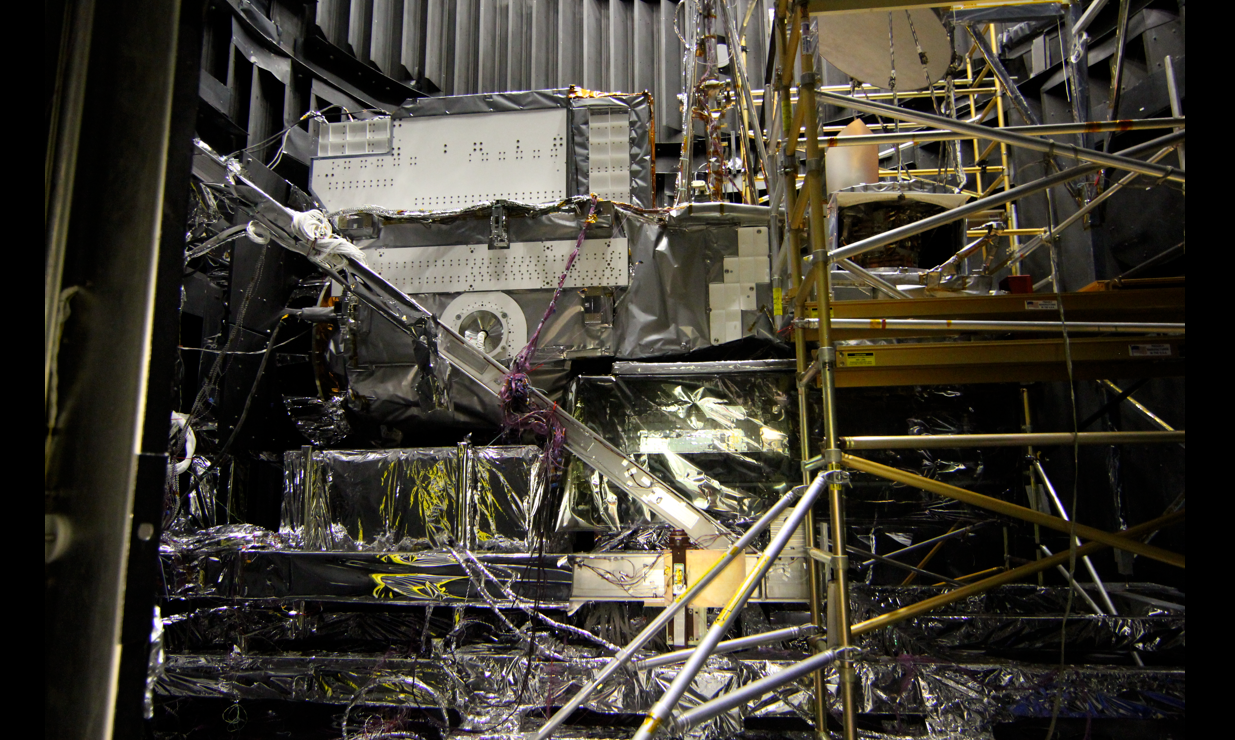
GPM High-resolution Still Images
Go to this pageThese are images documenting the building, integration and testing of the Global Precipitation Measurement (GPM) mission. The most recent developments are listed first.For additional images please visit the Precipitation Measurement Missions Image Gallery. || Vibration testing of the horizontal axis of the spacecraft.Credit: NASA || GPM_horiz_vibe.png (3456x5184) [26.4 MB] || GPM_horiz_vibe_web.png (320x480) [312.0 KB] || GPM_horiz_vibe_thm.png (80x40) [10.5 KB] ||
Educator Resources
These are elements that may be used as materials in presentations.
- ID: 11461 Produced Video

Assembling the GPM Paper Model
Go to this pageThis is an instructional video for the GPM paper model. ||
- ID: 11165 Produced Video

- ID: 11288 Produced Video
Anatomy of a Raindrop
Go to this pageThis short video explains how a raindrop falls through the atmosphere and why a more accurate look at raindrops can improve estimates of global precipitation.For a printable droplet hand out click here. ||