Hurricanes and Typhoons
Overview
A collection of data visualizations and imagery for tropical cyclones, including hurricanes and typhoons.
For more resources, visit the links below:
Historic Storms
- ID: 4685
 Visualization
 - ID: 40367
 Gallery
 - ID: 4585
- ID: 4584
 Visualization
 - ID: 4458
- ID: 4575
 Visualization
 - ID: 11870
 Produced Video
 - ID: 30019
 Hyperwall Visual
 - ID: 30465
 Hyperwall Visual
 - ID: 11269
 Produced Video
 - ID: 30220
 Hyperwall Visual
 - ID: 11925
 Produced Video
 - ID: 10633
 Produced Video
 - ID: 3216
- ID: 3221
 Visualization
 - ID: 3253
 Visualization
Tropical Cyclones: Visualizations
- ID: 4681
- ID: 4658
- ID: 4682
- ID: 4586
- ID: 4585
- ID: 4584Visualization
- ID: 4458
- ID: 4575Visualization
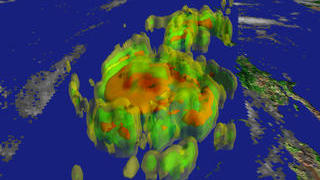
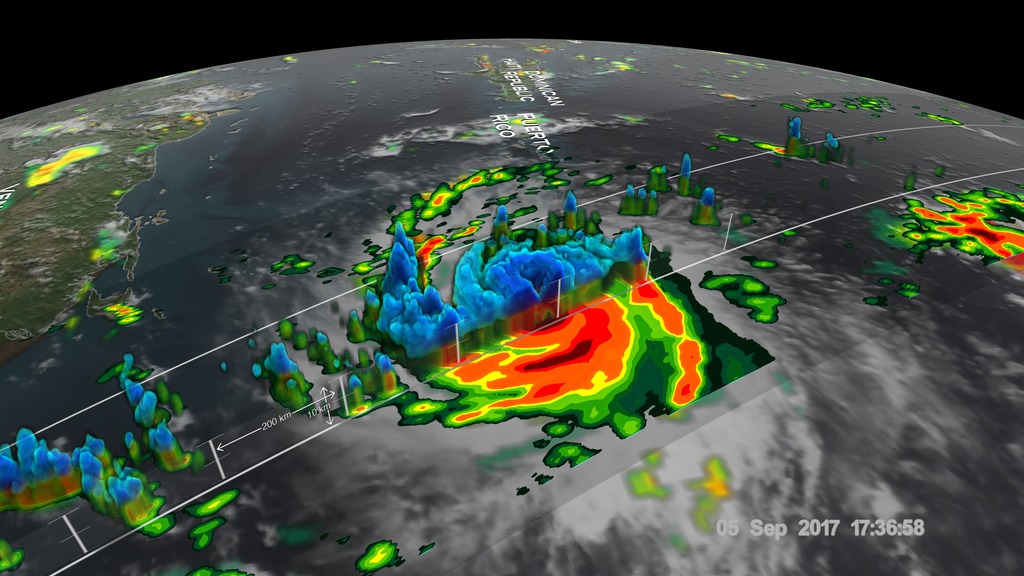
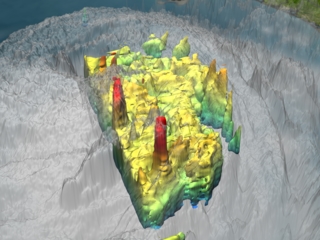
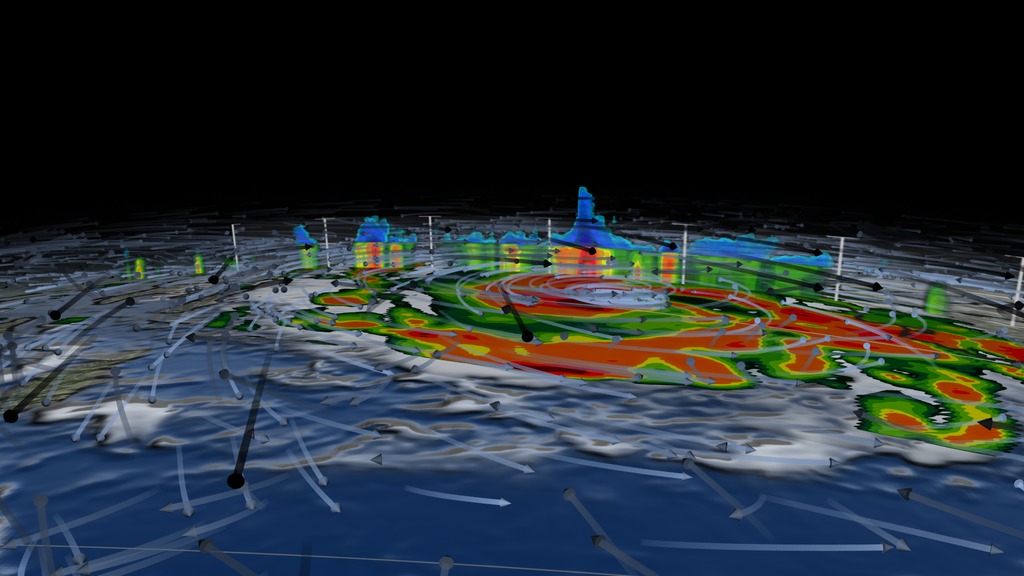
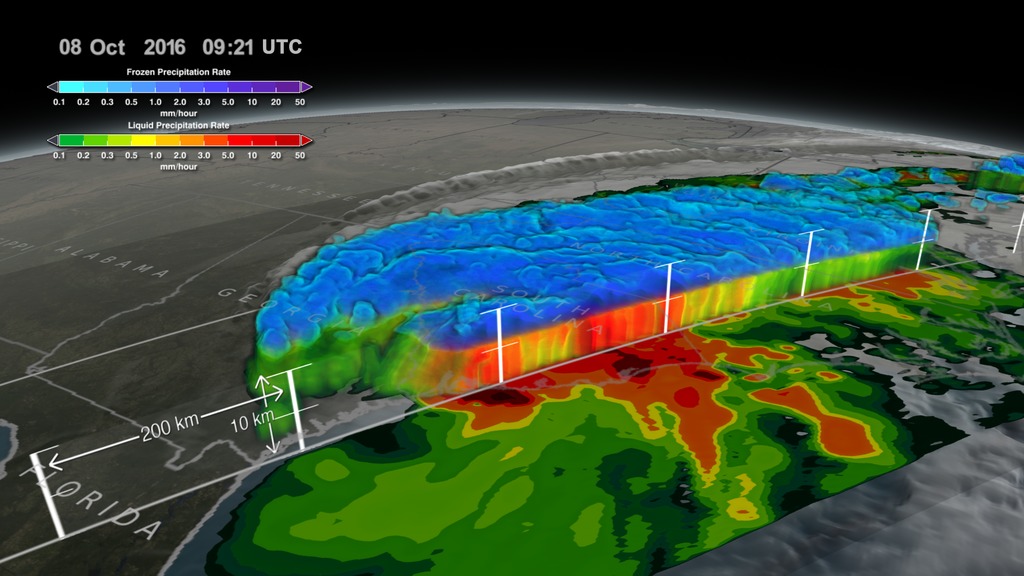
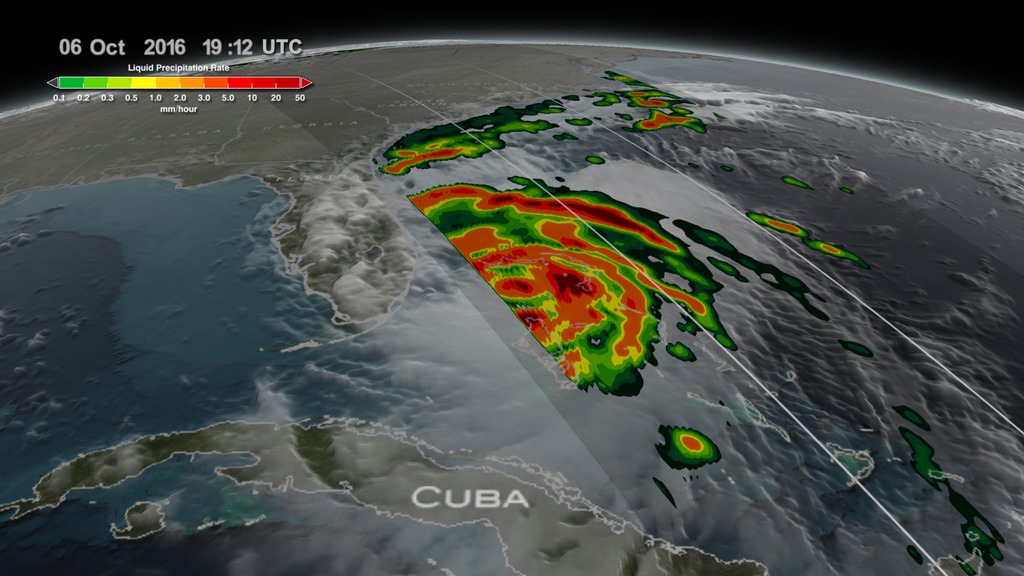
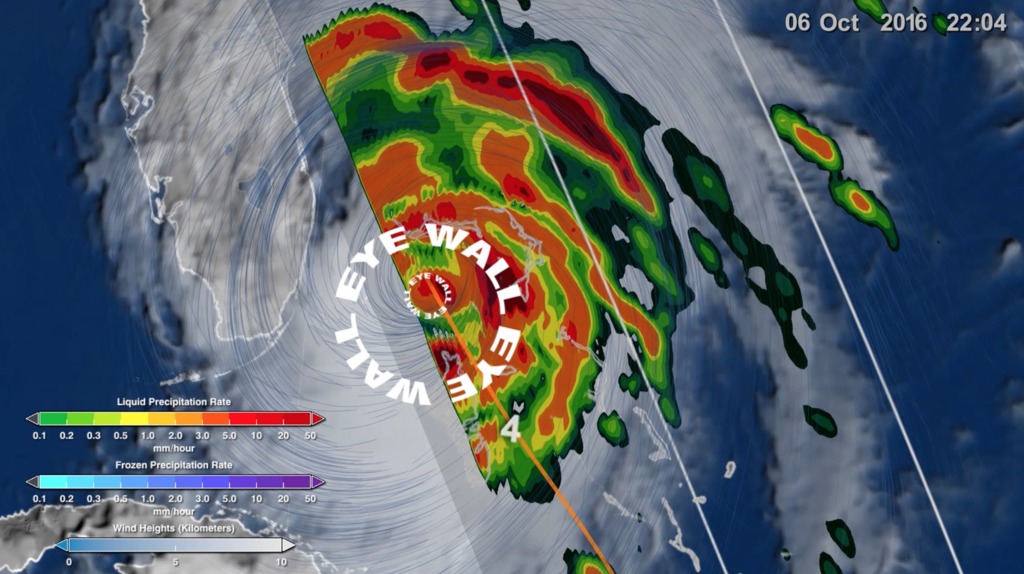
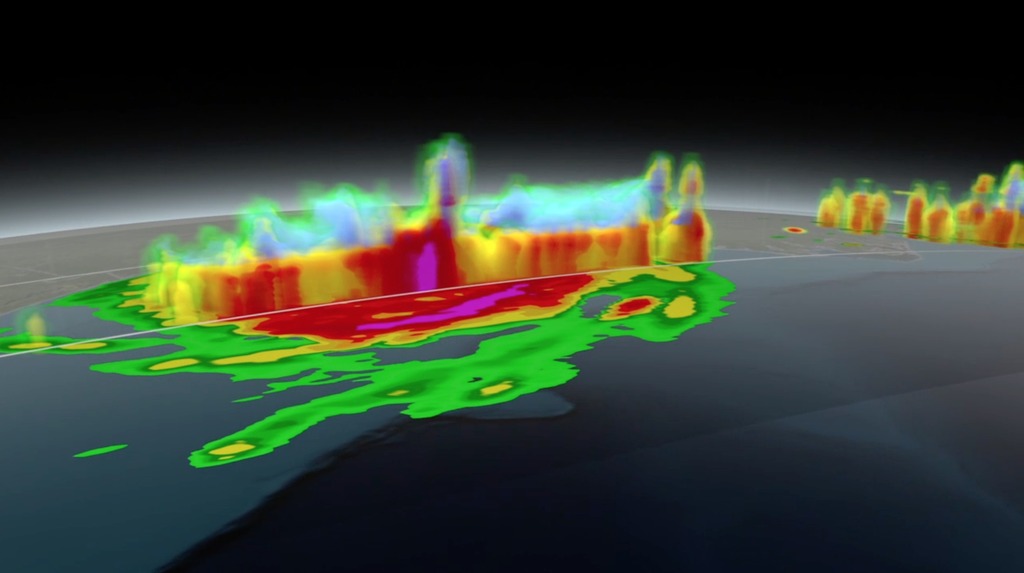
![NASA’s Global Precipitation Measurement Mission or GPM core satellite captured Hurricane Matthew in 3-D as it made landfall on Haiti and as it travelled up to the Florida coast. GPM flew directly over the storm several times between October 2 - October 6, 2016. The most recent view on October 6 reveals massive amounts of rainfall being produced by the storm as it approaches Florida.The GPM core satellite carries two instruments that show the location and intensity of rain and snow, which defines a crucial part of the storm structure – and how it will behave. The GPM Microwave Imager sees through the tops of clouds to observe how much and where precipitation occurs, and the Dual-frequency Precipitation Radar observes precise details of precipitation in 3-dimensions.For more information about the science behind Hurricane Matthew visit: http://www.nasa.gov/matthewFor the latest storm warnings and safety information please consult your local news channels and the National Hurricane Center: http://www.nhc.noaa.gov/Video credit: NASA's Goddard Space Flight Center/Joy NgMusic credit: Diamond Skies by Andrew Skeet [PRS], Anthony Phillips [PRS] from the KillerTracks catalog](/vis/a010000/a012300/a012389/LARGE_MP4-12389_HurricaneMatthew3D_large.00071_searchweb.png)
- ID: 4548
 Visualization
 - ID: 4512
 Visualization
 - ID: 4511
 Visualization
 - ID: 4358
 Visualization
Tropical Cyclones: Visible Imagery
 Link
LinkHurricane and Tropical Cyclone Image Gallery
Gallery of visible imagery of tropical cyclones.
Go to this link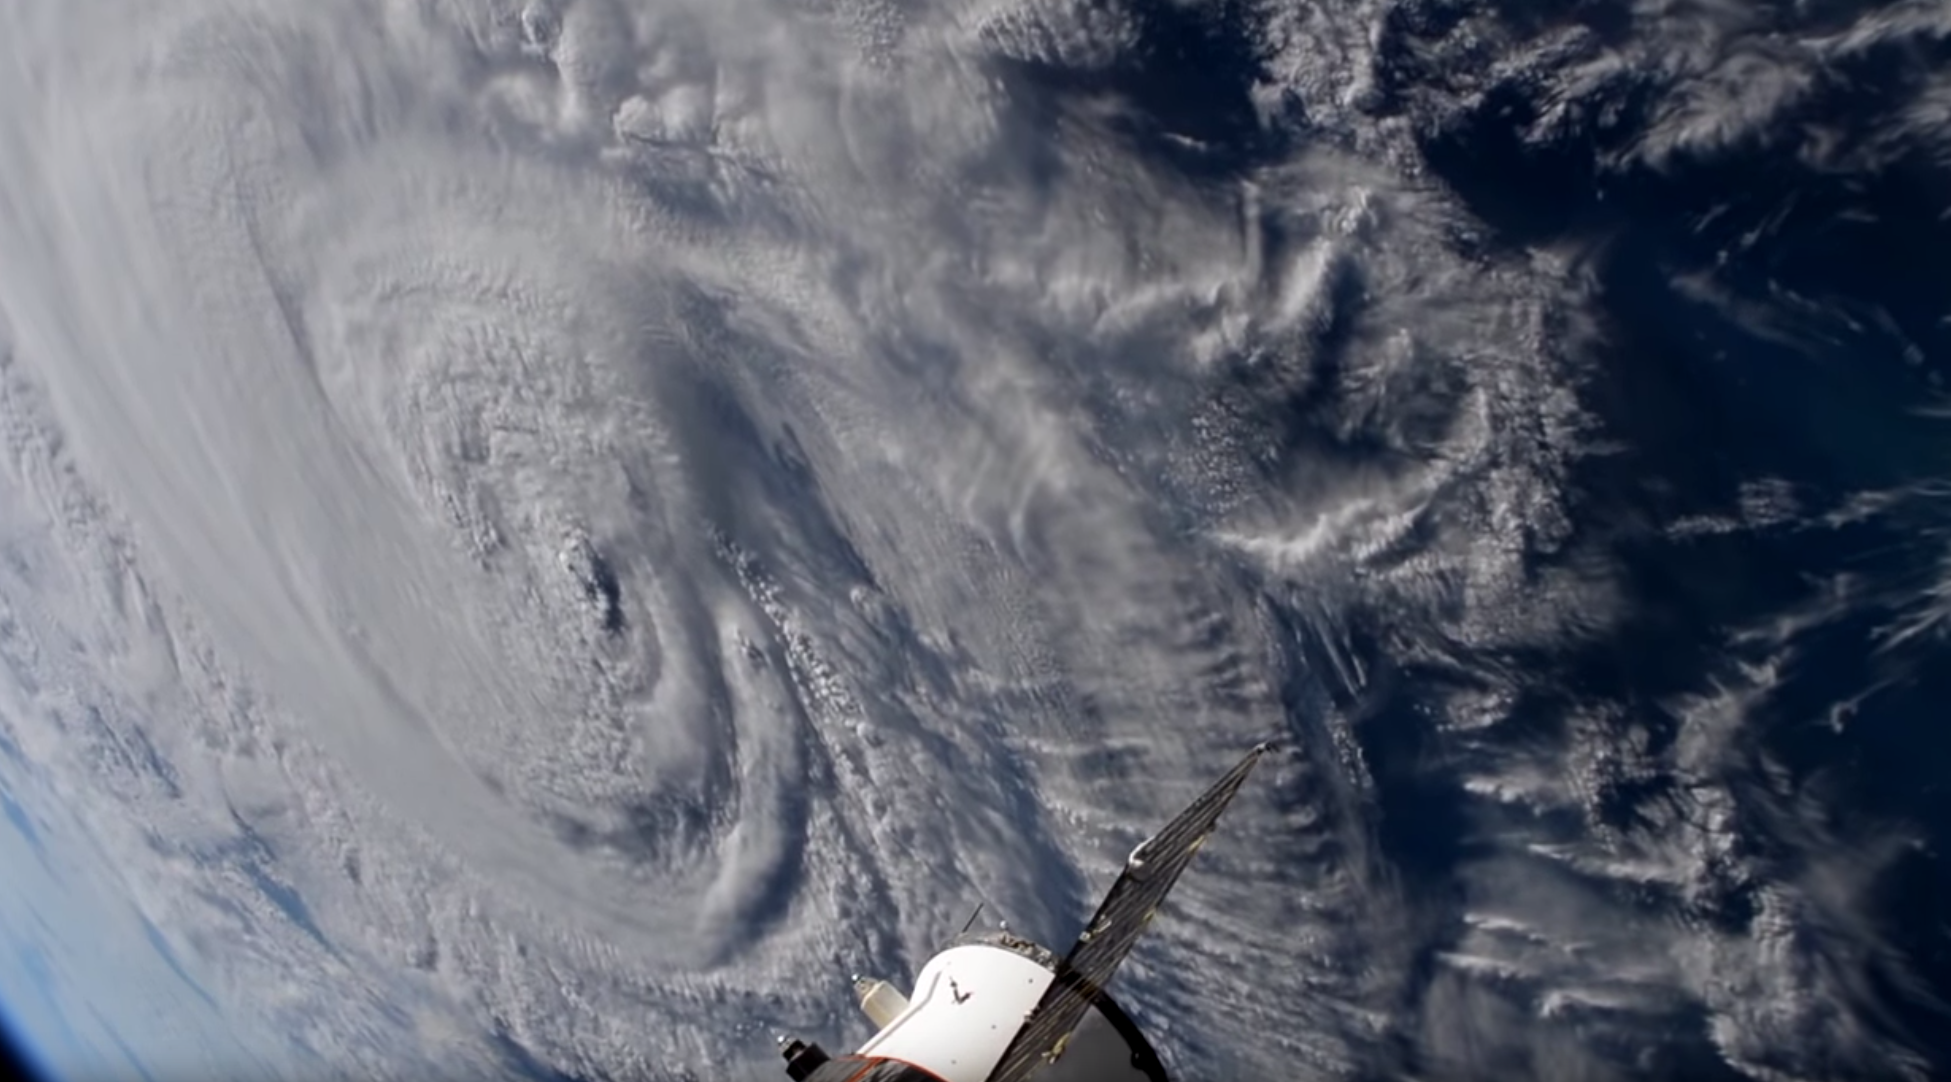 Link
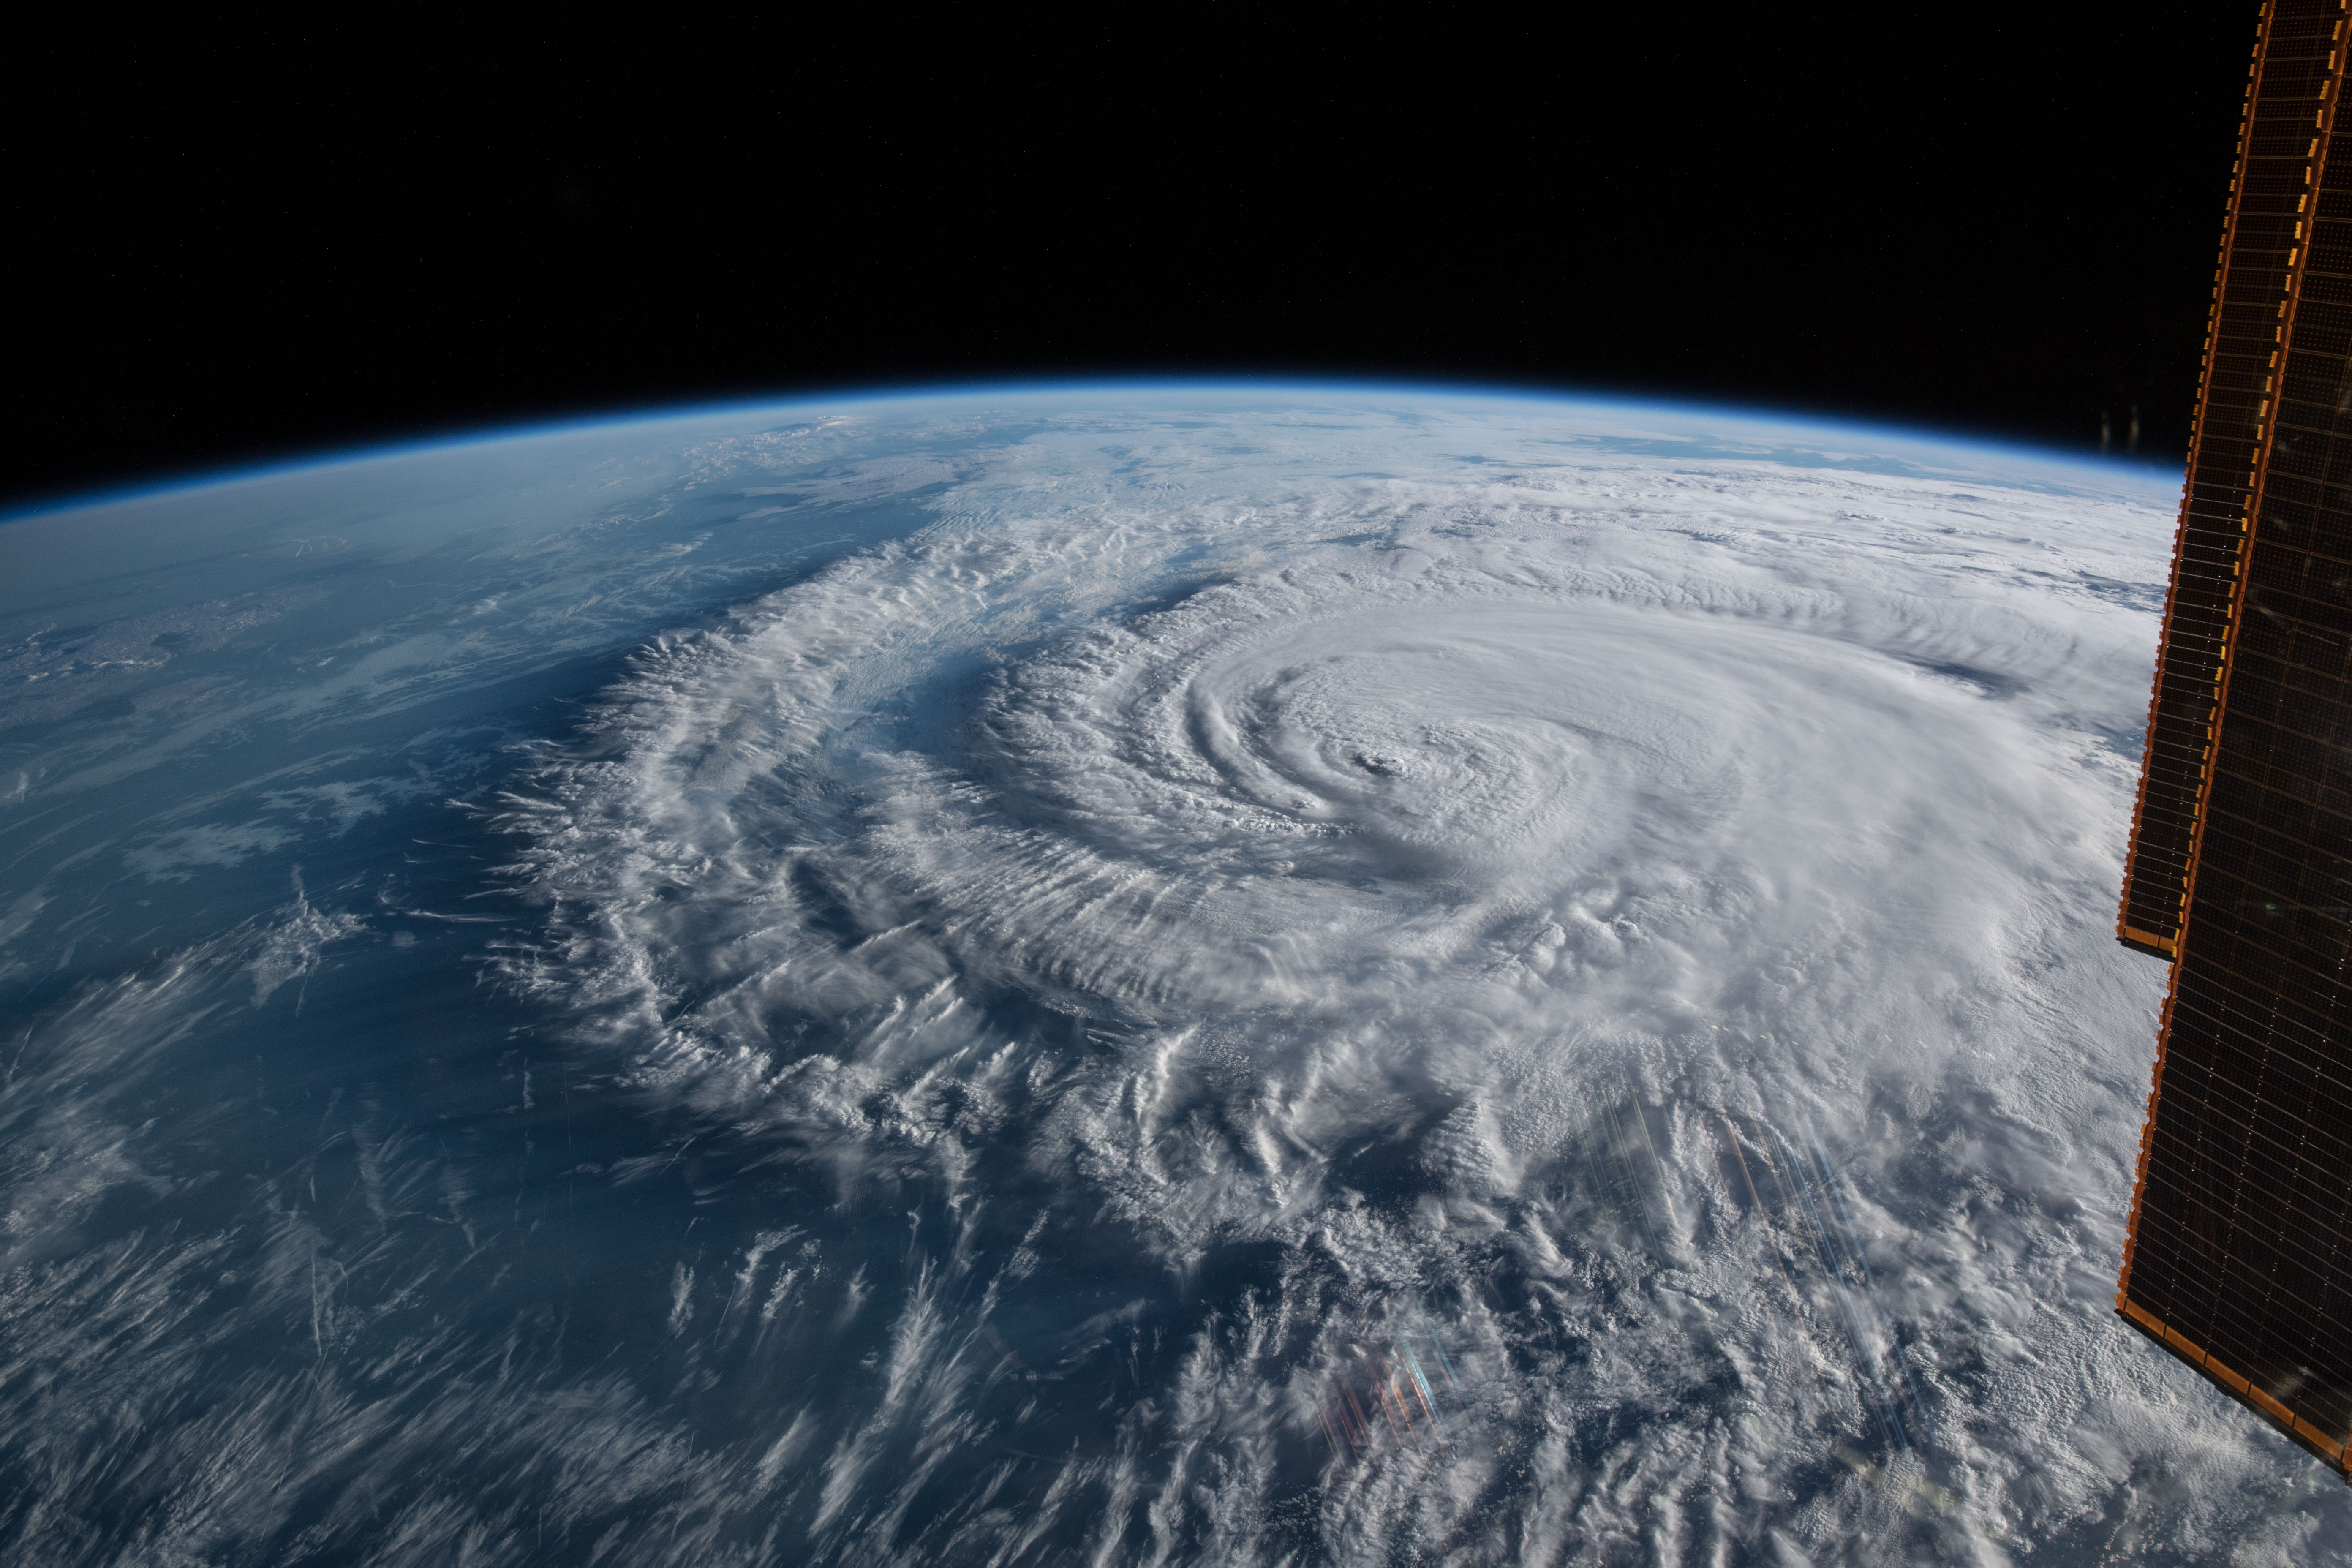
LinkViews of Hurricane Florence at Landfall
Cameras outside the International Space Station captured views of Hurricane Florence on Sept. 14 at 7:41 a.m. EDT minutes after the storm made landfall near Wrightsville Beach, North Carolina packing winds of 90 miles an hour. The National Hurricane Center said Florence is moving very slowly to the west at only 6 miles an hour, then is expected to turn to the southwest, increasing the threat for historic storm surge and catastrophic flooding to coastline areas and inland cities in North Carolina and South Carolina.
Go to this link Link
LinkLandfall of Hurricane Michael from Space
Cameras outside the International Space Station captured views of Hurricane Michael at 12:58 p.m. EDT Oct. 10 from an altitude of 255 miles as the storm made landfall as a category 4 hurricane over the Florida panhandle. The National Hurricane Center reported maximum sustained winds near 150 mph with the potential to bring dangerous storm surge and heavy rains to the Florida panhandle area.
Go to this link- ID: 30628 Hyperwall Visual
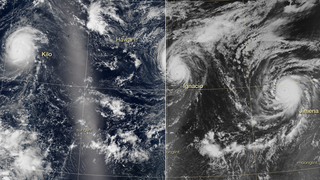
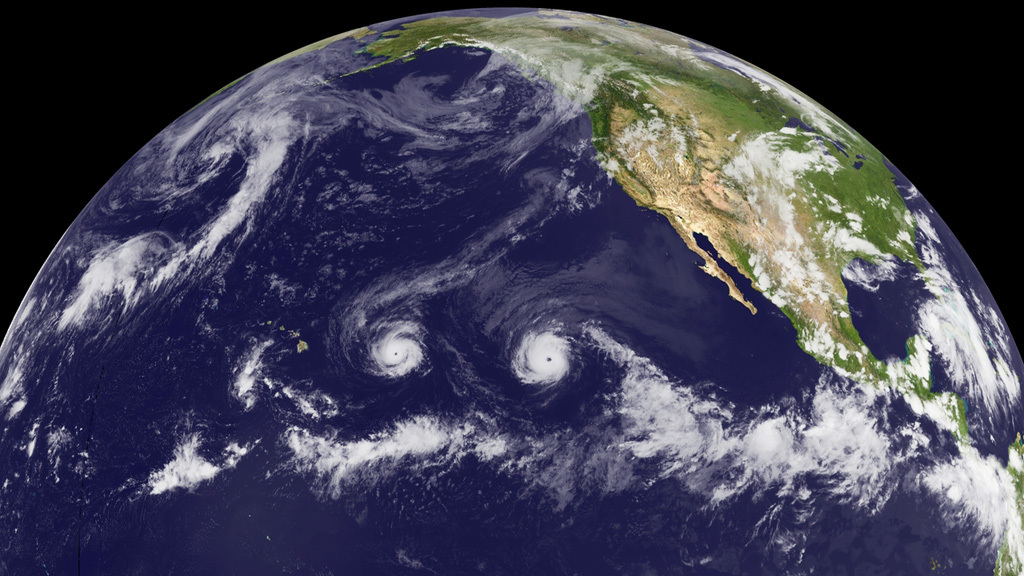
Trio of Hurricanes Over the Pacific Ocean
Go to this pageTrio of Hurricanes Over the Pacific Ocean || three_storms_preview.jpg (4104x2304) [6.7 MB] || three_storms_preview_thm.png (80x40) [27.1 KB] || three_storms_preview_searchweb.png (180x320) [150.8 KB] || three_storms_night_1080p.mp4 (1920x1080) [9.0 MB] || three_storms_night_720p.mp4 (1280x720) [4.5 MB] || three_storms_night_720p.webm (1280x720) [5.7 MB] || three_storms_night_2304p.mp4 (4096x2304) [31.8 MB] || three_storms_night_360p.mp4 (640x360) [1.4 MB] || 4104x2304_16x9_30p (4104x2304) [0 Item(s)] || three_storms_night_30628.pptx [35.0 MB] || three_storms_night_30628.key [37.6 MB] ||
- ID: 12359 Produced Video
Hurricane Watch
Go to this pageNASA tracks two storms churning in the Pacific Ocean. || c-1024.jpg (1024x576) [252.8 KB] || c-1280.jpg (1280x720) [365.3 KB] || c-1024_print.jpg (1024x576) [259.2 KB] || c-1024_searchweb.png (320x180) [100.0 KB] || c-1024_web.png (320x180) [100.0 KB] || c-1024_thm.png (80x40) [7.4 KB] ||
- Section
Hurricane Crossing
Go to this sectionNASA observes three powerful storms simultaneously whipping across the Pacific Ocean.
- ID: 11904 Produced Video

Tropical Storm Bill
Go to this pageExplore views of the storm taken from space. || c-1280.jpg (1280x720) [298.8 KB] || c-1024.jpg (1024x576) [209.9 KB] || c-1024_print.jpg (1024x576) [200.5 KB] || c-1024_searchweb.png (320x180) [109.2 KB] || c-1024_thm.png (80x40) [24.5 KB] ||
- ID: 11715 Produced Video
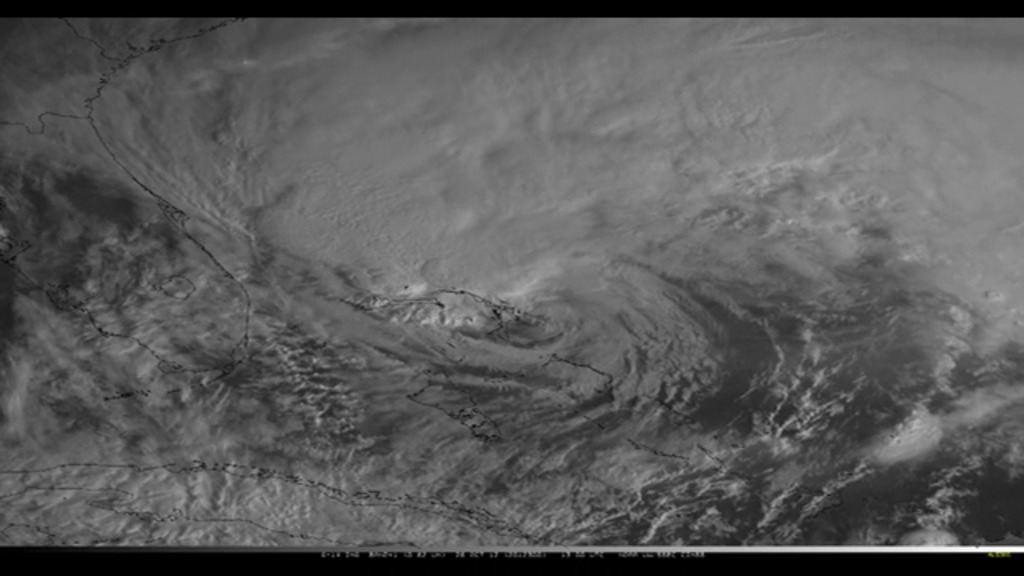
GOES-14 Scans Superstorm Sandy
Go to this pageCredit: NOAA || Sandy_Movie_GOES_R_nasaportal_print.jpg (1024x576) [91.8 KB] || Sandy_Movie_GOES_R_nasaportal_searchweb.png (320x180) [51.5 KB] || Sandy_Movie_GOES_R_nasaportal_web.png (320x180) [51.5 KB] || Sandy_Movie_GOES_R_nasaportal_thm.png (80x40) [4.3 KB] || Sandy_Movie_GOES_R_720x480.webmhd.webm (960x540) [15.3 MB] || Sandy_Movie_GOES_R_prores.mov (1280x720) [1.1 GB] || Sandy_Movie_GOES_R_youtube_hq.mov (1280x720) [114.7 MB] || Sandy_Movie_GOES_R_1280x720.wmv (1280x720) [37.4 MB] || Sandy_Movie_GOES_R_nasaportal.mov (640x360) [31.1 MB] || Sandy_Movie_GOES_R_ipod_lg.m4v (640x360) [11.7 MB] || Sandy_Movie_GOES_R_720x480.wmv (720x480) [35.0 MB] || Sandy_Movie_GOES_R_ipod_sm.mp4 (320x240) [5.9 MB] ||
- ID: 3852 Visualization
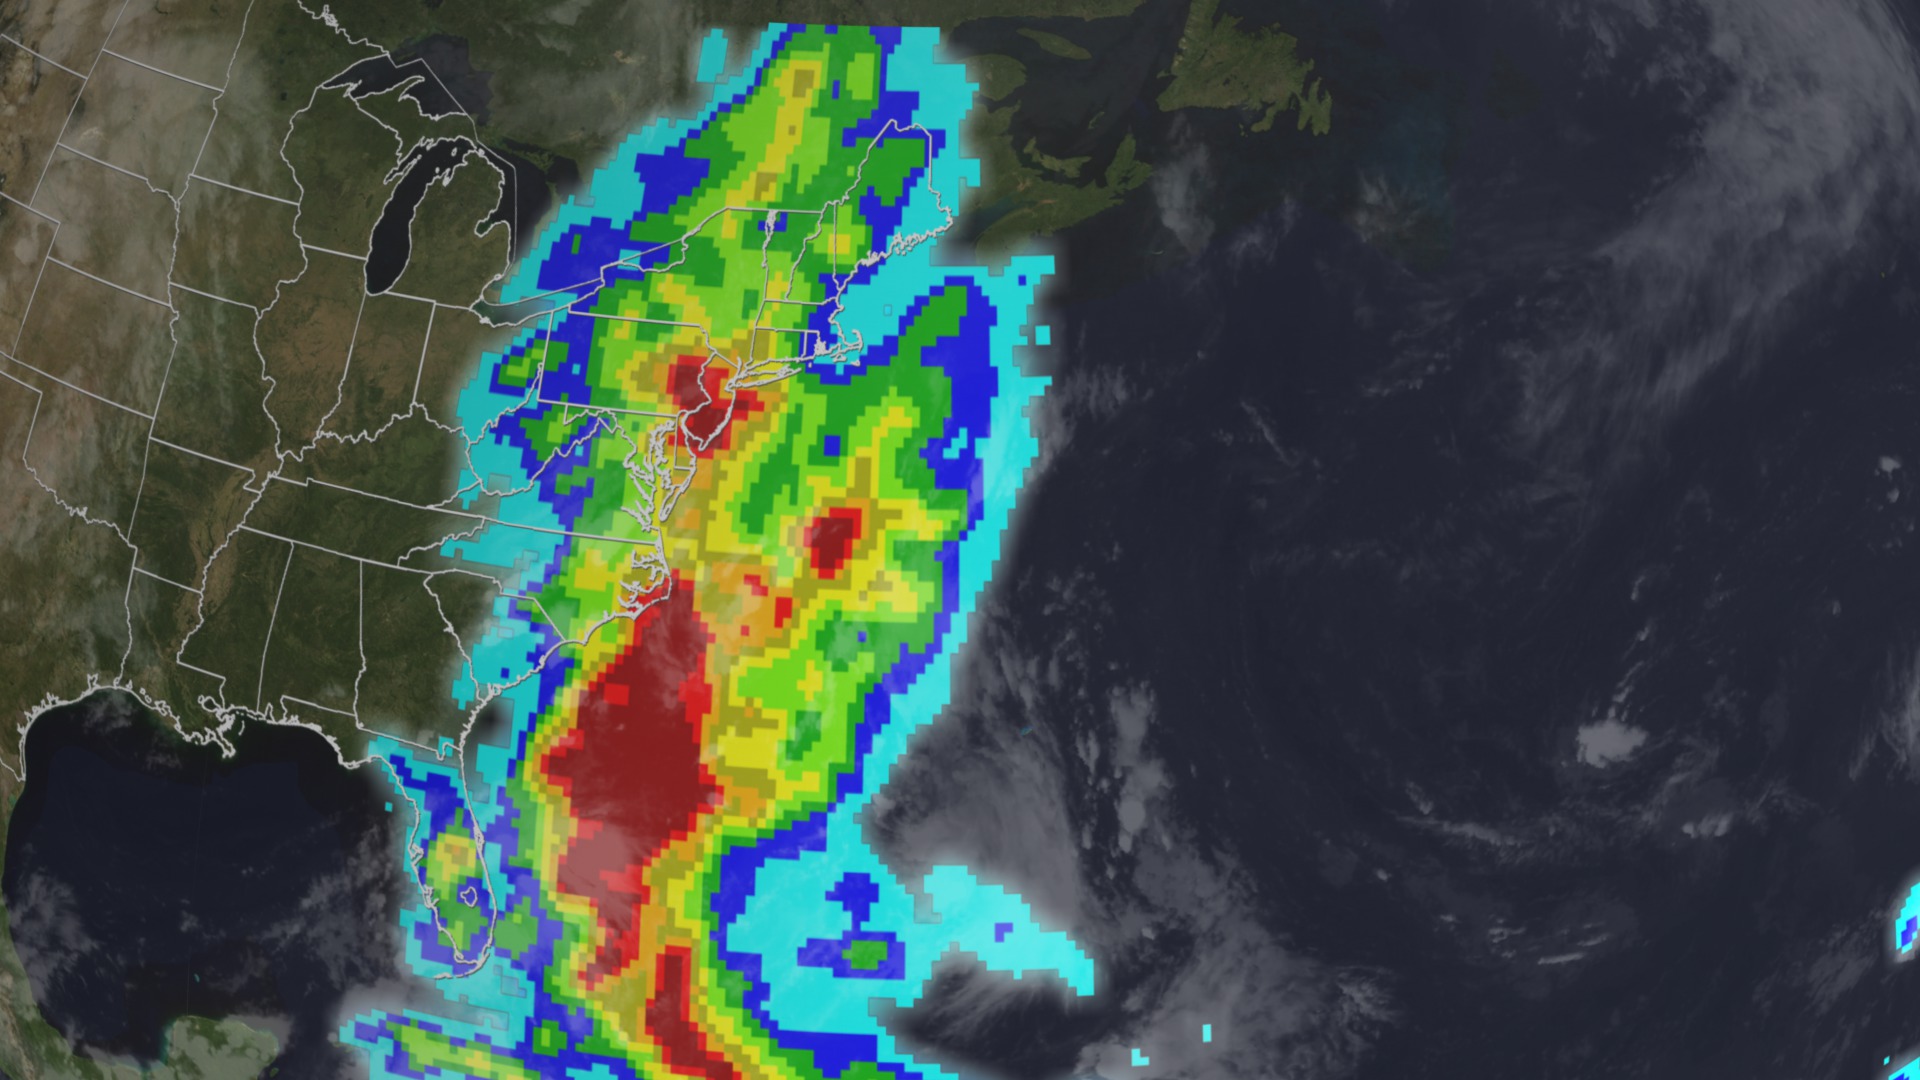
Hurricane Irene
Go to this pageThis visualization follows the development of Hurricane Irene as it moves up the East Coast of the United States in August of 2011. There are three versions of this visualization. Two of the versions follow the eye of the storm until it dissipates, then pulls back to reveal the rain fall accumulation track as measured by the Tropcical Rainfall Measuring Mission (TRMM) using two different color tables. The first version only includes rainfall along the storm track. The second and third versions include all rainfall. The third version shows the rainfall accumulating as the storm moves.These visualizations were created to support presenstations at the National Air and Space Museum (NASM) 2011. ||
Near Real-Time Global Precipitation
- ID: 4285 Visualization
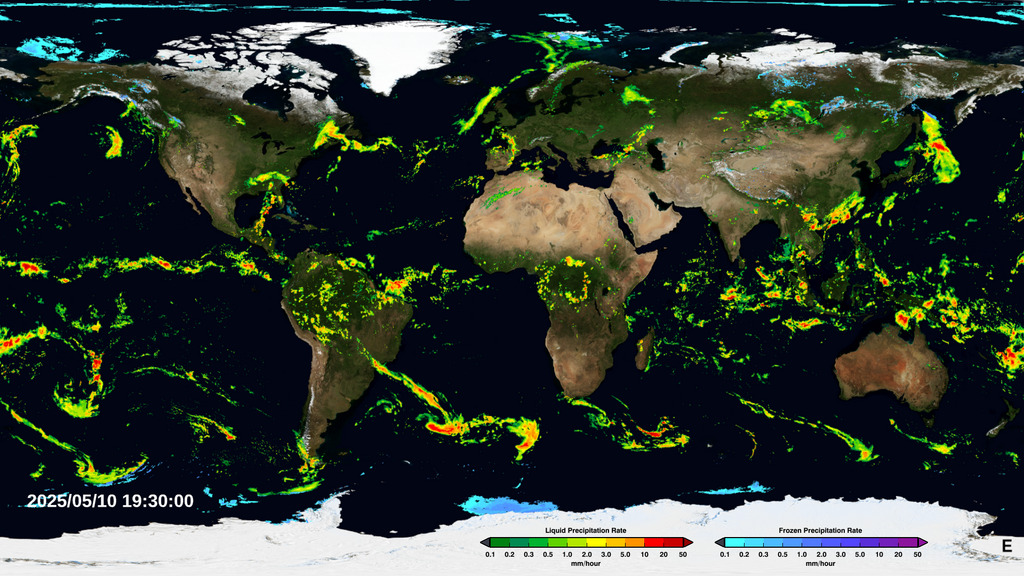
Near Real-Time Global Precipitation from the Global Precipitation Measurement Constellation
Go to this pageAn animation of the most currently available global precipitation data from IMERG.
Edited Features
- ID: 13216
![Complete transcript available.Music credits: “Northern Breeze” by Denis Levaillant [SACEM], “Stunning Horizon” by Maxime Lebidois [SACEM], Ronan Maillard [SACEM], “Magnetic Force” by JC Lemay [SACEM] from Killer TracksWatch this video on the NASA Goddard YouTube channel.This video can be freely shared and downloaded. While the video in its entirety can be shared without permission, some individual imagery provided by pond5.com is obtained through permission and may not be excised or remixed in other products. Specific details on stock footage may be found here. For more information on NASA’s media guidelines, visit https://www.nasa.gov/multimedia/guidelines/index.html.Notes on footage:• 0:03 - 0:17 provided by Pond5• 1:38 - 1.43 provided by Pond5• 1:49 - 1:52 provided by Pond5• 2:21 - 1:27 provided by Pond5](/vis/a010000/a013200/a013216/13216_NASA_Has_Eyes_On_The_Atlantic_Hurricane_Season_YouTube.00050_print.jpg) Produced Video
Produced Video - ID: 13151
 Produced Video
 - ID: 12590
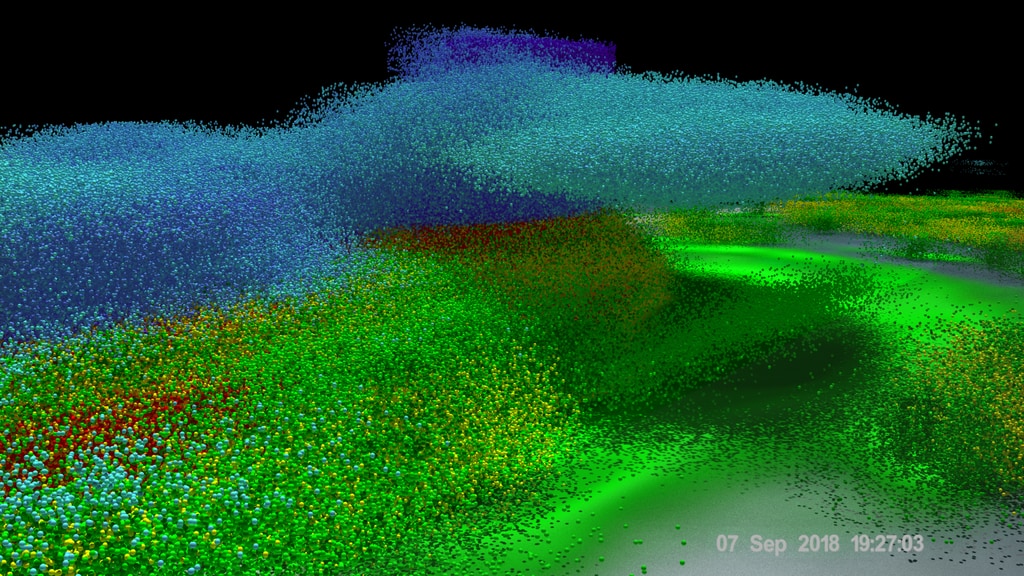
![To get a detailed look at vegetation and land cover, NASA uses an airborne instrument called Goddard’s Lidar, Hyperspectral and Thermal Airborne Imager, or G-LiHT. From the belly of a small aircraft flying one thousand feet above the trees, G-LiHT collects multiple measurements of forests, including high-resolution photographs, surface temperatures and the heights and structure of the vegetation. Watch this video on the NASA Goddard YouTube channel.Complete transcript available.Music: Letting the Past Go, by Ben Hales [PRS], Matt Hales [PRS]](/vis/a010000/a012500/a012590/12590_Puerto_Rico_lidar_youtube_1080.00248_print.jpg) Produced Video
Produced Video - ID: 4685Visualization
- ID: 12723
 Produced Video
 - ID: 12738
![Watch this video on the NASA Goddard YouTube channel.Complete transcript available.Music credits: 'Micro Currents' by Jean-Patrick Voindrot [SACEM], 'Sink Deep' by Andrew Michael Britton [PRS], David Stephen Goldsmith [PRS], Mikey Rowe [PRS] from Killer Tracks.](/vis/a010000/a012700/a012738/LARGE_MP4-12738_RapidIntensification_large.00084_print.jpg) Produced Video
Produced Video - ID: 12635
 Produced Video
 - ID: 12251
 Produced Video
 - ID: 12206
 Produced Video
 - ID: 12007
 Produced Video
 - ID: 3773
 Visualization
 - ID: 10829
 Produced Video
Spacecraft Animations
- ID: 4698 Visualization
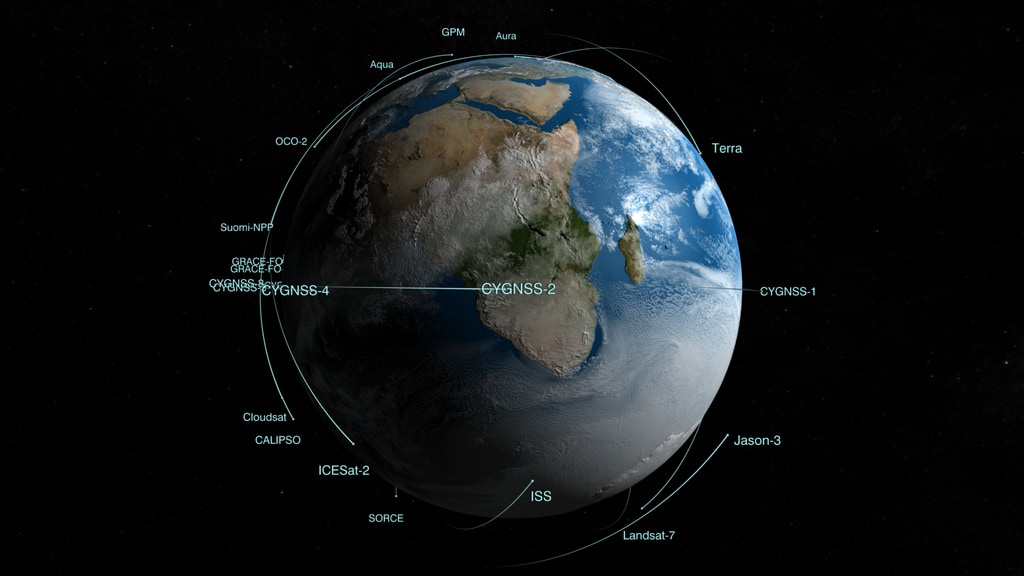
Earth Observing Fleet (October 2018)
Go to this pageNASA's Earth Science Fleet as of October 2018 || fleet201810_hd01.07410_print.jpg (1024x576) [71.1 KB] || fleet201810_hd01.07410_searchweb.png (320x180) [64.9 KB] || fleet201810_hd01.07410_thm.png (80x40) [4.8 KB] || 1920x1080_16x9_60p (1920x1080) [0 Item(s)] || fleet201810_hd01.webm (1920x1080) [51.8 MB] || fleet201810_hd01.mp4 (1920x1080) [229.8 MB] || 9600x3240_16x9_30p (9600x3240) [0 Item(s)] || fleet201810_hd01.mp4.hwshow [182 bytes] ||
- ID: 11392 Produced Video
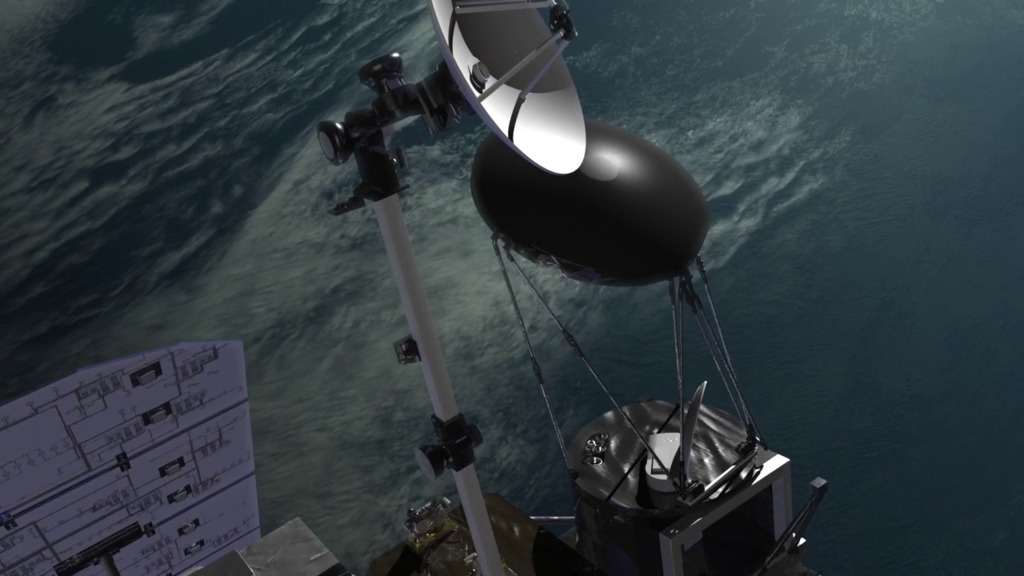
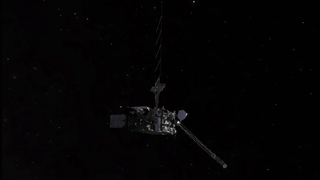
GPM Core Spacecraft Beauty Passes
Go to this pageA variety of animated beauty passes of the Global Precipitation Measurement (GPM) Core spacecraft. ||
- Section
GOES-R
Go to this sectionThe new generation GOES-R satellites will carry significant improvements and technology innovation on board. GOES-R will be able to deliver a full globe scan in only 5 minutes, compared to the 25 minutes needed for the same task with the current GOES satellites. GOES-R's lightning mapper instrument is expected to improve warning lead time for severe storms and tornadoes by 50%. This without a doubt will help predict severe weather in advance and save more lives. This reel is a compilation of finished productions about the GOES-R mission as well as supporting materials such as animations, visualizations, and still images.
- ID: 3971 Visualization
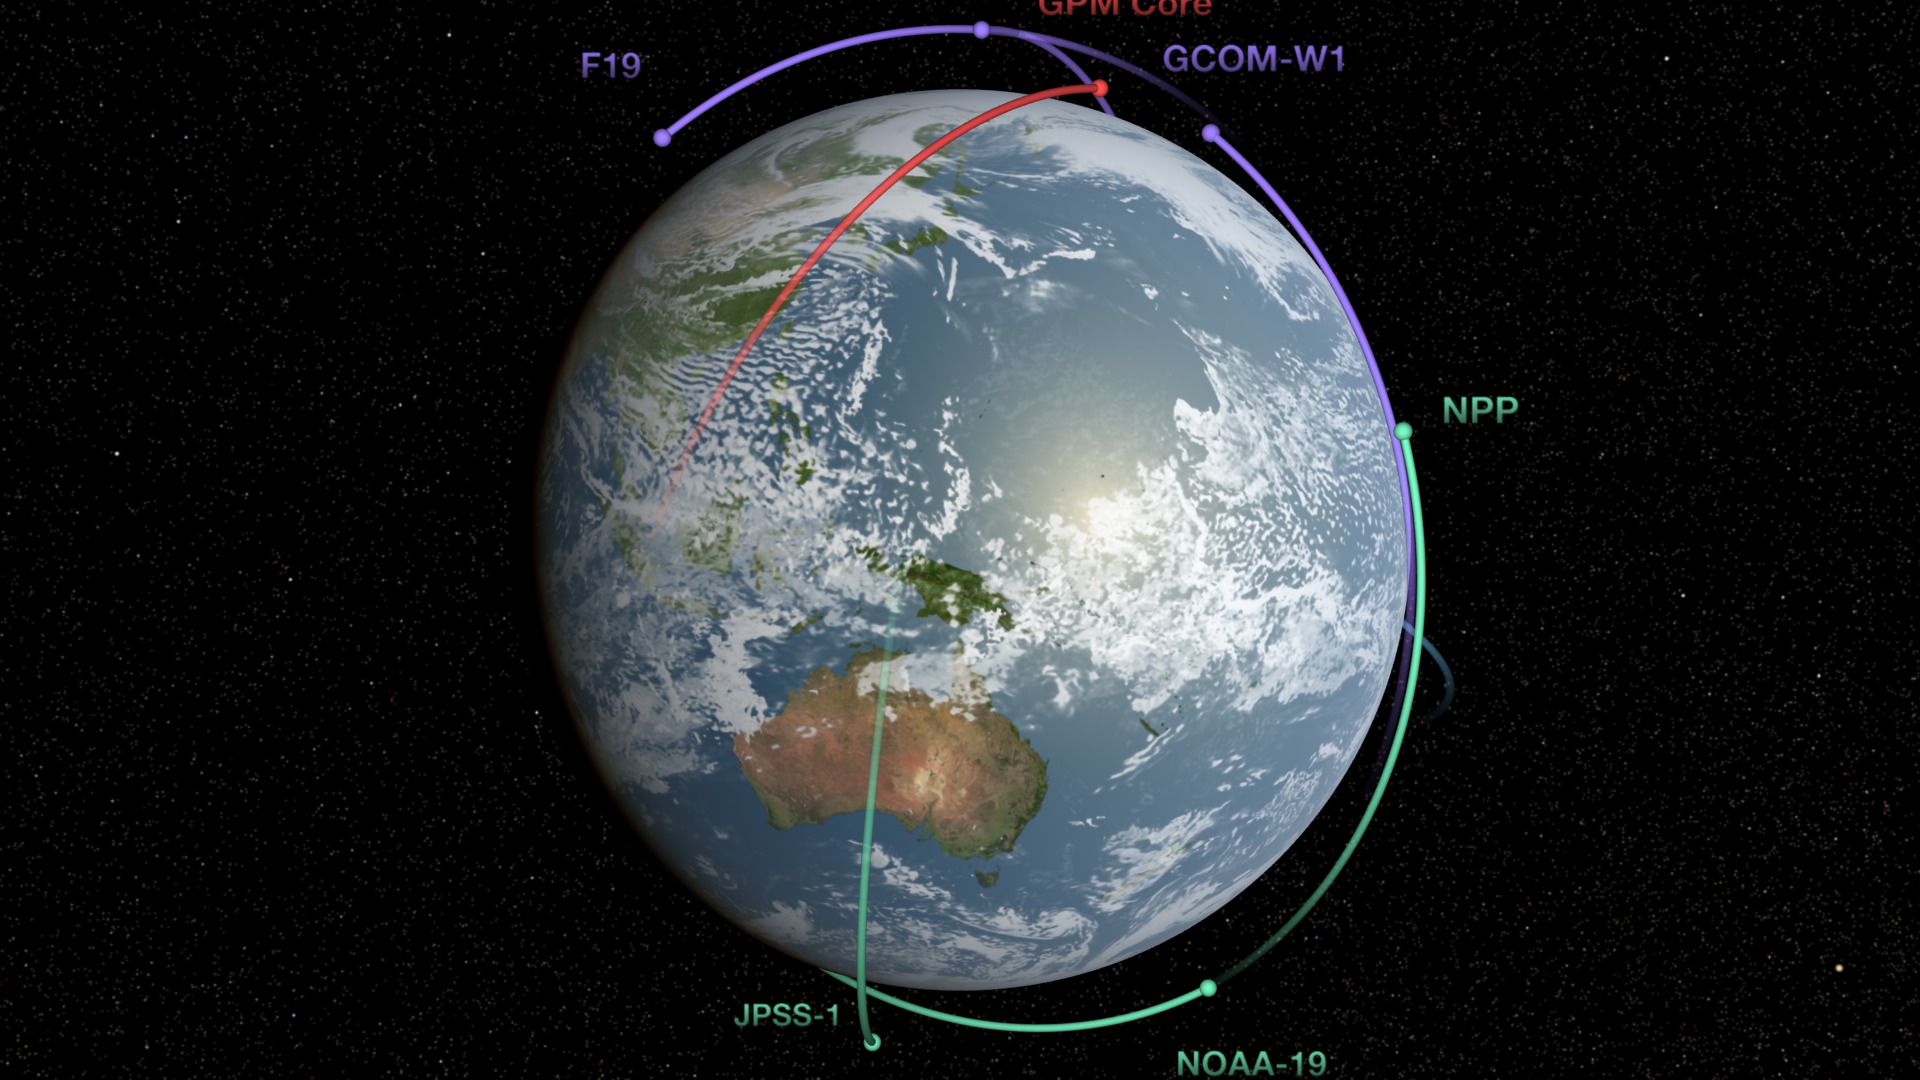
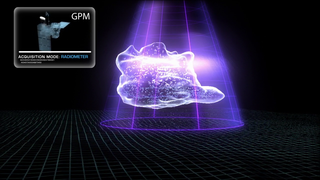
Global Precipitation Measurement (GPM) Constellation
Go to this pageNine U.S. and international satellites will soon be united by the Global Precipitation Measurement (GPM) mission, a partnership co-led by NASA and the Japan Aerospace Exploration Agency (JAXA). NASA and JAXA will provide the GPM Core satellite to serve as a reference for precipitation measurements made by this constellation of satellites, which will be combined into a single global dataset continually refreshed every three hours. While each partner satellite has its own mission objective, they all carry a type of instrument called a radiometer that measures radiated energy from rainfall and snowfall. The GPM Core satellite carries two instruments: a state-of-the-art radiometer called the GPM Microwave Imager (GMI) and the first space-borne Dual-frequency Precipitation Radar (DPR), which sees the 3D structure of falling rain and snow. The DPR and GMI work in concert to provide a unique database that will be used to improve the accuracy and consistency of measurements from all partner satellites, which will then be combined into the uniform global precipitation dataset. In this animation the orbit paths of the partner satellites of the GPM constellation fill in blue as the instruments pass over Earth. Rainfall appears light blue for light rain, yellow for moderate, and red for heavy rain. Partner satellites are traced in green and purple, and the GPM Core is traced in red. The GPM Core observatory is currently being built and tested at NASA's Goddard Space Flight Center in Greenbelt, Md. It is scheduled to launch from Tanegashima space center in Japan in early 2014. ||
More Resources
- ID: 40118 Gallery
Global Precipitation Measurement
Go to this pageThe Global Precipitation Measurement (GPM) mission is an international network of satellites that provide the next-generation global observations of rain and snow. Building upon the success of the Tropical Rainfall Measuring Mission (TRMM), the GPM concept centers on the deployment of a "Core" satellite carrying an advanced radar / radiometer system to measure precipitation from space and serve as a reference standard to unify precipitation measurements from a constellation of research and operational satellites. Through improved measurements of precipitation globally, the GPM mission helps to advance our understanding of Earth's water and energy cycle, improve forecasting of extreme events that cause natural hazards and disasters, and extend current capabilities in using accurate and timely information of precipitation to directly benefit society. GPM, initiated by NASA and the Japan Aerospace Exploration Agency (JAXA) as a global successor to TRMM, comprises a consortium of international space agencies, including the Centre National d'Études Spatiales (CNES), the Indian Space Research Organization (ISRO), the National Oceanic and Atmospheric Administration (NOAA), the European Organization for the Exploitation of Meteorological Satellites (EUMETSAT), and others. The GPM Core Observatory launched from Tanegashima Space Center, Japan, at 1:37 PM EST on February 27, 2014.For more information and resources please visit the Precipitation Measurement Missions web site.
- ID: 11874 Produced Video
Hurricane Resource Page
Go to this page2015 hurricane resource reelThis Reel Includes the Following Sections TRT 50:10Hurricane Overviews 1:02; Hurricane Arthur 15:07; Cyclone Pam 19:48; Typhoon Hagupit 21:27; Hurricane Bertha 22:03;Hurricanes Iselle and Julio 23:15; September 2014 Hurricane Alley 25:07; Satellite Beauty Passes 28:31; Hurricane Katrina 36:32; Global Portrait of Precipitation42:00; Typhoon Halong 42:36; Typhoon Maysak43:13; Superstorm Sandy 44:21;Hurricanes Fay and Gonzalo 45:29; RapidScat 46:12; CYGNSS 49:16Super(s): NASA;Center Contact: Rob Gutro 301-286-4044HQ Contact: Steve Cole 202-358-0918 || Screen_Shot_2015-05-29_at_3.46.48_PM_print.jpg (1024x573) [72.1 KB] || Screen_Shot_2015-05-29_at_3.46.48_PM.png (2542x1424) [1.7 MB] || Screen_Shot_2015-05-29_at_3.46.48_PM_searchweb.png (320x180) [59.9 KB] || Screen_Shot_2015-05-29_at_3.46.48_PM_thm.png (80x40) [8.0 KB] || G2015-043_Hurricane_RT_appletv.m4v (960x540) [1.0 GB] || G2015-043_Hurricane_RT_youtube_hq.mov (1280x720) [2.3 GB] || G2015-043_Hurricane_RT_prores.mov (1280x720) [45.6 GB] || G2015-043_Hurricane_RT_youtube_hq.webm (1280x720) [326.5 MB] || G2015-043_Hurricane_RT_ipod_lg.m4v (640x360) [422.3 MB] || G2015-043_Hurricane_RT_ipod_sm.mp4 (320x240) [192.7 MB] ||
- ID: 4285 Visualization
Near Real-Time Global Precipitation from the Global Precipitation Measurement Constellation
Go to this pageAn animation of the most currently available global precipitation data from IMERG.
- ID: 40248 Gallery
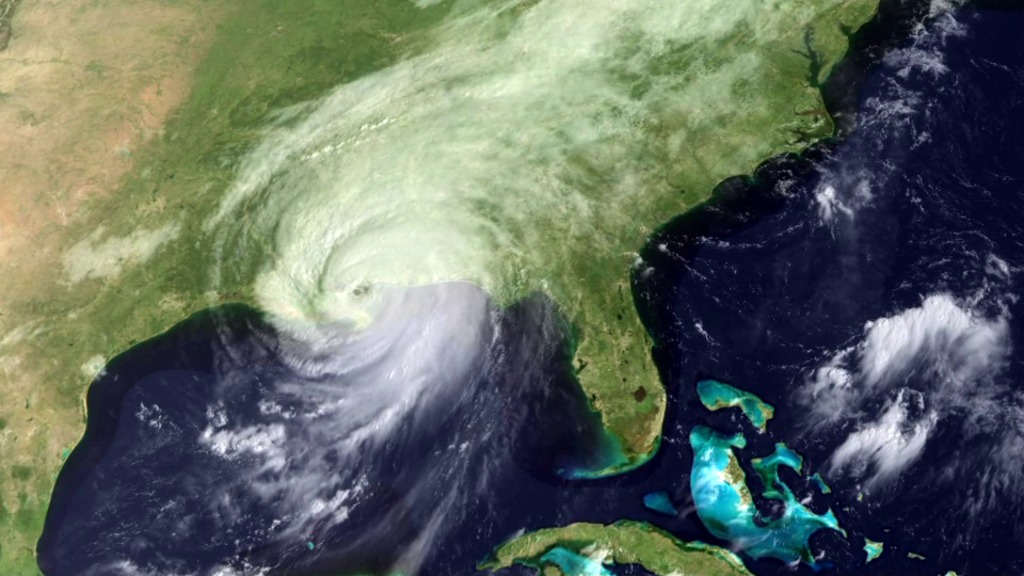
The View from Space: Data Visualizations of Hurricane Katrina
Go to this pageIn the last week of August 2005, what had originated as a disturbance off the western coast of Africa transformed into a devastating storm, ravaging the southern United States.
Water consumed the coast of the Gulf of Mexico, submerging chunks of Florida, Louisiana and Mississippi.
NASA’s satellites watched the devastation from overhead, sending down a deluge of data that scientists would study for years to come.
For more information about Hurricane Katrina:
http://www.nasa.gov/mission_pages/hurricanes/archives/2005/h2005_katrina.html
Visuals
- ID: 40029 Gallery
- ID: 40030 Gallery
- ID: 40043 Gallery