Earth
ID: 4949
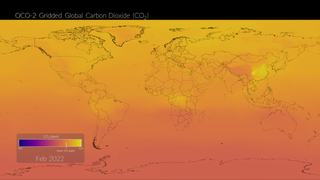
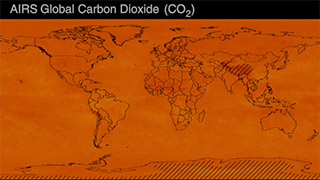
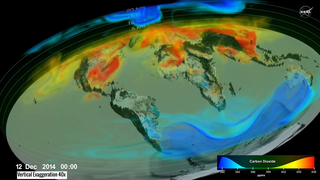
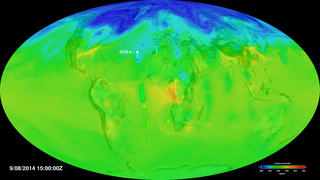
NASA’s Orbiting Carbon Observatory, 2 (OCO-2) provides the most complete dataset tracking the concentration of atmospheric carbon dioxide (CO2), the main driver of climate change. Every day, OCO-2 measures sunlight reflected from Earth’s surface to infer the dry-air column-averaged CO2 mixing ratio and provides around 100,000 cloud-free observations. Despite these advances, OCO-2 data contain many gaps where sunlight is not present or where clouds or aerosols are too thick to retrieve CO2 data. In order to fill gaps and provide science and applications users a spatially complete product, OCO-2 data are assimilated into NASA’s Goddard Earth Observing System (GEOS), a complex modeling and data assimilation system used for studying the Earth’s weather and climate. GEOS is also informed by satellite observations of nighttime lights and vegetation greenness along with about 1 million weather observations collected every hour. These data help scientists infer CO2 mixing ratios even when a direct OCO-2 observation is not present and provide additional information on the altitude of CO2 plumes that the satellite is not able to see. Together, OCO-2 and GEOS create one of the most complete pictures of CO2.
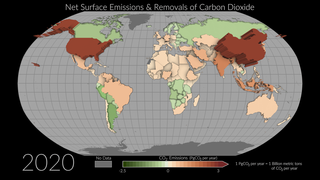
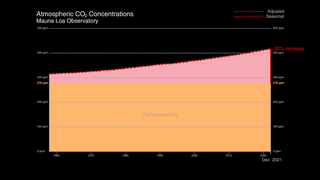
The visualization featured on this page shows the atmosphere in three dimensions and highlights the accumulation of CO2 during a single calendar year. Every year, the world’s vegetation and oceans absorb about half of human CO2 emissions, providing an incredibly valuable service that has mitigated the rate of accumulation of greenhouse gases in the atmosphere. However, around 2.5 parts per million remain in the atmosphere every year causing a steady upward march in concentrations that scientists have tracked since the 1950s at surface stations.
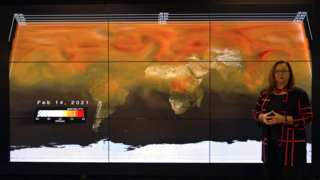
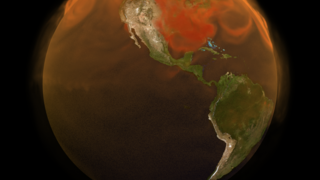
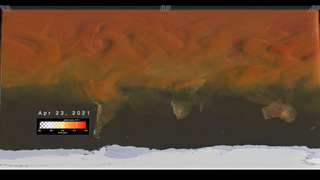
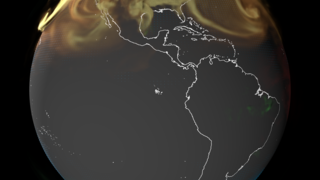
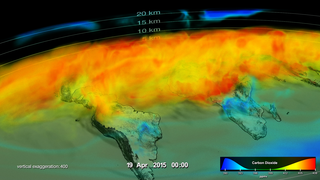
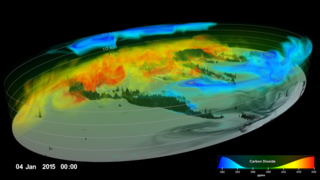
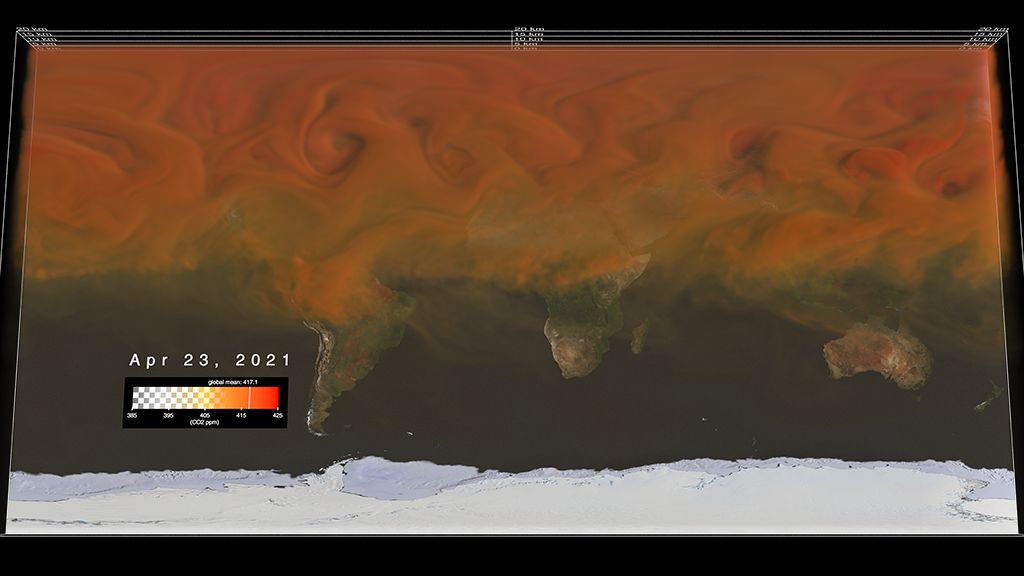
The volumetric visualization starts in June 2020, showing all of the model’s values of global CO2. All 3d cells of the model are opaque, revealing a solid brick of data. During the month of June 2020, the higher values of CO2 coalesce around the equatorial belt. By mid-July 2020 the visualization reduces the opacity of lower CO2 values between 385 parts-per-millon (ppm) and 405 ppm in the atmosphere making them transparent. These lower values tend to be higher up in the atmosphere. By doing this, the higher CO2 concentrations, which are closer to the ground, are highlighted revealing the seasonal movement of high CO2 at a global scale. During the months of June-September (summer months for northern hemisphere), global CO2 concentrations tend to be lowest because northern hemisphere plants actively absorb CO2 from the atmosphere via photosynthesis. During northern hemisphere fall and winter months, much of this CO2 is re-released to the atmosphere due to respiration and can be seen building up. By June and July 2021, plants again draw CO2 out of the atmosphere, but notably higher concentrations remain in contrast to the nearly transparent colors of the previous year. The diurnal rhythm of CO2 is apparent over our planet's largest forests, such as the Amazon rainforest in South America and the Congo rainforest in Central Africa. The fast-paced pulse in those rainforests is due to the day-night cycle; plants absorb CO2 during the day via photosynthesis when the sun is out, then stop absorbing CO2 at night. In addition to highlighting the buildup of atmospheric CO2, this visualization shows how interconnected the world’s greenhouse gas problem is. NASA’s unique combination of observations and models plays a critical role in helping scientists track increases in CO2 as they happen to better understand their climate impact.
This visualization was created specifically to support a series of talks from NASA scientists for the 2021 United Nations Climate Change Conference (COP26), Glasgow, UK, 31 October-12 November 2021.
Data Sources:
Global Carbon Dioxide 2020-2021
There is a newer version of this story located here: https://svs.gsfc.nasa.gov/5115
The visualization featured on this page shows the atmosphere in three dimensions and highlights the accumulation of CO2 during a single calendar year. Every year, the world’s vegetation and oceans absorb about half of human CO2 emissions, providing an incredibly valuable service that has mitigated the rate of accumulation of greenhouse gases in the atmosphere. However, around 2.5 parts per million remain in the atmosphere every year causing a steady upward march in concentrations that scientists have tracked since the 1950s at surface stations.
The volumetric visualization starts in June 2020, showing all of the model’s values of global CO2. All 3d cells of the model are opaque, revealing a solid brick of data. During the month of June 2020, the higher values of CO2 coalesce around the equatorial belt. By mid-July 2020 the visualization reduces the opacity of lower CO2 values between 385 parts-per-millon (ppm) and 405 ppm in the atmosphere making them transparent. These lower values tend to be higher up in the atmosphere. By doing this, the higher CO2 concentrations, which are closer to the ground, are highlighted revealing the seasonal movement of high CO2 at a global scale. During the months of June-September (summer months for northern hemisphere), global CO2 concentrations tend to be lowest because northern hemisphere plants actively absorb CO2 from the atmosphere via photosynthesis. During northern hemisphere fall and winter months, much of this CO2 is re-released to the atmosphere due to respiration and can be seen building up. By June and July 2021, plants again draw CO2 out of the atmosphere, but notably higher concentrations remain in contrast to the nearly transparent colors of the previous year. The diurnal rhythm of CO2 is apparent over our planet's largest forests, such as the Amazon rainforest in South America and the Congo rainforest in Central Africa. The fast-paced pulse in those rainforests is due to the day-night cycle; plants absorb CO2 during the day via photosynthesis when the sun is out, then stop absorbing CO2 at night. In addition to highlighting the buildup of atmospheric CO2, this visualization shows how interconnected the world’s greenhouse gas problem is. NASA’s unique combination of observations and models plays a critical role in helping scientists track increases in CO2 as they happen to better understand their climate impact.
This visualization was created specifically to support a series of talks from NASA scientists for the 2021 United Nations Climate Change Conference (COP26), Glasgow, UK, 31 October-12 November 2021.
Data Sources:
- Volumetric Carbon Dioxide extracted from NASA's Goddard Earth Observing System (GEOS) model, which is produced by the Global Modeling and Assimilation Office. The visualization featured on this page utilizes 3-hourly data for the period June 1, 2020-July 31, 2021.
- Blue Marble: Next Generation was produced by Reto Stöckli, NASA Earth Observatory (NASA Goddard Space Flight Center). Citation: Reto Stöckli, Eric Vermote, Nazmi Saleous, Robert Simmon and David Herring.
The Blue Marble Next Generation – A true color earth dataset including seasonal dynamics from MODIS, October 17, 2005. The visualization on this page utilizes monthly Blue Marble data to map the water and land bodies around the globe and show seasonal changes. - Sea ice for the Arctic and Antarctic regions, provided by the Japan Aerospace Exploration Agency (JAXA), by utilizing GCOMP-W/AMSR2 10 km Level 3 daily Sea Ice Concentration (SIC) and GCOMP-W/AMSR2 10 km Level 3 daily 89 GHz Brightness Temperature (BT) data for the period June 1, 2020-July 31, 2021.
- Global 30 Arc-Second Elevation (GTOPO 30) from U.S. Geological Survey (USGS). GTOPO30 is a global raster digital elevation model (DEM) with a horizontal grid spacing of 30 arc seconds (approximately 1 kilometer). GTOPO30 was derived from several raster and vector sources of topographic information. The data-driven visualization featured on this page utilizes the GTOPO30 model to represent the three-dimensional features of over land terrain and submarine topography world-wide. doi: 10.5066/F7DF6PQS.
Used Elsewhere In
Newer Version
Alternate Version
Related
Visualization Credits
Andrew J Christensen (SSAI): Lead Visualizer
Helen-Nicole Kostis (USRA): Lead Visualizer
Greg Shirah (NASA/GSFC): Visualizer
Horace Mitchell (NASA/GSFC): Visualizer
Mark SubbaRao (NASA/GSFC): Lead Producer
Lesley Ott (NASA/GSFC): Lead Scientist
Brad Weir (USRA): Lead Scientist
Laurence Schuler (ADNET Systems, Inc.): Technical Support
Ian Jones (ADNET Systems, Inc.): Technical Support
Eric Sokolowsky (Global Science and Technology, Inc.): Technical Support
Please give credit for this item to:
NASA's Scientific Visualization Studio
NASA's Scientific Visualization Studio
Science Paper:
Weir, B., D. Crisp, C. W. O’Dell, S. Basu, A. Chatterjee, J. Kolassa, T. Oda, S. Pawson, B. Poulter, Z. Zhang, P. Ciais, S. J. Davis, Z. Liu, and L. E. Ott (2020), Regional Impacts of COVID-19 on carbon dioxide detected worldwide from space, Science Advances, doi: 10.1126/sciadv.abf9415
Short URL to share this page:
https://svs.gsfc.nasa.gov/4949
Mission:
Orbiting Carbon Observatory 2 (OCO-2)
Data Used:
Note: While we identify the data sets used in these visualizations, we do not store any further details nor the data sets themselves on our site.
Keywords:
DLESE >> Atmospheric science
SVS >> Carbon Dioxide
SVS >> Volume
GCMD >> Earth Science >> Human Dimensions >> Environmental Impacts
GCMD >> Earth Science >> Atmosphere >> Atmospheric Chemistry/Carbon and Hydrocarbon Compounds >> Carbon Dioxide
SVS >> Model Data
SVS >> Hyperwall
SVS >> GMAO
SVS >> Atmospheric Science
NASA Science >> Earth
SVS >> 4K
NASA Earth Science Focus Areas >> Atmospheric Composition
NASA Earth Science Focus Areas >> Carbon Cycle and Ecosystems
GCMD keywords can be found on the Internet with the following citation: Olsen, L.M., G. Major, K. Shein, J. Scialdone, S. Ritz, T. Stevens, M. Morahan, A. Aleman, R. Vogel, S. Leicester, H. Weir, M. Meaux, S. Grebas, C.Solomon, M. Holland, T. Northcutt, R. A. Restrepo, R. Bilodeau, 2013. NASA/Global Change Master Directory (GCMD) Earth Science Keywords. Version 8.0.0.0.0
Weir, B., D. Crisp, C. W. O’Dell, S. Basu, A. Chatterjee, J. Kolassa, T. Oda, S. Pawson, B. Poulter, Z. Zhang, P. Ciais, S. J. Davis, Z. Liu, and L. E. Ott (2020), Regional Impacts of COVID-19 on carbon dioxide detected worldwide from space, Science Advances, doi: 10.1126/sciadv.abf9415
Short URL to share this page:
https://svs.gsfc.nasa.gov/4949
Mission:
Orbiting Carbon Observatory 2 (OCO-2)
Data Used:
GTOPO30 Topography and Bathymetry
Data Compilation - USGSTerra and Aqua/MODIS/Blue Marble: Next Generation also referred to as: BMNG
Credit:
The Blue Marble data is courtesy of Reto Stockli (NASA/GSFC).
The Blue Marble data is courtesy of Reto Stockli (NASA/GSFC).
SHIZUKU (GCOM-W1)/AMSR2/10 km Daily Sea Ice Concentration
Observed Data - Japan Aerospace Exploration Agency
Credit:
AMSR2 data courtesy of the Japan Aerospace Exploration Agency (JAXA).
AMSR2 data courtesy of the Japan Aerospace Exploration Agency (JAXA).
SHIZUKU (GCOM-W1)/AMSR2/10 km Daily 89 GHz Brightness Temperature
Observed Data - Japan Aerospace Exploration Agency
Credit:
AMSR2 data courtesy of the Japan Aerospace Exploration Agency (JAXA).
AMSR2 data courtesy of the Japan Aerospace Exploration Agency (JAXA).
GEOS Carbon Dioxide
Model - GMAOKeywords:
DLESE >> Atmospheric science
SVS >> Carbon Dioxide
SVS >> Volume
GCMD >> Earth Science >> Human Dimensions >> Environmental Impacts
GCMD >> Earth Science >> Atmosphere >> Atmospheric Chemistry/Carbon and Hydrocarbon Compounds >> Carbon Dioxide
SVS >> Model Data
SVS >> Hyperwall
SVS >> GMAO
SVS >> Atmospheric Science
NASA Science >> Earth
SVS >> 4K
NASA Earth Science Focus Areas >> Atmospheric Composition
NASA Earth Science Focus Areas >> Carbon Cycle and Ecosystems
GCMD keywords can be found on the Internet with the following citation: Olsen, L.M., G. Major, K. Shein, J. Scialdone, S. Ritz, T. Stevens, M. Morahan, A. Aleman, R. Vogel, S. Leicester, H. Weir, M. Meaux, S. Grebas, C.Solomon, M. Holland, T. Northcutt, R. A. Restrepo, R. Bilodeau, 2013. NASA/Global Change Master Directory (GCMD) Earth Science Keywords. Version 8.0.0.0.0


