Assimilation of OCO-2 Carbon Dioxide into the GEOS Simulation
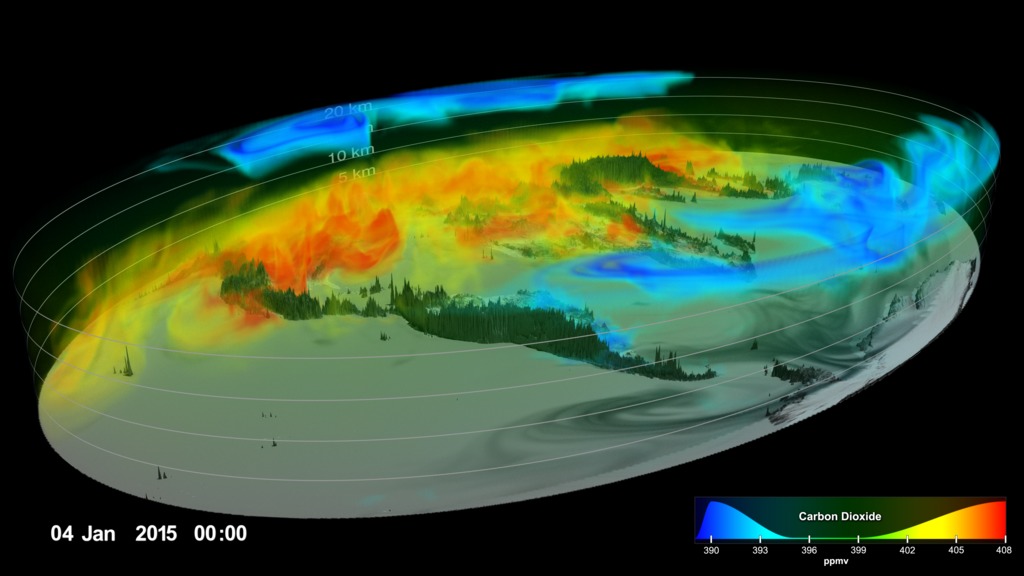
This visualization starts by showing carbon dioxide values (colored squares) being measured by the OCO-2 sensor. Soon the total carbon dioxide from the GEOS global atmosphere simulation is shown under the OCO-2 data. Every six hours, the OCO-2 measurements are used to adjust the GEOS simulation values to agree with observed values at those locations, a process called data assimilation. In order to see this process, look for locations where OCO-2 values are shortly followed by local changes in the background data. Carbon dioxide is shown in parts per million by volume (ppmv).
This video is also available on our YouTube channel.
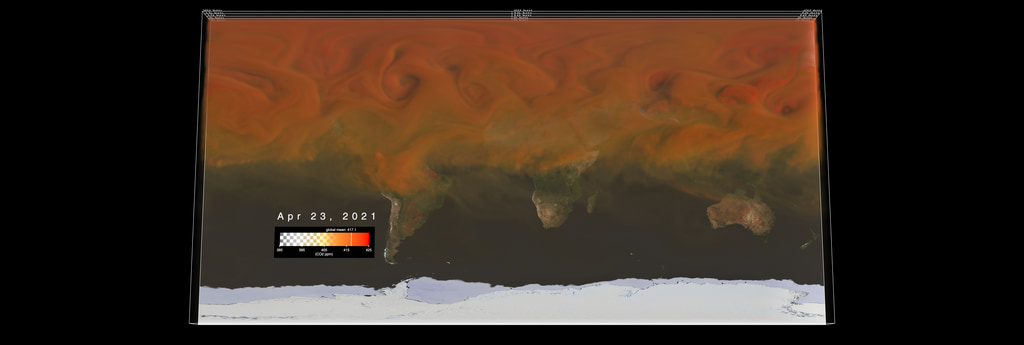
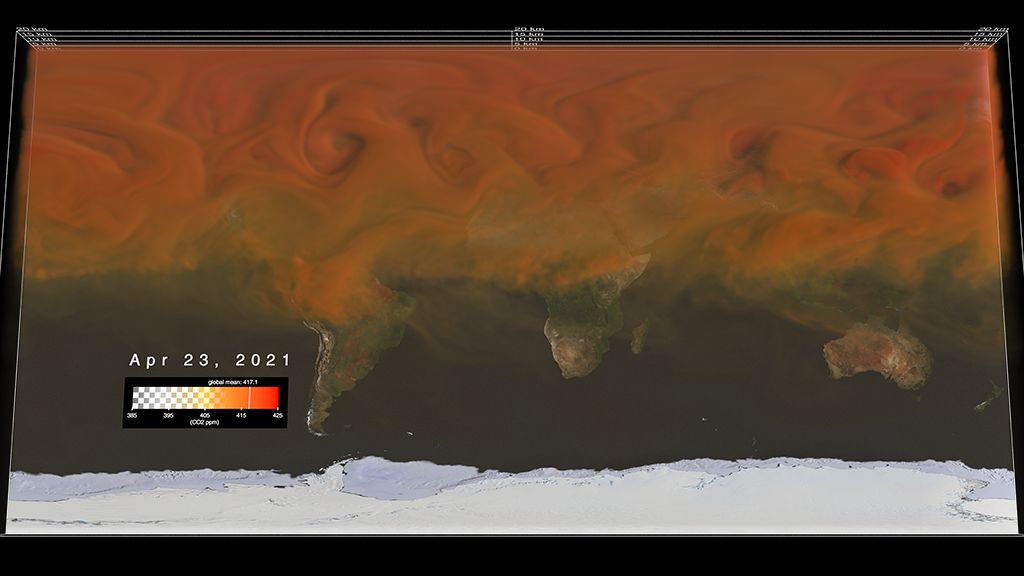
Carbon dioxide is the most important greenhouse gas released to the atmosphere through human activities. It is also influenced by natural exchange with the land and ocean. This visualization shows column-averaged atmospheric carbon dioxide concentrations from September 8, 2014 to August 31, 2015, every 3 hours. It was created using output from the GEOS modeling system, developed and maintained by scientists at NASA. Measurements of carbon dioxide from NASA’s second Orbiting Carbon Observatory (OCO-2) spacecraft are incorporated into the model to update, or “correct,” the model results, producing a realistic and high-resolution global picture of atmospheric carbon dioxide. This process of updating the model with real-world measurements is called data assimilation.
In the beginning of the visualization, observations from the OCO-2 spacecraft (square data points) are overlaid on the model results. Typically the amount of carbon dioxide measured by OCO-2 is very close to the amount that the model predicts over a particular spot on Earth, though sometimes amounts are noticeably different. If you watch these spots closely, the next time the model is updated, you will notice that the amount of carbon dioxide the model predicts is closer to the amount previously observed by OCO-2.
For decades, scientists have measured carbon dioxide at remote surface sites, but carbon dioxide is particularly difficult to measure from space because a very high degree of accuracy is needed to measure the gradients associated with emissions and weather systems. The OCO-2 mission collects about 100,000 usable, high-precision, total column measurements of carbon dioxide (from the sensor to Earth’s surface) each day, greatly increasing the number of observations available. While scientists learn a great deal from studying data from OCO-2 alone, numerical modeling and data assimilation capabilities allow them to combine different types of measurements (e.g., carbon dioxide and wind measurements) from various sources (e.g., satellites, aircraft, and ground-based observation sites) to study how carbon dioxide behaves in the atmosphere, where it is being emitted and removed from the atmosphere, and how much atmospheric carbon dioxide comes from natural processes and human activities. Studies like these that combine models and observations can help scientist make more realistic projections of how Earth’s climate might respond to increases in carbon dioxide in the future.
Carbon dioxide variations are largely controlled by fossil fuel emissions and seasonal fluxes of carbon between the atmosphere and land biosphere. For example, dark red and orange shades represent regions where carbon dioxide concentrations are enhanced by carbon sources. During Northern Hemisphere fall and winter, when trees and plants begin to lose their leaves and decay, carbon dioxide is released in the atmosphere. This, combined with fewer trees and plants removing carbon dioxide from the atmosphere, allows concentrations to climb all winter, reaching a peak by early spring. During Northern Hemisphere spring and summer months, plants absorb a substantial amount of carbon dioxide through photosynthesis, thus removing it from the atmosphere. While seasonal variations are most noticeable in this visualization, it is important to note that fossil fuel combustion and other human activities continue to increase the atmospheric carbon dioxide abundance to unprecedented levels—raising concerns about greenhouse-gas-induced climate change.

The color scale for carbon dioxide values in the visualization.
Credits
Please give credit for this item to:
NASA's Scientific Visualization Studio
-
Visualizer
- Horace Mitchell (NASA/GSFC)
-
Scientists
- Steven Pawson (NASA/GSFC)
-
Lesley Ott
(NASA/GSFC)

- Brad Weir (Morgan State University)
-
Writer
- Heather Hanson (Global Science and Technology, Inc.)
Datasets used
-
OCO-2 (Carbon Dioxide) [Orbiting Carbon Observatory-2: OCO-2]
ID: 902 -
GEOS Carbon Dioxide
ID: 962
Note: While we identify the data sets used on this page, we do not store any further details, nor the data sets themselves on our site.
Related
- ID: 4983
 Visualization
 - ID: 4949
 Visualization
 - ID: 4514
 Visualization
Release date
This page was originally published on Friday, December 9, 2016.
This page was last updated on Sunday, February 2, 2025 at 10:29 PM EST.