IceBridge images of crack in Larsen C Ice Shelf
Flying low over the Earth’s southernmost continent, Operation IceBridge is wrapping up its eighth consecutive field season of mapping the ice sheet and glaciers of Antarctica, as well as the surrounding sea ice. With more than 300 hours logged in the air over 24 science flights, the mission is considering 2016 one of the most successful seasons yet.
Operation IceBridge, a NASA airborne survey of changes in polar ice, recently completed its eighth consecutive Antarctic deployment. This page contains a wrapup video for the entire mission, as well as some footage over the Antarctic Peninsula's Larsen C Ice Shelf, and a few high definition still images.
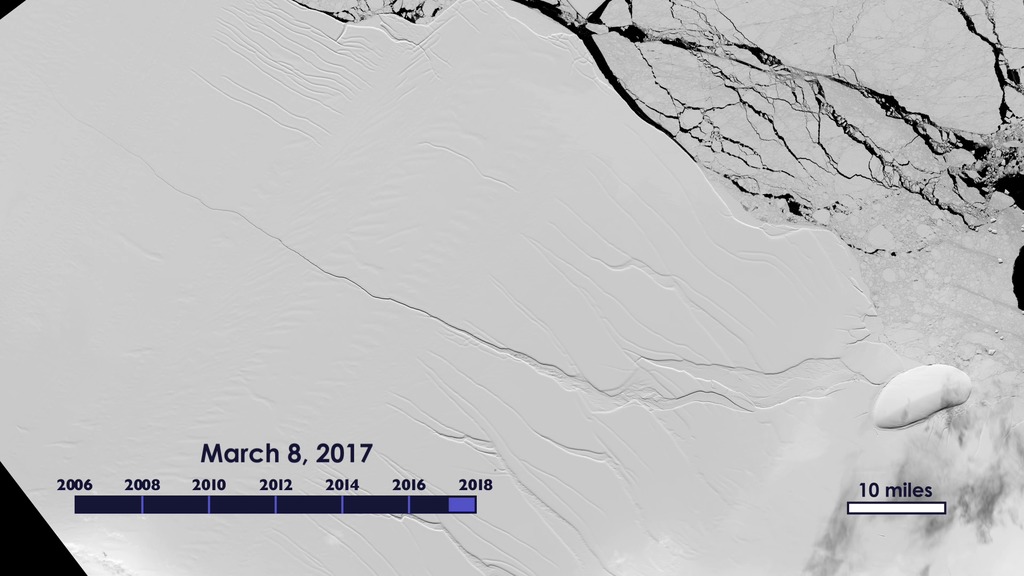
One of this year’s missions flew over a massive rift in the Larsen C. Ice shelves are the floating parts of ice streams and glaciers, and they buttress the grounded ice behind them; when ice shelves collapse, the ice behind accelerates toward the ocean, where it then adds to sea level rise. Larsen C neighbors a smaller ice shelf that disintegrated in 2002 after developing a rift similar to the one now growing in Larsen C.
The IceBridge scientists measured the Larsen C fracture to be about 70 miles long, more than 300 feet wide and about a third of a mile deep. The crack completely cuts through the ice shelf but it does not go all the way across it – once it does, it will produce an iceberg roughly the size of the state of Delaware.
"It’s a large rift on an ice shelf whose future we are curious about. Inevitably, when you see it in satellite imagery or from a plane, you wonder what is going to happen when it breaks off,” said Joe MacGregor, IceBridge deputy project scientist and glaciologist at NASA Goddard Space Flight Center. "However, large icebergs calve from ice shelves regularly and they normally do not lead to ice-shelf collapse. The growth of this rift likely indicates that the portion of the ice shelf downstream of the rift is no longer holding back any grounded ice.”
For more about Operation IceBridge and to follow future campaigns, visit: nasa.gov/icebridge
This is Forward Camera and Nadir (downward-looking) Camera footage of a section of a large crack on the Larsen C ice shelf. It was taken on board NASA's DC-8 research aircraft on Nov. 10, 2016 as part of an Operation IceBridge research flight.
This is Forward Camera and Nadir (downward-looking) Camera footage of a wider section of a large crack on the Larsen C ice shelf. It was taken on board NASA's DC-8 research aircraft on Nov. 10, 2016 as part of an Operation IceBridge research flight.
This is an assortment of more scenic footage from the Nadir (downward-looking) Camera on board NASA's DC-8 research aircraft from an Operation IceBridge mission on Nov. 10, 2016.
")
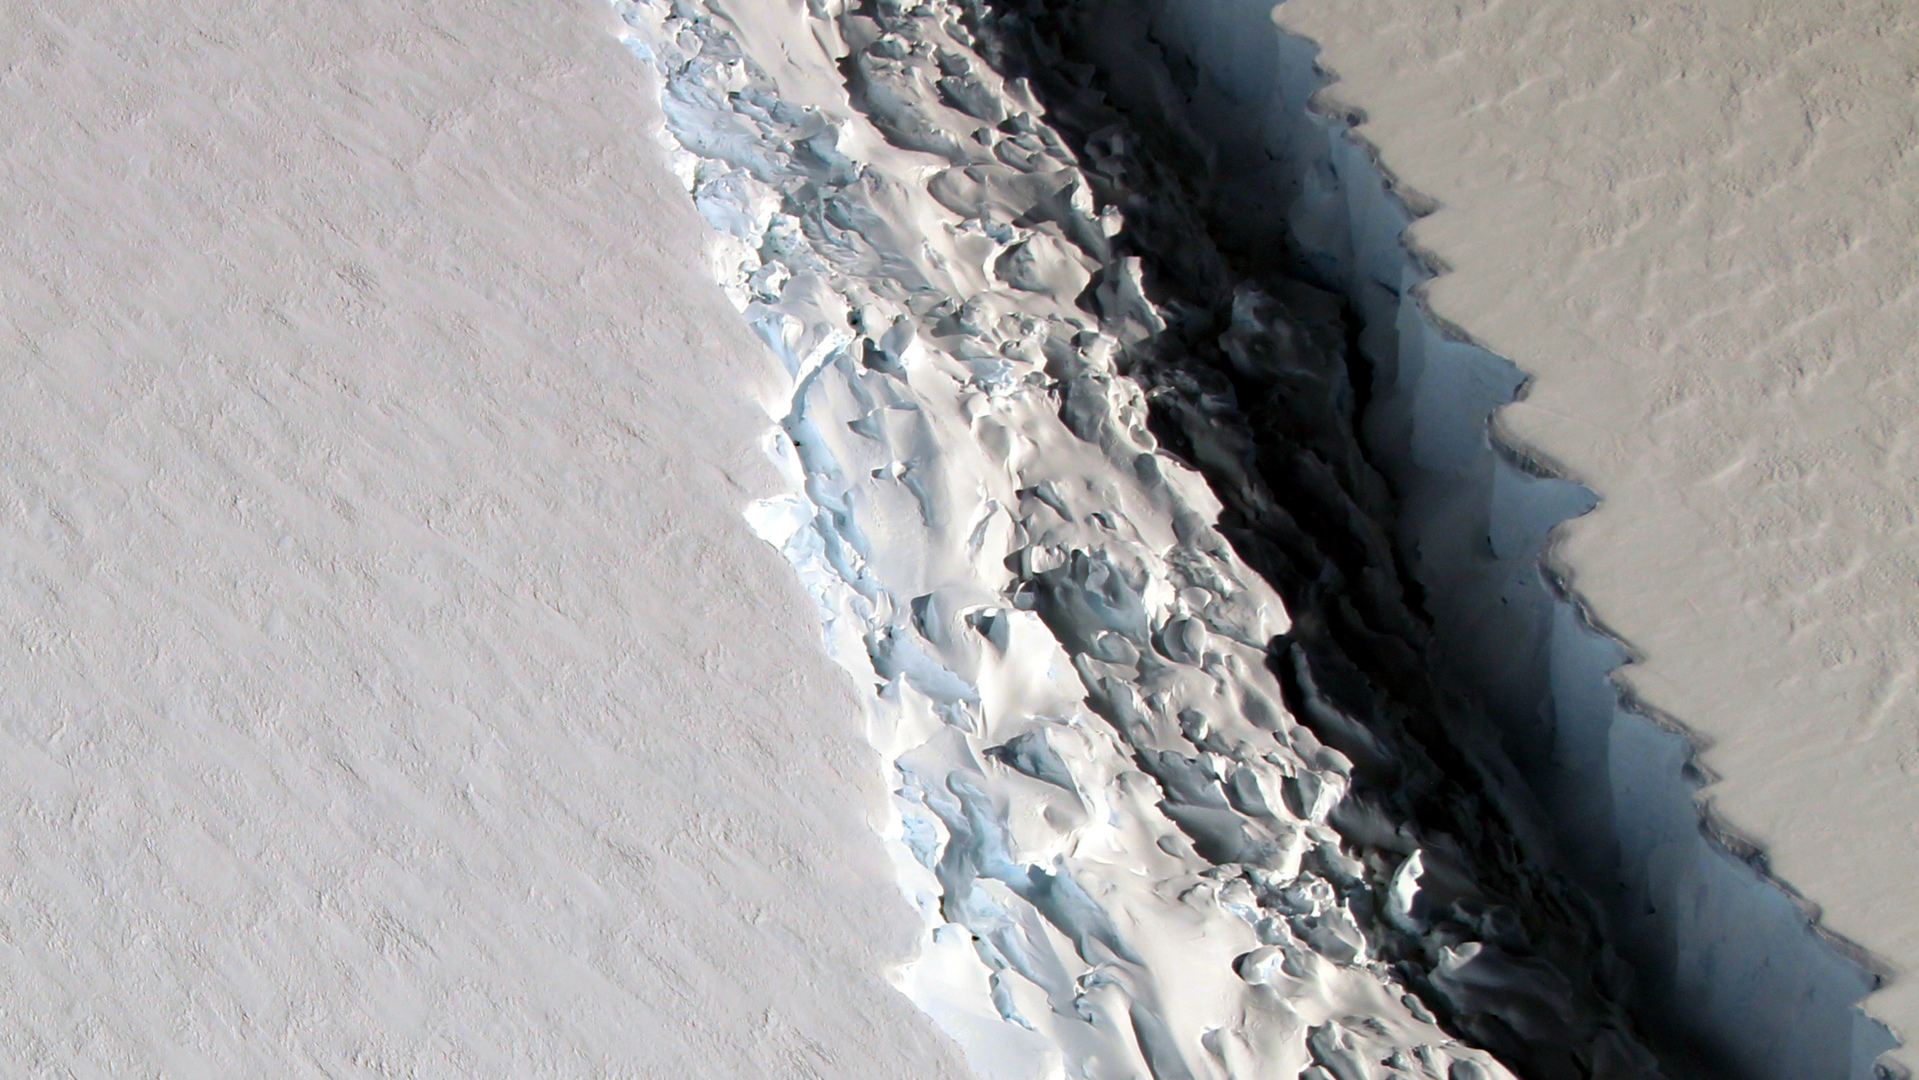
Snapshot of the rift in the Larsen C on Nov. 10, 2016. (NASA/John Sonntag)
")
Snapshot of the rift in the Larsen C on Nov. 10, 2016. (NASA/John Sonntag)

An image of the rift in the Larsen C on Nov. 10, 2016 from the Digital Mapping System.

An mosaic of a wider part of the rift in the Larsen C on Nov. 10, 2016, created from multiple images from the Digital Mapping System.

An image of a smaller part of the rift in the Larsen C on Nov. 10, 2016 from the Digital Mapping System.
Credits
Please give credit for this item to:
NASA's Goddard Space Flight Center
-
Producer
- Jefferson Beck (USRA)
Missions
This page is related to the following missions:Datasets used
-
DMS Photogrammetry [Digital Mapping System]
ID: 729
Note: While we identify the data sets used on this page, we do not store any further details, nor the data sets themselves on our site.
Related
- ID: 12633
 Produced Video
Used as a Source In
- ID: 12484
 Produced Video
Release date
This page was originally published on Thursday, December 8, 2016.
This page was last updated on Wednesday, May 3, 2023 at 1:48 PM EDT.