Atmospheric Carbon Dioxide Tagged by Source
Carbon dioxide (CO2) is the most prevalent greenhouse gas driving global climate change. However, its increase in the atmosphere would be even more rapid without land and ocean carbon sinks, which collectively absorb about half of human emissions every year. Advanced computer modeling techniques in NASA's Global Modeling and Assimilation Office allow us to disentangle the influences of sources and sinks and to better understand where carbon is coming from and going to.
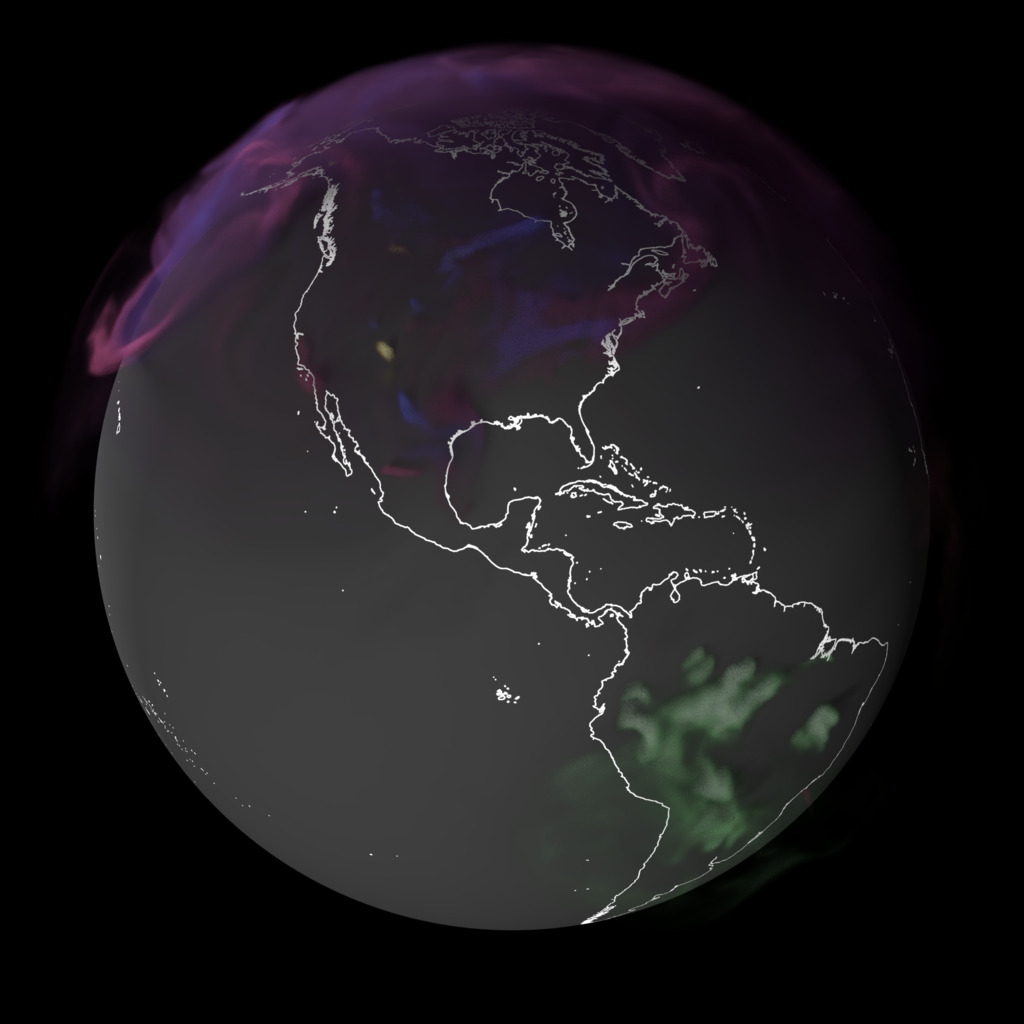
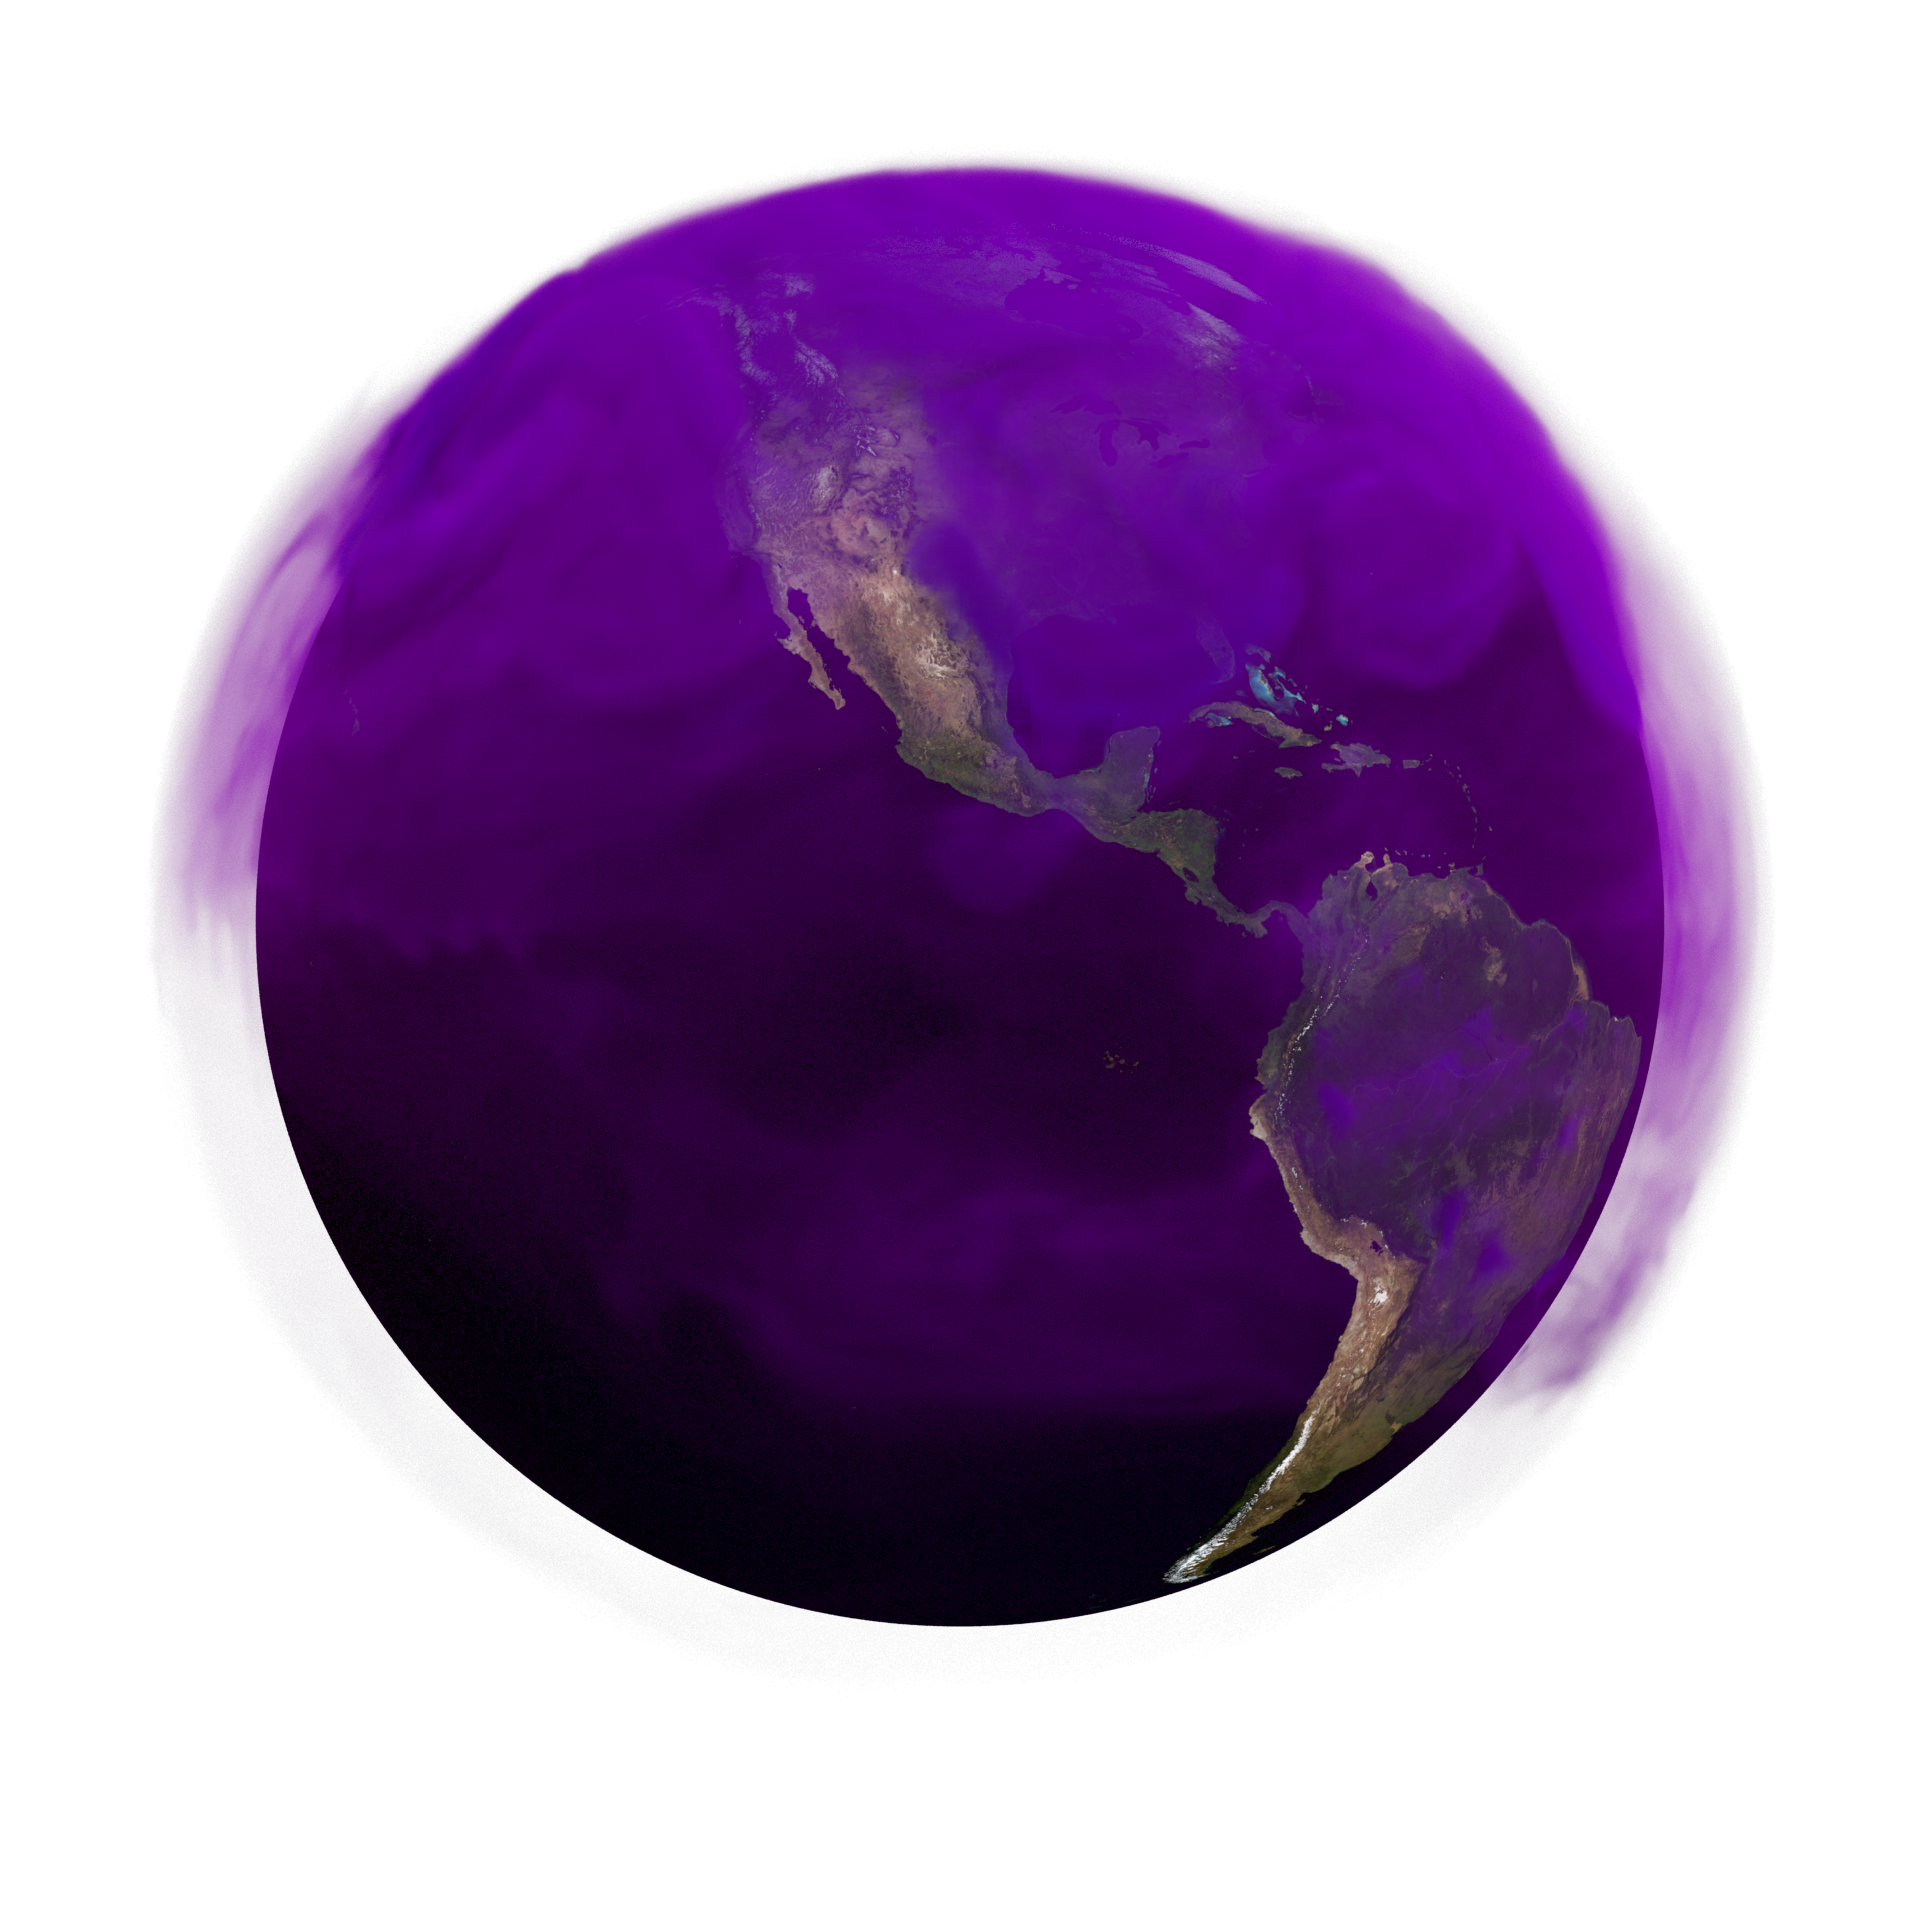
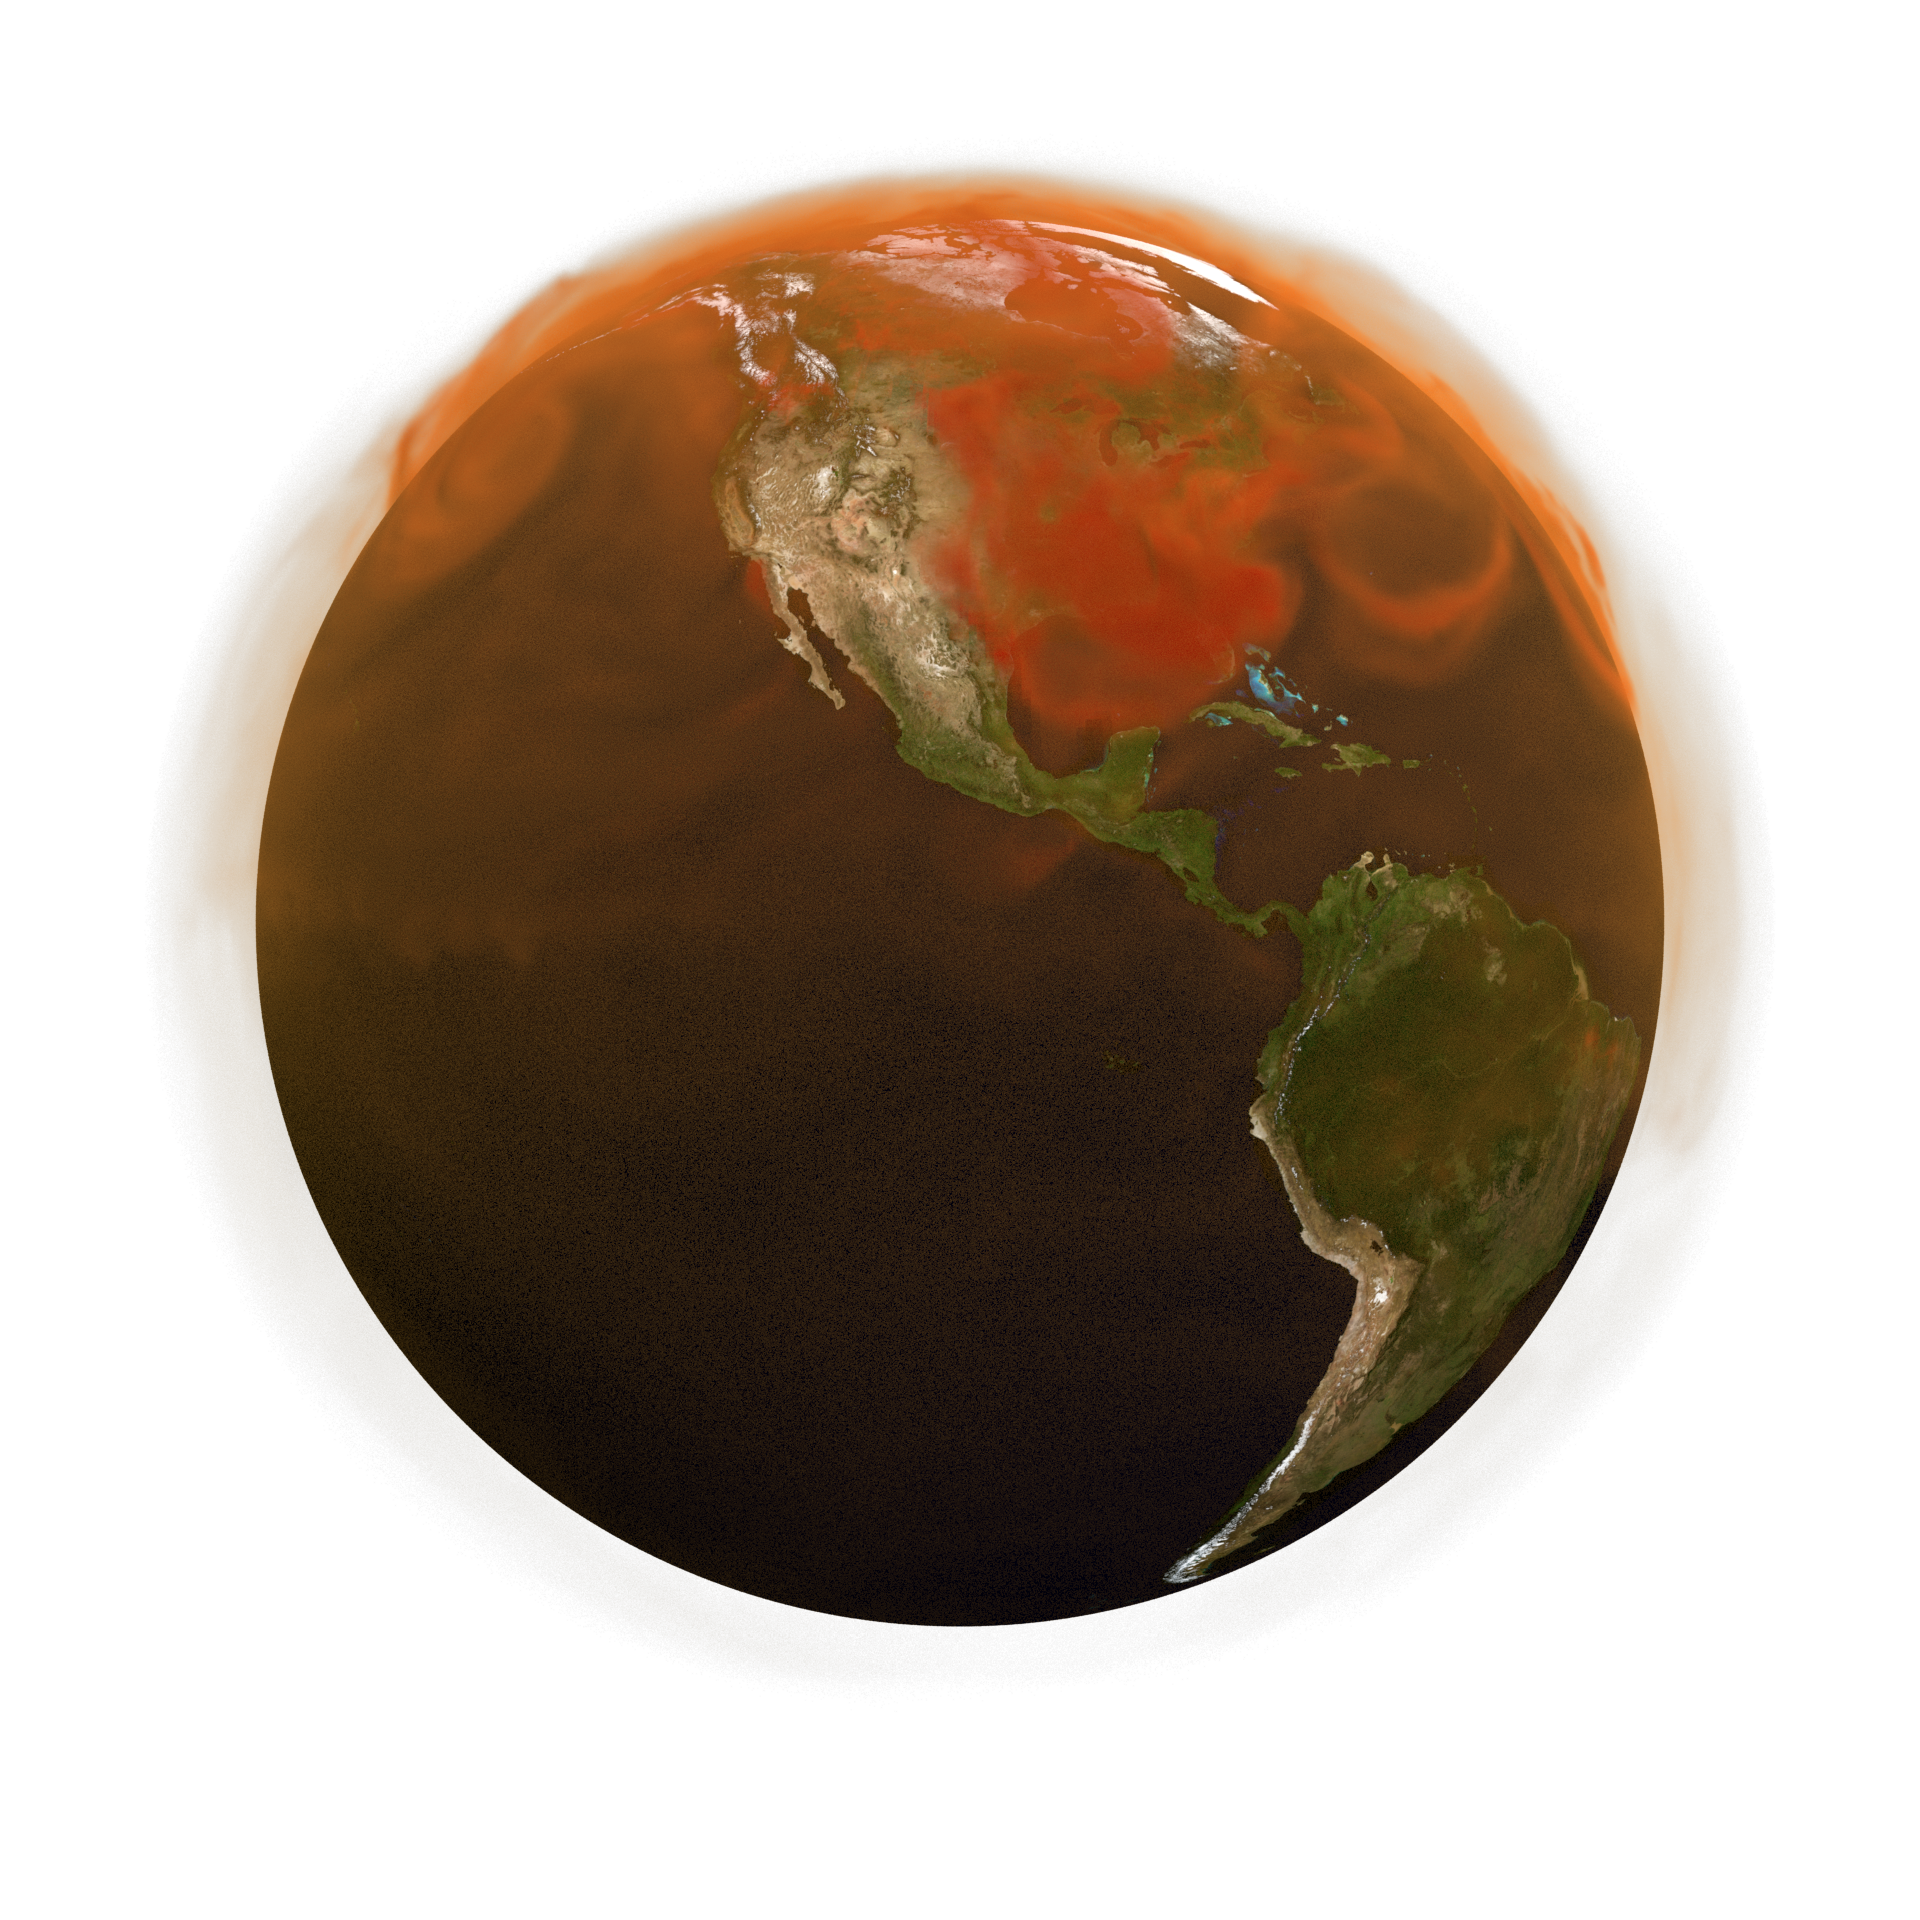
This visualization shows the CO2 being added to Earth's atmosphere over the course of the year 2021, split into four major contributors: fossil fuels in orange, burning biomass in red, land ecosystems in green, and the ocean in blue. The dots on the surface also show how atmospheric carbon dioxide is also being absorbed by land ecosystems in green and the ocean in blue. Though the land and oceans are each carbon sinks in a global sense, individual locations can be sources at different times.
This annotated version highlights key CO2 sources and sinks and their seasonal patterns.
This visualization shows the CO2 being added to Earth's atmosphere over the course of the year 2021, split into four major contributors: fossil fuels in orange, burning biomass in red, land ecosystems in green, and the ocean in blue. The dots on the surface also show how atmospheric carbon dioxide is also being absorbed by land ecosystems in green and the ocean in blue. Though the land and oceans are each carbon sinks in a global sense, individual locations can be sources at different times.
This composite does not have annotations.
This visualization shows the CO2 being added to Earth's atmosphere over the course of the year 2021, split into four major contributors: fossil fuels in orange, burning biomass in red, land ecosystems in green, and the ocean in blue. The dots on the surface also show how atmospheric carbon dioxide is also being absorbed by land ecosystems in green and the ocean in blue. Though the land and oceans are each carbon sinks in a global sense, individual locations can be sources at different times.
For example, in this view highlighting North America and South America, during the growing season plants absorb CO2 through photosynthesis, but release much of this carbon through respiration during winter months. Some interesting features include fossil fuel emissions from the northeastern urban corridor that extends from Washington D.C. to Boston in the United States. The fast oscillation over the Amazon rainforest shows the impact of plants absorbing carbon while the sun is shining and then releasing it during nighttime hours.
This view highlights CO2 sources and sinks over Asia and Australia. The most notable feature is fossil fuel emissions from China, which contribute to the increasing atmospheric burden of CO2 over the course of 2021. In contrast, drawdown from the land biosphere is visible over Australia for much of the year because emissions and population density are much lower. By the end of the animation, fossil fuel emissions which are released predominantly in the Northern Hemisphere are mixing southward obscuring Australia.
This view highlights Europe, the Middle East, and Africa. European fossil fuel emissions are visible as is red representing emissions from fires over central Africa that are used to clear crop residue. Fires represent a much smaller source of CO2 to the atmosphere than fossil fuel emissions, but are significant because they can alter the ability of an ecosystem to sequester carbon in the future. Scientists are carefully monitoring how CO2 emissions from fires are altered by climate change, which is bringing longer and more severe fire seasons to many areas.
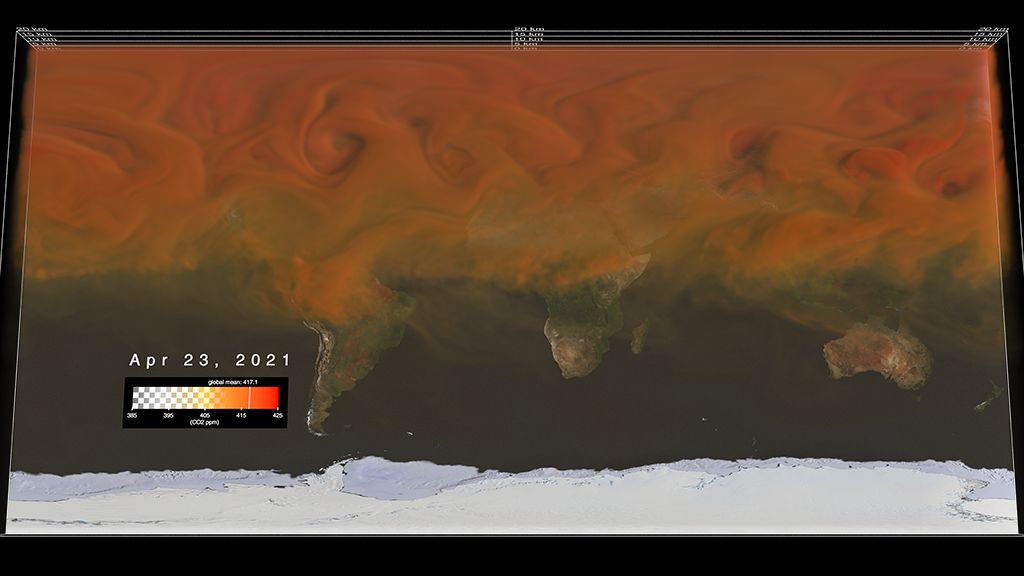
This equirectangular view is helpful for understanding what is happening across the entire globe at a glance. However, because of projection distortion, the contributions at the north and south poles are visually exaggerated.
This 3D legend explains the components of the visualizations above. There are four floating boxes showing CO2 emissions from fossil fuels in orange, burning biomass in red, land ecosystems in green, and the ocean in blue. These boxes show the actual volumetric data surrounding the spherical Earth, but the data are re-projected and fit into a Cartesian square. On the ground there are arrows showing natural CO2 absorption, with the land ecosystem's contribution in green, and the ocean's in blue. At times and locations when the land and ocean act as a source to the atmosphere, blue and green mixing ratios are shown.
This is a 4096x1080 super wide format of the same legend above which can help in laying out this page's visualizations in a longer format on a modular display.
This waterfall diagram shows the different global contributors of atmospheric carbon dioxide over the course of the year, and how they contribute to the net carbon dioxide added to the atmosphere as the year progresses.
This timeline is synchronized with the visualizations above to show temporal progress across the year.
For More Information
Credits
Please give credit for this item to:
NASA's Scientific Visualization Studio
-
Visualizers
-
AJ Christensen
(SSAI)

-
Mark SubbaRao
(NASA/GSFC)
-
Helen-Nicole Kostis
(USRA)
- Brenda Lopez-Silva (SSAI)
-
Anansa B. Keaton-Ashanti
(NASA/GSFC)
-
Greg Shirah
(NASA/GSFC)
-
AJ Christensen
(SSAI)
-
Technical support
- Laurence Schuler (ADNET Systems, Inc.)
- Ian Jones (ADNET Systems, Inc.)
-
Scientist
-
Lesley Ott
(NASA/GSFC)
-
Lesley Ott
(NASA/GSFC)
Related papers
Weir, B., Ott, L. E., Collatz, G. J., Kawa, S. R., Poulter, B., Chatterjee, A., Oda, T., and Pawson, S.: Bias-correcting carbon fluxes derived from land-surface satellite data for retrospective and near-real-time assimilation systems, Atmos. Chem. Phys., 21, 9609–9628, https://doi.org/10.5194/acp-21-9609-2021, 2021.
Weir, B., Ott, L. E., Collatz, G. J., Kawa, S. R., Poulter, B., Chatterjee, A., Oda, T., and Pawson, S.: Bias-correcting carbon fluxes derived from land-surface satellite data for retrospective and near-real-time assimilation systems, Atmos. Chem. Phys., 21, 9609–9628, https://doi.org/10.5194/acp-21-9609-2021, 2021.
Datasets used
-
GEOS Carbon Dioxide
ID: 962
Note: While we identify the data sets used on this page, we do not store any further details, nor the data sets themselves on our site.
Related
- ID: 5424
 Visualization
 - ID: 5194
- ID: 5118
 Visualization
 - ID: 5119
- ID: 5117
 Visualization
 - ID: 5116
 Visualization
 - ID: 5115
 Visualization
 - ID: 4949
 Visualization
Used as a Source In
- ID: 14696
 Produced Video
 - ID: 14568
Release date
This page was originally published on Friday, June 16, 2023.
This page was last updated on Monday, January 5, 2026 at 3:47 PM EST.