Earth
Sun
Planets and Moons
ID: 4466
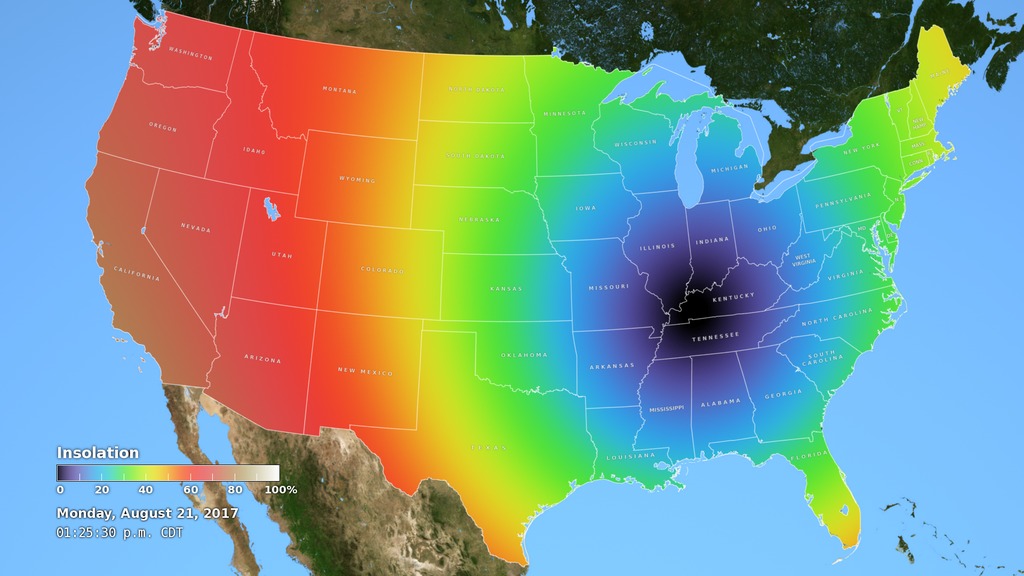
On an ordinary day, the insolation — the amount of sunlight hitting a given spot on the Earth — is proportional to the sine of the Sun's altitude. When the Sun is 30° above the horizon, the sunlight energy per square meter is half of what it is when the Sun is directly overhead. This relationship is the reason that the tropics are hot and the poles are cold. Combined with day length, it's also the reason for the difference in temperature between the seasons at temperate latitudes.
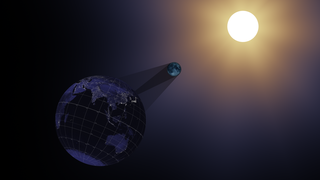
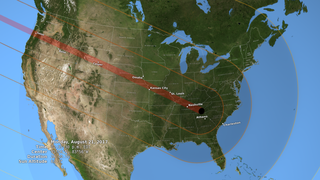
As this animation shows, the Moon's shadow dramatically, if temporarily, affects insolation in the continental United States during the total solar eclipse of August 21, 2017. The effect is readily apparent to observers in the path of totality. As the umbra passes overhead, the temperature drops by several degrees. The cooled column of air within the shadow cone can even influence cloud formation and the speed and direction of the wind.
The insolation map in the animation combines solar altitude with obscuration, the fraction of the Sun's area blocked by the Moon during the eclipse. It ignores a number of other factors, including atmospheric scattering, refraction, and cloud cover, that also play a role in the amount of sunlight that reaches the ground.
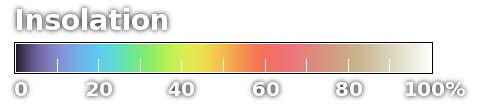
Insolation during the 2017 Eclipse
As this animation shows, the Moon's shadow dramatically, if temporarily, affects insolation in the continental United States during the total solar eclipse of August 21, 2017. The effect is readily apparent to observers in the path of totality. As the umbra passes overhead, the temperature drops by several degrees. The cooled column of air within the shadow cone can even influence cloud formation and the speed and direction of the wind.
The insolation map in the animation combines solar altitude with obscuration, the fraction of the Sun's area blocked by the Moon during the eclipse. It ignores a number of other factors, including atmospheric scattering, refraction, and cloud cover, that also play a role in the amount of sunlight that reaches the ground.
Related

Visualization Credits
Please give credit for this item to:
NASA's Scientific Visualization Studio
NASA's Scientific Visualization Studio
Short URL to share this page:
https://svs.gsfc.nasa.gov/4466
Data Used:
Note: While we identify the data sets used in these visualizations, we do not store any further details nor the data sets themselves on our site.
This item is part of these series:
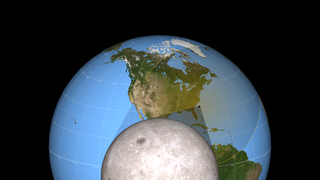
Science On a Sphere
2017 Solar Eclipse
Keywords:
SVS >> HDTV
SVS >> Moon
SVS >> Solar Eclipse
SVS >> Hyperwall
SVS >> Science On a Sphere
SVS >> Eclipse
SVS >> Heliophysics
SVS >> Sun-Earth-Moon Interactions
SVS >> Sun and Earth
NASA Science >> Earth
NASA Science >> Sun
NASA Science >> Planets and Moons
https://svs.gsfc.nasa.gov/4466
Data Used:
Terra and Aqua/MODIS/Blue Marble: Next Generation also referred to as: BMNG
Credit:
The Blue Marble data is courtesy of Reto Stockli (NASA/GSFC).
The Blue Marble data is courtesy of Reto Stockli (NASA/GSFC).
JPL DE421 also referred to as: DE421
Ephemeris - NASA/JPL
Planetary ephemerides
This item is part of these series:
Science On a Sphere
2017 Solar Eclipse
Keywords:
SVS >> HDTV
SVS >> Moon
SVS >> Solar Eclipse
SVS >> Hyperwall
SVS >> Science On a Sphere
SVS >> Eclipse
SVS >> Heliophysics
SVS >> Sun-Earth-Moon Interactions
SVS >> Sun and Earth
NASA Science >> Earth
NASA Science >> Sun
NASA Science >> Planets and Moons


