Tracing the 2017 Solar Eclipse
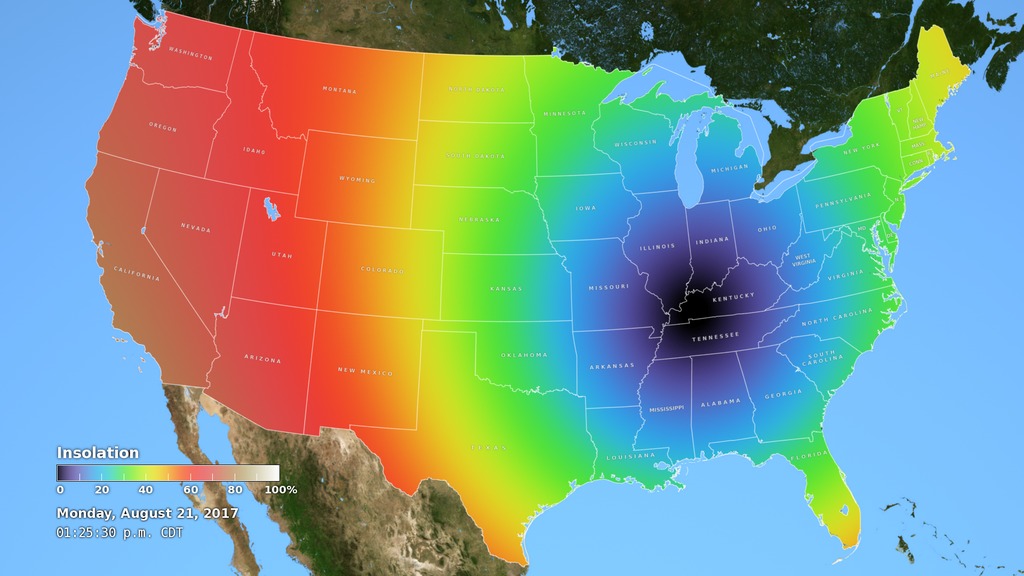
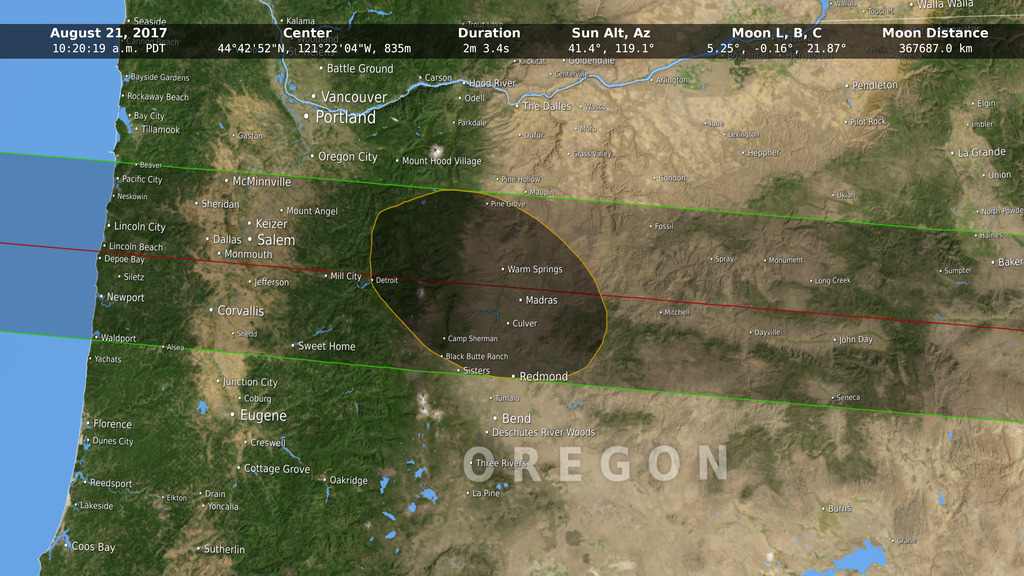
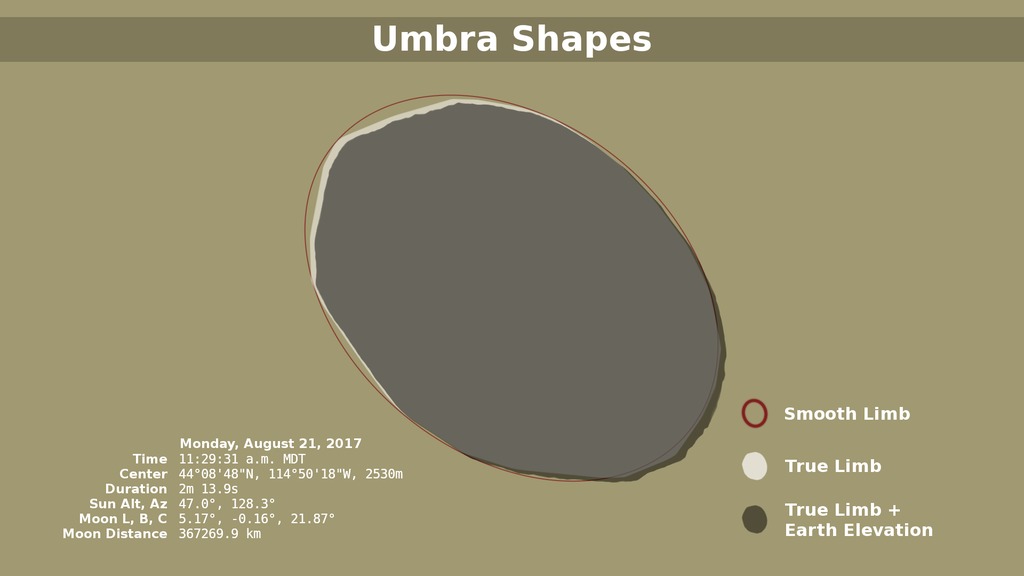
When depicting an eclipse path, data visualizers have usually chosen to represent the moon's shadow as an oval. By bringing in a variety of NASA data sets, visualizer Ernie Wright has created a new and more accurate representation of the eclipse. For the first time, we are able to see that the moon's shadow is better represented as a polygon. This more complicated shape is based NASA's Lunar Reconnaissance Orbiter's view of the mountains and valleys that form the moon's jagged edge. By combining moon's terrain, heights of land forms on Earth, and the angle of the sun, Wright is able to show the eclipse path with the greatest accuracy to date.
Hear data visualizer Ernie Wright discuss the map in the video above. To see the maps unedited, watch the two videos below.
Music credit: Life Choices by Eric Chevalier
Complete transcript available.
Watch this video on the NASA Goddard YouTube channel.
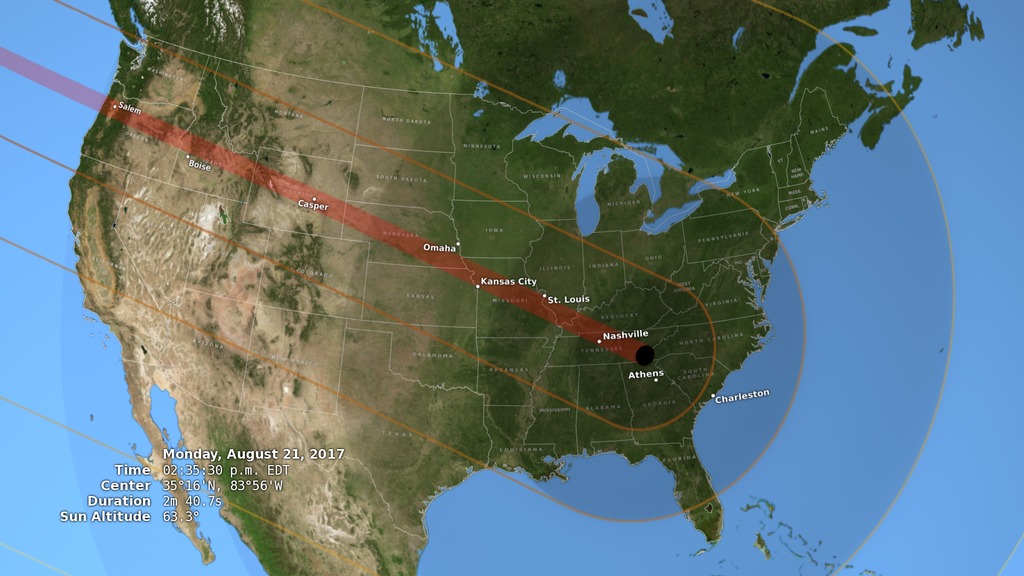
The 2017 Path of TotalityRead more about this map
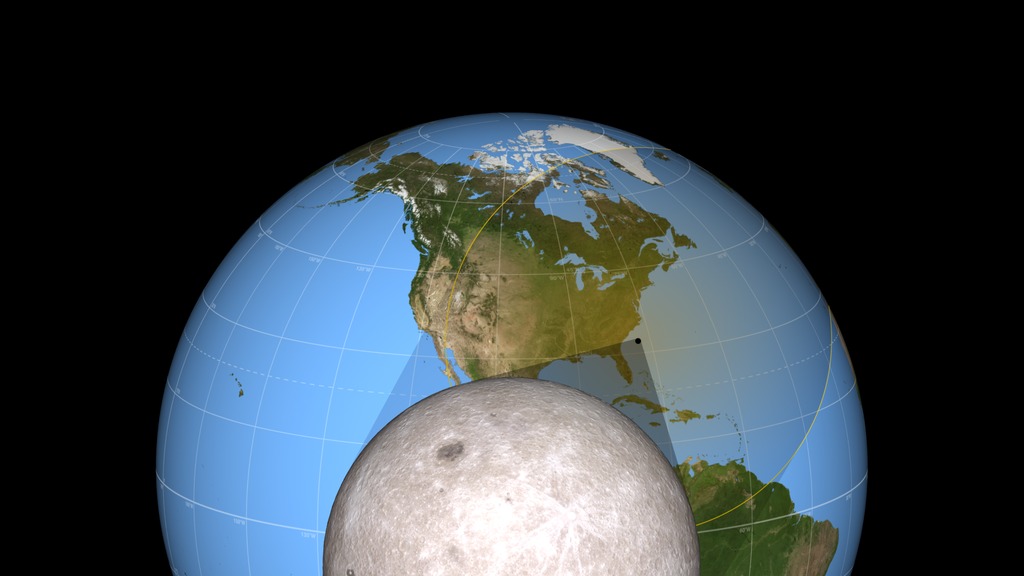
The 2017 Path of Totality: Oblique ViewRead more about this map
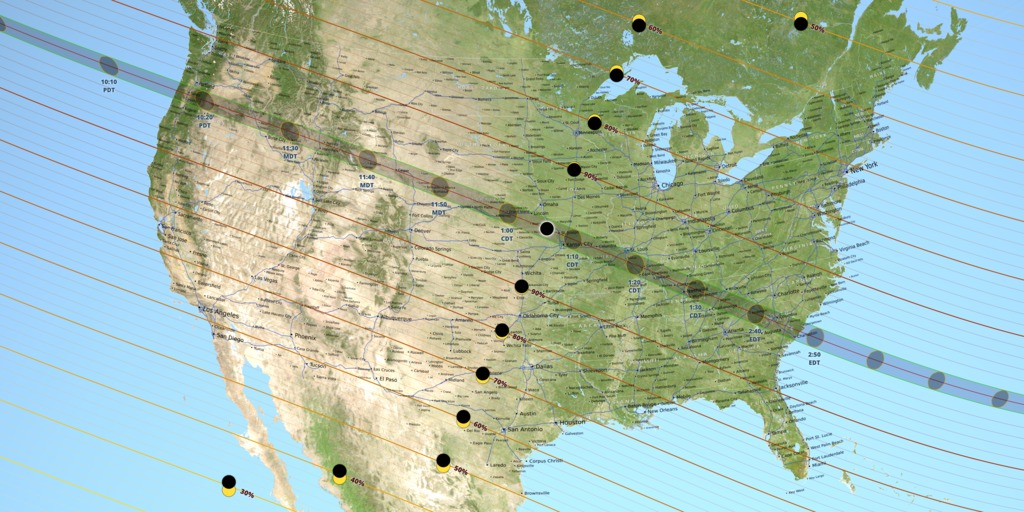
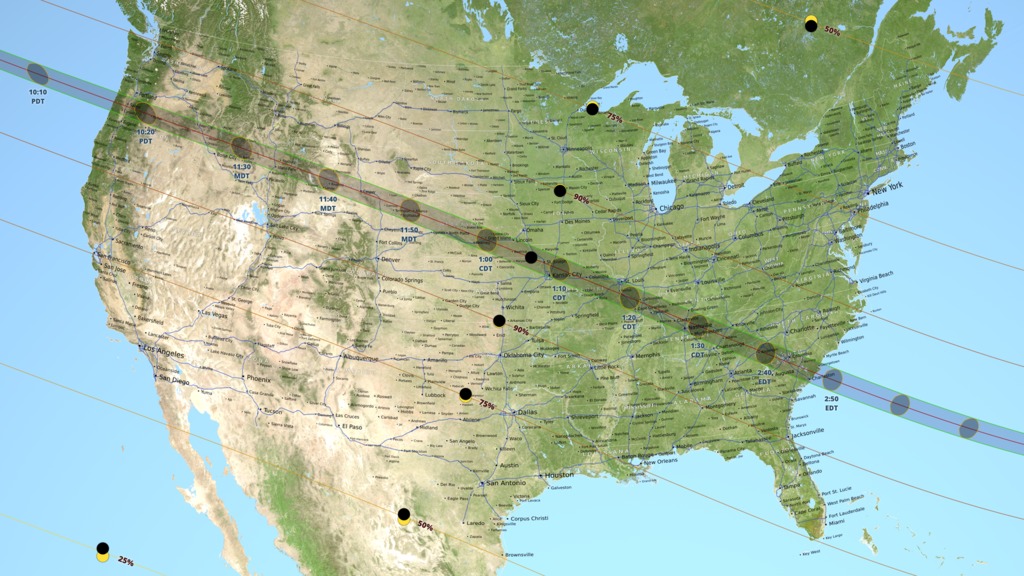
This animation closely follows the Moon's umbra shadow as it passes over the United States during the August 21, 2017 total solar eclipse. Through the use of a number of NASA datasets, notably the global elevation maps from Lunar Reconnaissance Orbiter, the shape and location of the shadow is depicted with unprecedented accuracy.
Credits
Please give credit for this item to:
NASA's Goddard Space Flight Center
-
Producer
- Genna Duberstein (USRA)
-
Visualizer
-
Ernie Wright
(USRA)

-
Ernie Wright
(USRA)
-
Narrator
-
Ernie Wright
(USRA)
-
Ernie Wright
(USRA)
-
Editor
- Genna Duberstein (USRA)
Series
This page can be found in the following series:Datasets used
-
DEM [SRTM: SIR-C]
ID: 481 -
BMNG (Blue Marble: Next Generation) [Terra and Aqua: MODIS]
ID: 508Credit: The Blue Marble data is courtesy of Reto Stockli (NASA/GSFC).
This dataset can be found at: http://earthobservatory.nasa.gov/Newsroom/BlueMarble/
See all pages that use this dataset -
DEM (Digital Elevation Map) [LRO: LOLA]
ID: 653 -
DE421 (JPL DE421)
ID: 752Planetary ephemerides
This dataset can be found at: http://ssd.jpl.nasa.gov/?ephemerides#planets
See all pages that use this dataset -
SLDEM2015 (DIgital Elevation Model) [LRO/SELENE: LOLA/TC]
ID: 948A digital elevation model of the Moon derived from the Lunar Orbiter Laser Altimeter and the SELENE Terrain Camera. See the description in Icarus. The data is here.
See all pages that use this dataset
Note: While we identify the data sets used on this page, we do not store any further details, nor the data sets themselves on our site.
Related
- ID: 4466
 Visualization
 - ID: 4390
 Visualization
 - ID: 4314
 Visualization
 - ID: 4321
 Visualization
Sources
- ID: 4515
 Visualization
 - ID: 4516
 Visualization
 - ID: 4517
 Visualization
 - ID: 4518
 Visualization
Used as a Source In
- ID: 12458
 Produced Video
Release date
This page was originally published on Wednesday, December 14, 2016.
This page was last updated on Wednesday, May 3, 2023 at 1:48 PM EDT.