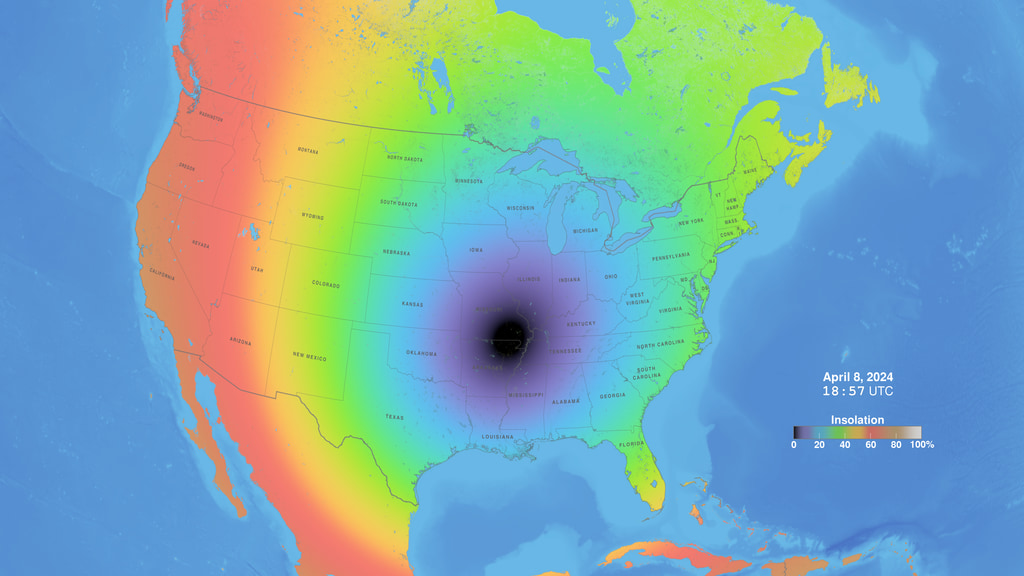
Insolation during the 2017 Eclipse
Insolation (the amount of sunlight reaching the ground) is affected dramatically by the Moon's shadow during the August 21, 2017 total solar eclipse.
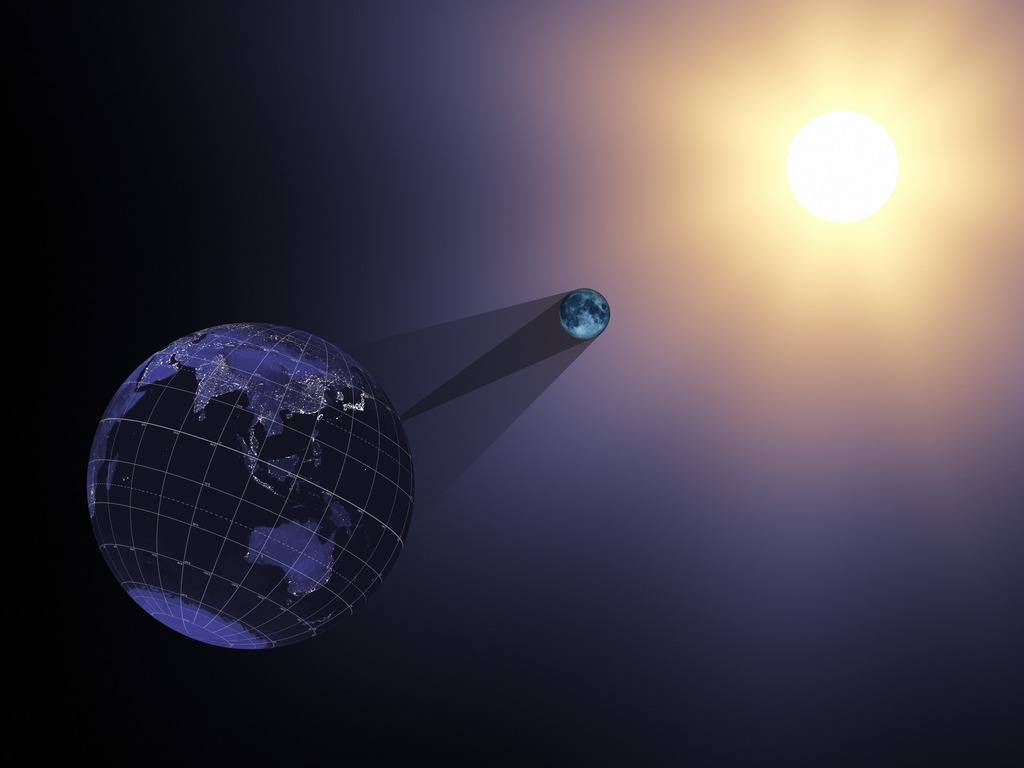
On an ordinary day, the insolation — the amount of sunlight hitting a given spot on the Earth — is proportional to the sine of the Sun's altitude. When the Sun is 30° above the horizon, the sunlight energy per square meter is half of what it is when the Sun is directly overhead. This relationship is the reason that the tropics are hot and the poles are cold. Combined with day length, it's also the reason for the difference in temperature between the seasons at temperate latitudes.
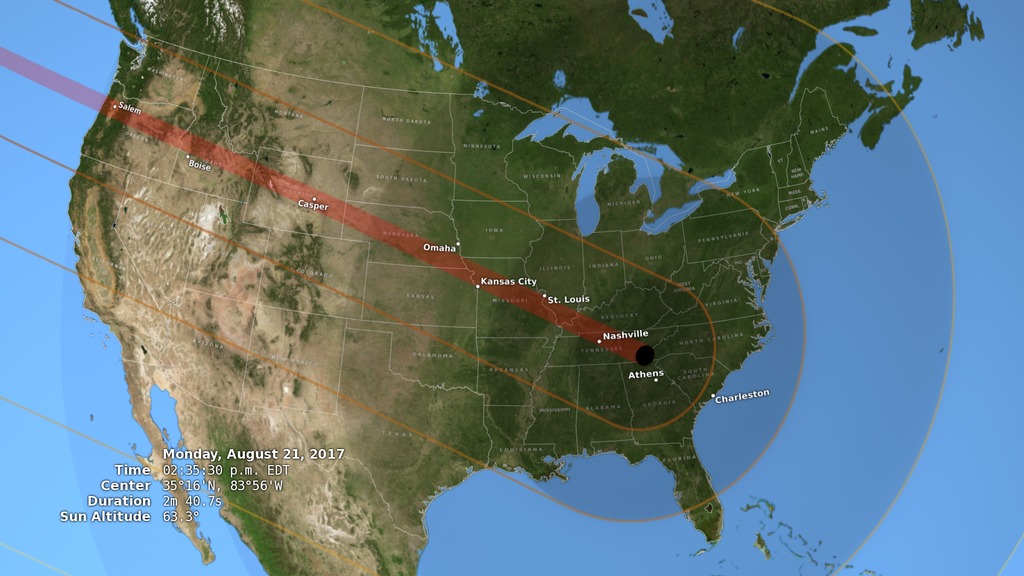
As this animation shows, the Moon's shadow dramatically, if temporarily, affects insolation in the continental United States during the total solar eclipse of August 21, 2017. The effect is readily apparent to observers in the path of totality. As the umbra passes overhead, the temperature drops by several degrees. The cooled column of air within the shadow cone can even influence cloud formation and the speed and direction of the wind.
The insolation map in the animation combines solar altitude with obscuration, the fraction of the Sun's area blocked by the Moon during the eclipse. It ignores a number of other factors, including atmospheric scattering, refraction, and cloud cover, that also play a role in the amount of sunlight that reaches the ground.

The color key for the insolation map.
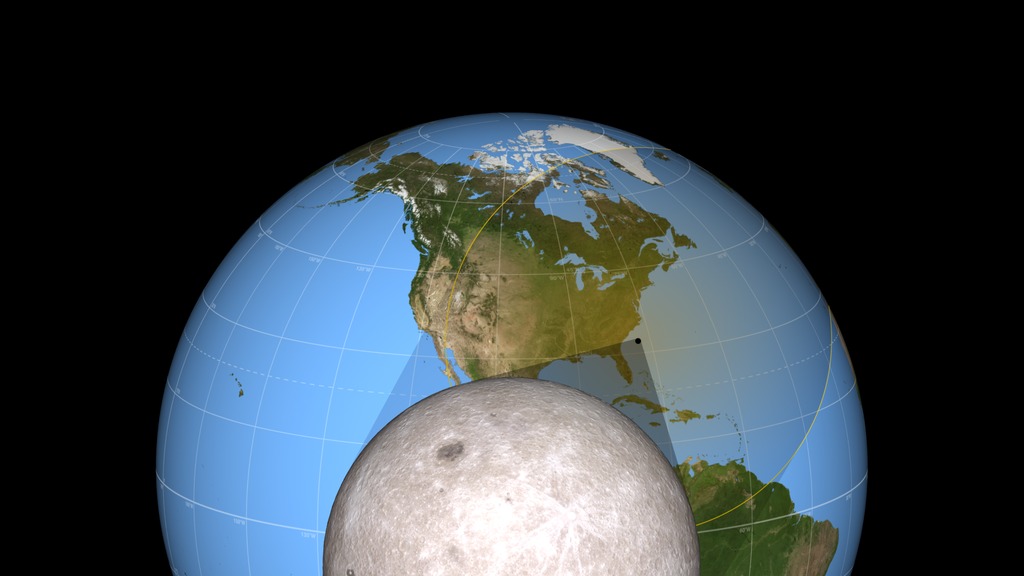
A map-like view of the Earth shows insolation (sunlight intensity) over land during the August 21, 2017 total solar eclipse. This equirectangular projection is suitable for spherical displays and for spherical mapping in 3D animation software.
The obscuration dataset used to calculate insolation. Obscuration, the fraction of the Sun's area covered by the Moon, is calculated at 10-second intervals from 16:25:40 to 20:25:30 UTC at a resolution of 360/8192 degrees per pixel (roughly 3.75 × 4.9 km at 40°N). The maps are global equirectangular projections centered on (0°, 0°), with white = 100% obscuration and black = 0%. The sharp borders are the terminator (the day-night line). The complete dataset can be downloaded as a single .zip file (196 MB).
Credits
Please give credit for this item to:
NASA's Scientific Visualization Studio
-
Visualizer
-
Ernie Wright
(USRA)

-
Ernie Wright
(USRA)
-
Scientist
- Madhulika Guhathakurta (NASA/HQ)
Series
This page can be found in the following series:Datasets used
-
BMNG (Blue Marble: Next Generation) [Terra and Aqua: MODIS]
ID: 508Credit: The Blue Marble data is courtesy of Reto Stockli (NASA/GSFC).
This dataset can be found at: http://earthobservatory.nasa.gov/Newsroom/BlueMarble/
See all pages that use this dataset -
DE421 (JPL DE421)
ID: 752Planetary ephemerides
This dataset can be found at: http://ssd.jpl.nasa.gov/?ephemerides#planets
See all pages that use this dataset
Note: While we identify the data sets used on this page, we do not store any further details, nor the data sets themselves on our site.
Related
- ID: 5248
 Visualization
 - ID: 12678

- ID: 12565
- ID: 12534
 Produced Video
 - ID: 12412
 Produced Video
 - ID: 4390
 Visualization
 - ID: 4314
 Visualization
 - ID: 4321
 Visualization
Release date
This page was originally published on Monday, May 23, 2016.
This page was last updated on Sunday, January 5, 2025 at 12:07 AM EST.