Never at rest: the air over Los Angeles
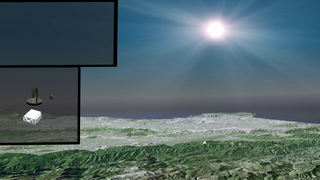
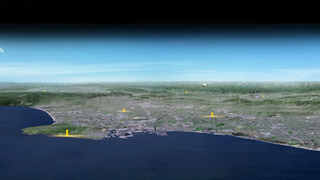
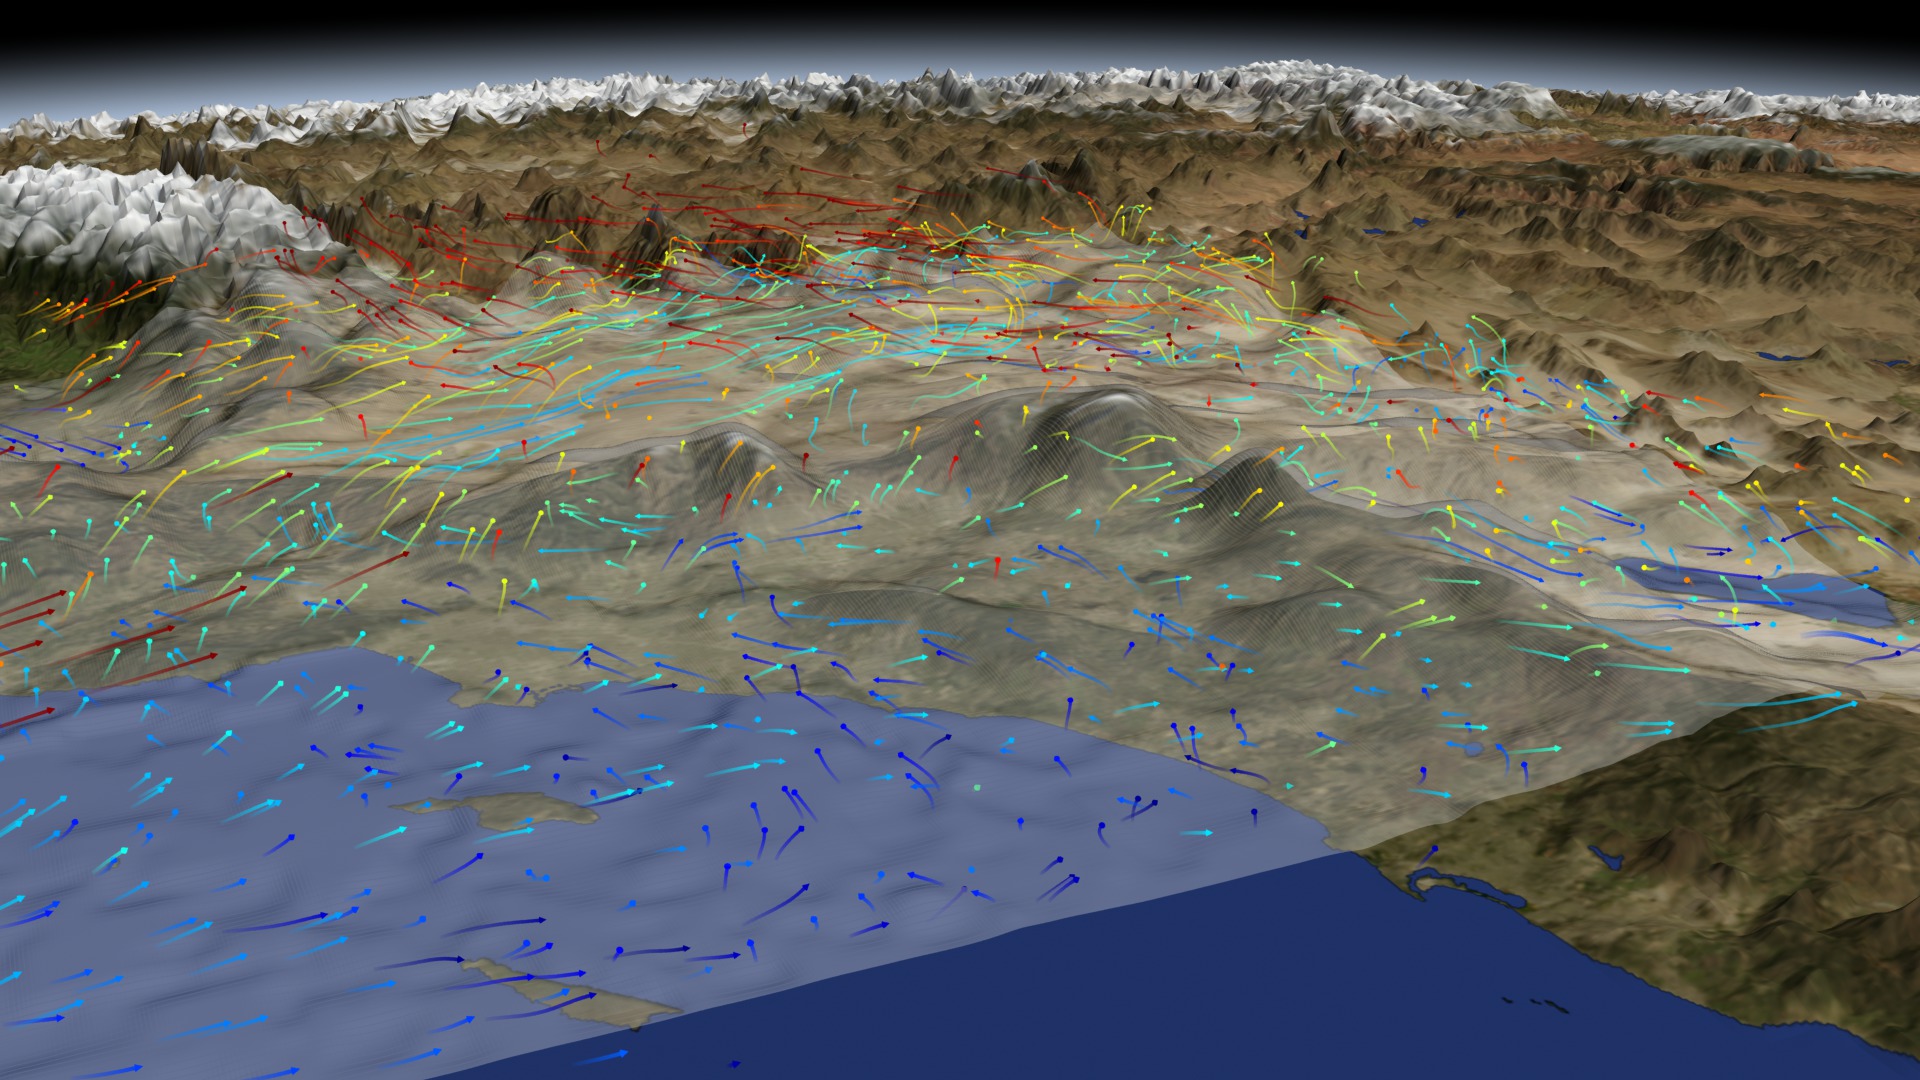
This visualization shows the output of a high-resolution model of the atmosphere over Los Angeles (courtesy Meemong Lee and Zhijin Li, NASA/JPL). The model is based on meteorological measurements for one month in the spring of 2010 at a resolution of 1 km and 3 hours. Vertical motion of the Earth's Planetary Boundary Layer (PBL) - the lowest part of the atmosphere that hugs the surface of the Earth - is represented by the gray "blanket". The height of the PBL is largely driven by convection associated with the changing surface temperature of the Earth (for example, rising during the day and sinking at night). The colored arrows represent the strength and direction of winds at different altitudes. The Megacities Carbon Project includes measurements and models of PBL dynamics and winds to help interpret measurements of greenhouse gas abundances at different locations around the basin. Measurement systems include wind speed and direction indicators and laser detection and ranging (lidar) instruments to track the changing PBL height.
Related

For More Information
Visualization Credits
Horace Mitchell (NASA/GSFC): Animator
Greg Shirah (NASA/GSFC): Animator
Kayvon Sharghi (USRA): Producer
Riley Duren (NASA/JPL CalTech): Scientist
NASA's Goddard Space Flight Center Scientific Visualization Studio
https://svs.gsfc.nasa.gov/4077
Data Used:
Megacities Project Planetary Boundary Layer Height Data also referred to as: Megacities Project PBL
Data Compilation - NASA/Caltech JPLKeywords:
SVS >> HDTV
NASA Science >> Earth


