Earth
ID: 20198
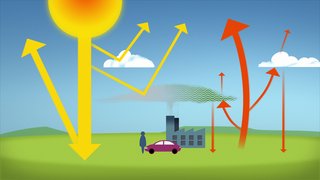
Cities and their power plants are the largest sources of greenhouse gas emissions from human activity. As of 2010, urbanization has concentrated more than half of the world's population, at least 70% of fossil fuel carbon dioxide (CO2) emissions, and a significant amount of methane into a small fraction of the Earth's land surface. Currently the world's 40 largest cities together represent the third largest emitter of fossil fuel CO2 after China and the US. This trend is expected to grow in the future with increasing urbanization.
Tracking the carbon emissions of megacities
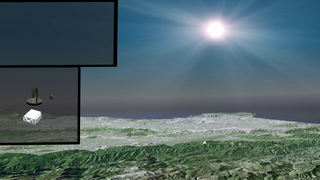
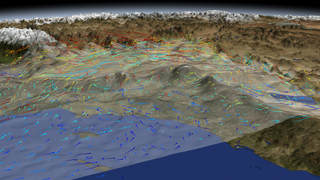
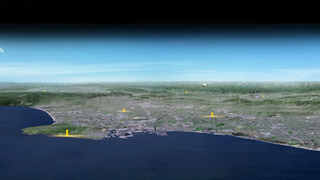
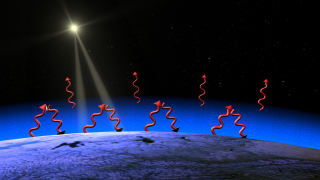
This animation shows a global map of fossil-fuel CO2 emissions for the year 2010 derived from satellite imagery of night-lights and other data (courtesy Tom Oda - CSU/NOAA in collaboration with NIES). A global urban carbon monitoring system would combine surface measurement networks in the world's largest cities (highlighted here) and satellite observations of nearly all urban areas. The surface grid squares illustrate the surface footprint of future geostationary satellites that could be focused on the 2-3% of land surface area producing the majority of emissions.
The Megacities Carbon Project will develop and test methods for monitoring the greenhouse gas emissions of the largest human contributors to climate change.
Related
For More Information
Animation Credits
Walt Feimer (HTSI): Animator
Kayvon Sharghi (USRA): Producer
Riley Duren (NASA/JPL CalTech): Scientist
Kayvon Sharghi (USRA): Producer
Riley Duren (NASA/JPL CalTech): Scientist
Please give credit for this item to:
NASA's Goddard Space Flight Center, Conceptual Image Lab
NASA's Goddard Space Flight Center, Conceptual Image Lab
Short URL to share this page:
https://svs.gsfc.nasa.gov/20198
Keywords:
SVS >> HDTV
NASA Science >> Earth
https://svs.gsfc.nasa.gov/20198
Keywords:
SVS >> HDTV
NASA Science >> Earth


