Never at rest: the air over Los Angeles
The Megacities Carbon Project is developing and testing methods for monitoring the greenhouse gas emissions of cities, the largest human contributors to climate change. Observations of the concentrations of carbon dioxide (CO2), methane, and other gases in the atmosphere can be used to estimate the locations and strengths of different emission sources. Interpreting measurements of gas concentrations at one location to infer an emission source at another location is complicated by the effects of the Earth's atmosphere which is always in motion. For example, increasing concentrations of CO2 at a given location can either be due to increasing emissions or stagnant or sinking air whereas decreasing concentrations of CO2 can either be due to decreasing emissions or strong winds or rising air.
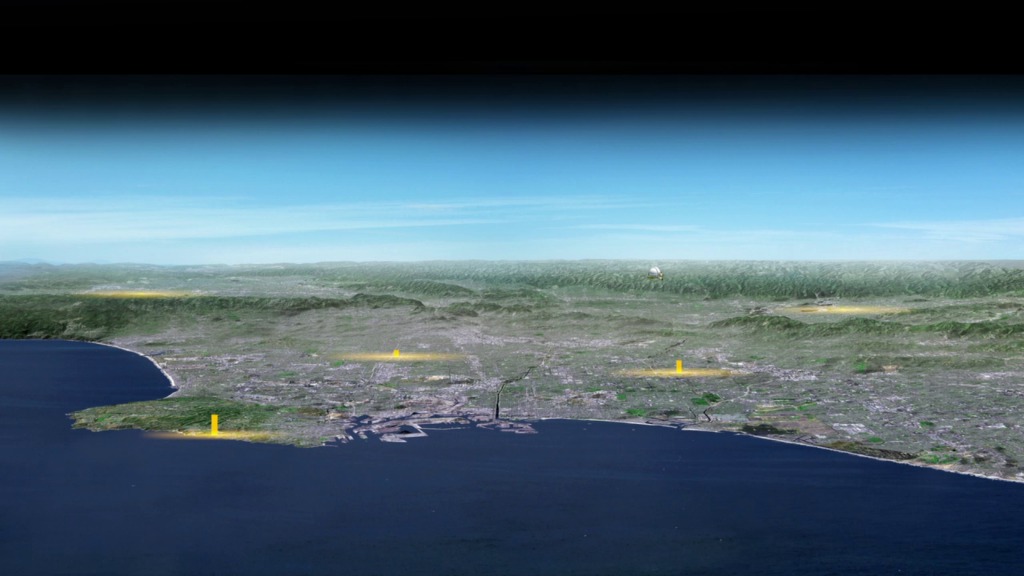
This visualization shows the output of a high-resolution model of the atmosphere over Los Angeles (courtesy Meemong Lee and Zhijin Li, NASA/JPL). The model is based on meteorological measurements for one month in the spring of 2010 at a resolution of 1 km and 3 hours. Vertical motion of the Earth's Planetary Boundary Layer (PBL) - the lowest part of the atmosphere that hugs the surface of the Earth - is represented by the gray "blanket". The height of the PBL is largely driven by convection associated with the changing surface temperature of the Earth (for example, rising during the day and sinking at night). The colored arrows represent the strength and direction of winds at different altitudes. The Megacities Carbon Project includes measurements and models of PBL dynamics and winds to help interpret measurements of greenhouse gas abundances at different locations around the basin. Measurement systems include wind speed and direction indicators and laser detection and ranging (lidar) instruments to track the changing PBL height.
This movie is a combined visualization of PBL and wind dynamics over the LA basin for a one month period.
This movie is a visualization of PBL over the LA basin for a one month period.
This movie is a visualization of winds over the LA basin for a one month period.
For More Information
Credits
Please give credit for this item to:
NASA's Goddard Space Flight Center Scientific Visualization Studio
-
Animators
- Trent L. Schindler (USRA)
- Horace Mitchell (NASA/GSFC)
-
Greg Shirah
(NASA/GSFC)

-
Producer
- Kayvon Sharghi (USRA)
-
Scientist
- Riley Duren (NASA/JPL CalTech)
Datasets used
-
Megacities Project PBL (Megacities Project Planetary Boundary Layer Height Data)
ID: 952Calibrated instrument data and retrieved mixing layer heights from the MiniMicroPulse Lidar (MiniMPL) and Ceilometer at Caltech.
This dataset can be found at: https://megacities.jpl.nasa.gov/portal/
See all pages that use this dataset
Note: While we identify the data sets used on this page, we do not store any further details, nor the data sets themselves on our site.
Related
- ID: 20198

- ID: 20199

- ID: 20197
Release date
This page was originally published on Thursday, May 16, 2013.
This page was last updated on Wednesday, May 3, 2023 at 1:52 PM EDT.