SDO: Stills and Graphics
2023
- ID: 31213 Hyperwall Visual
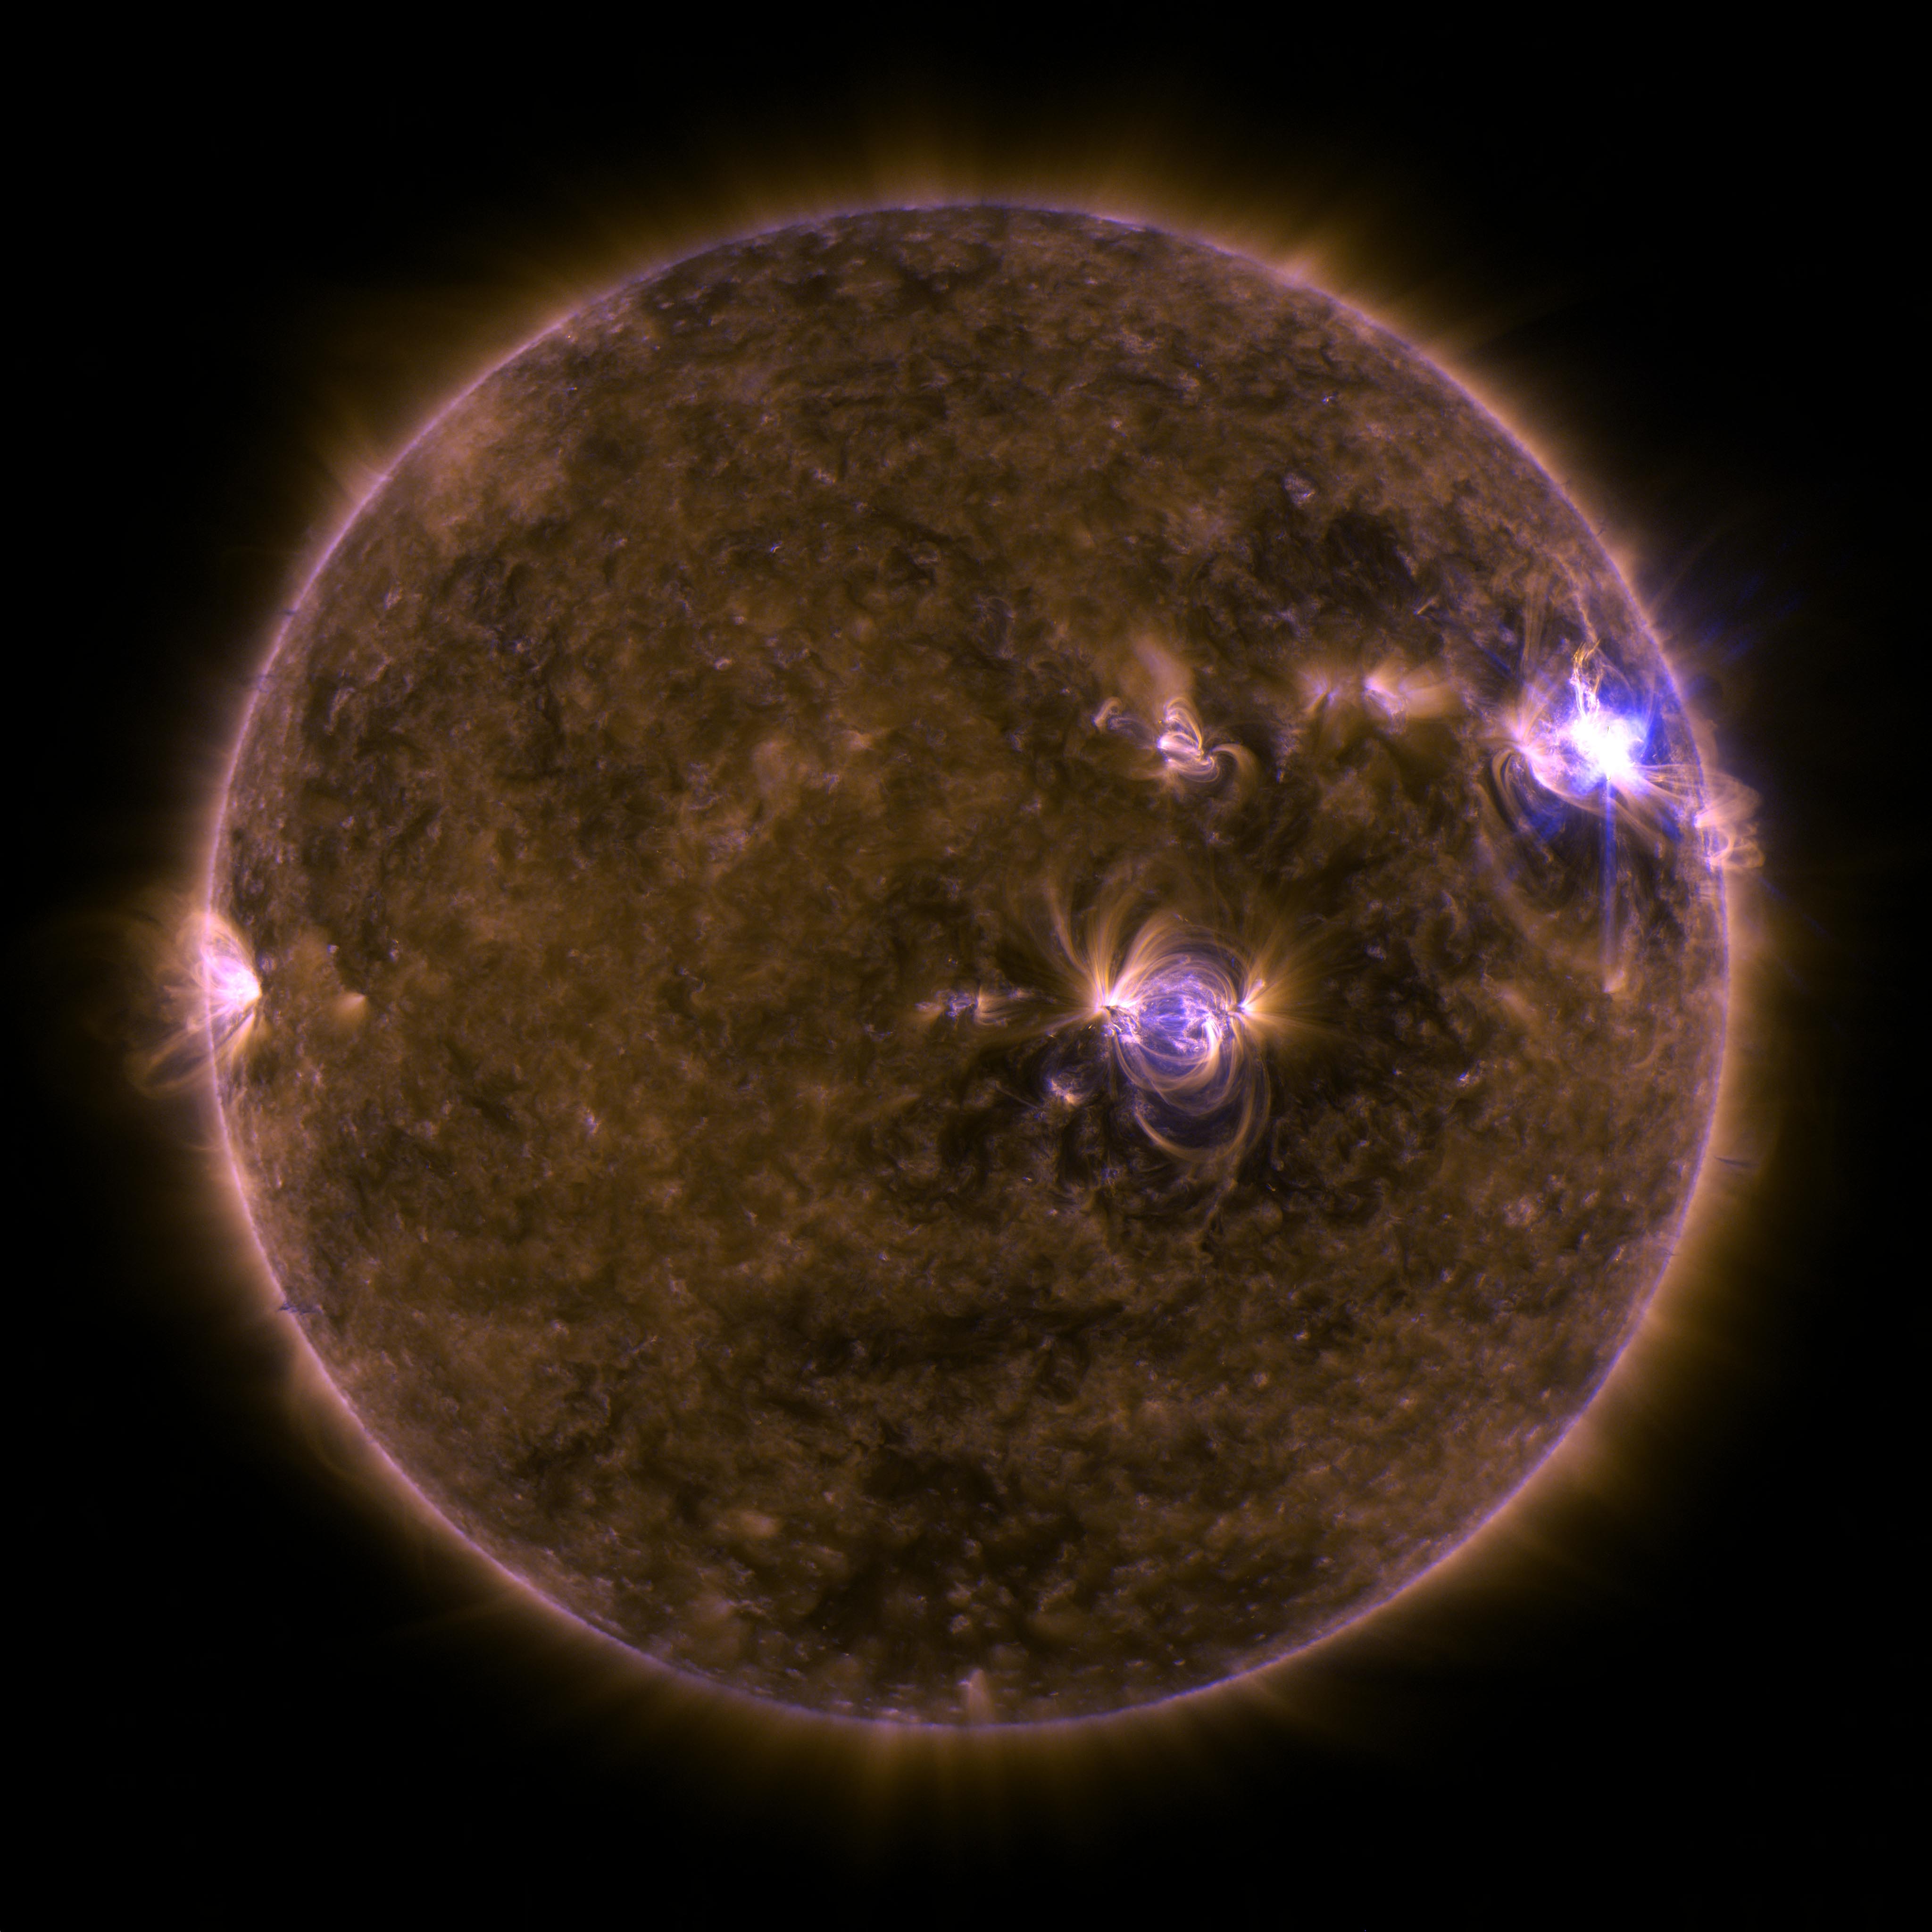
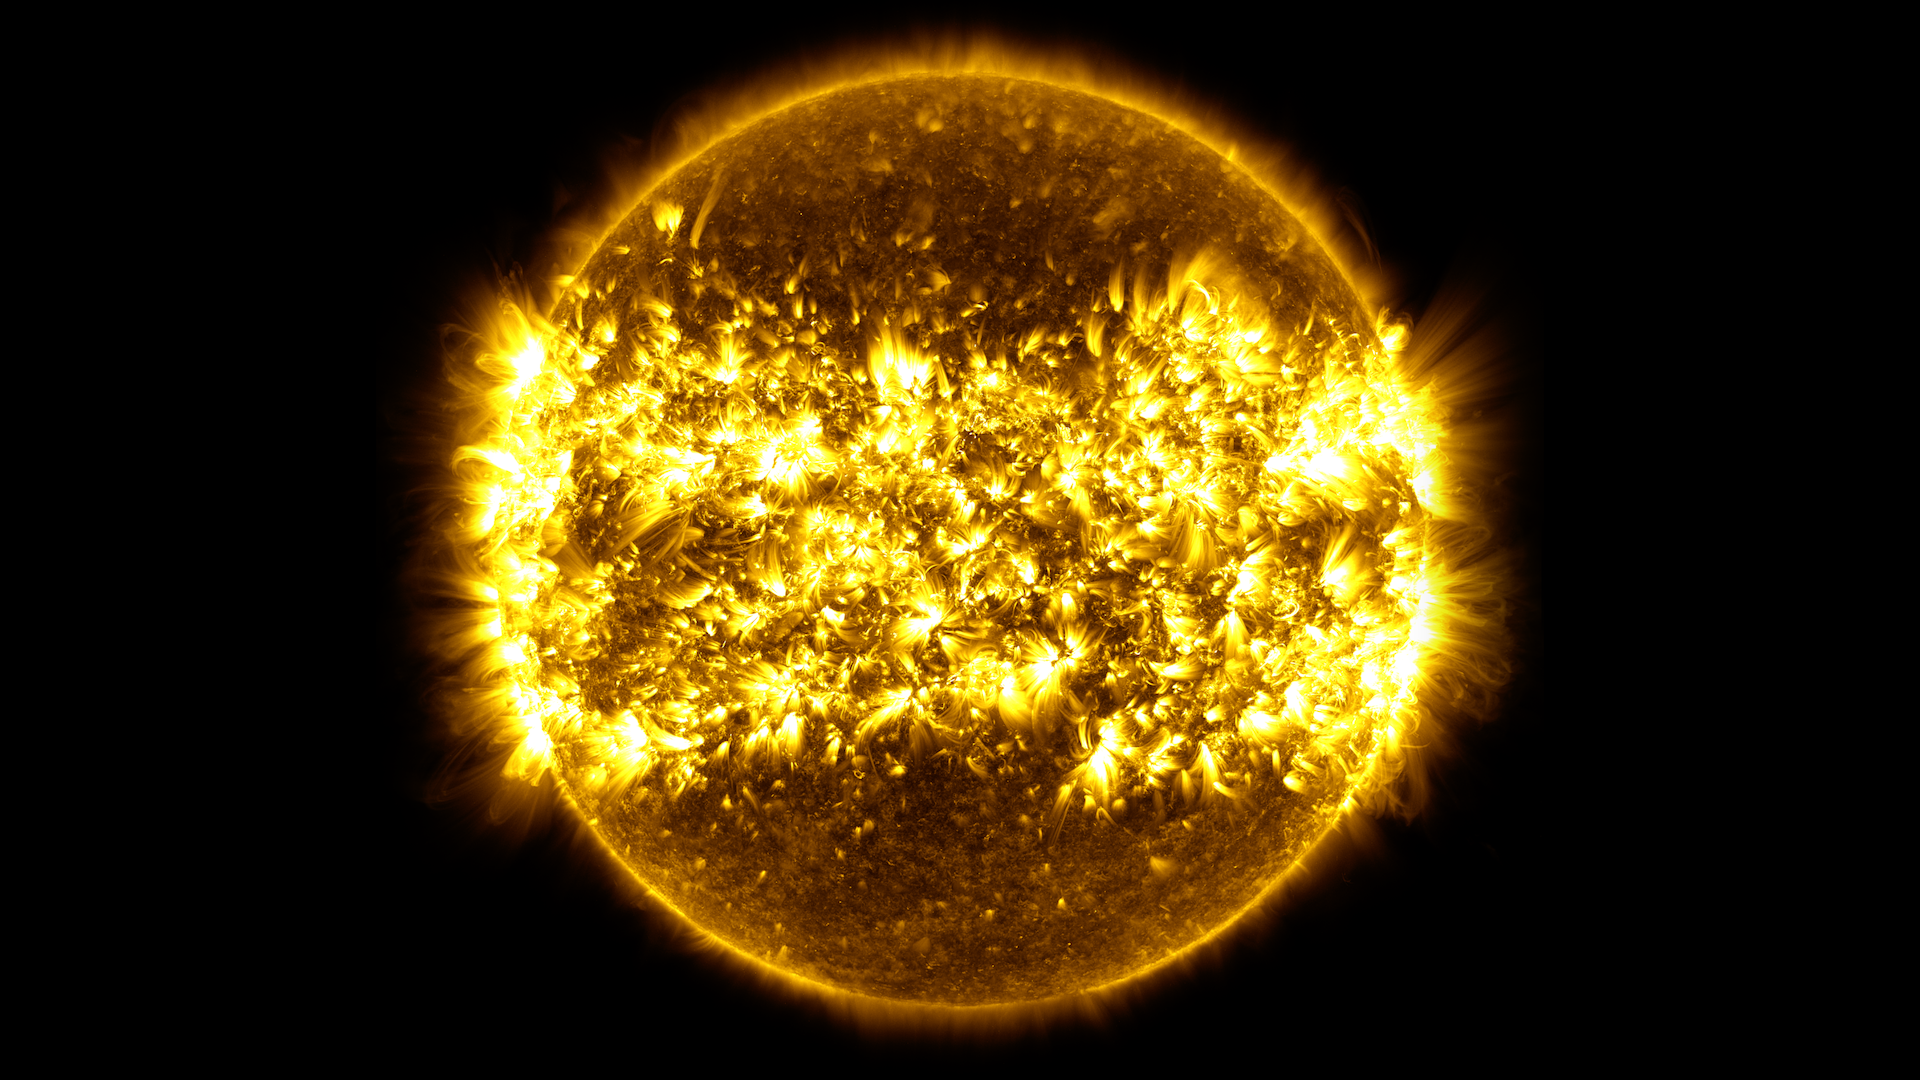
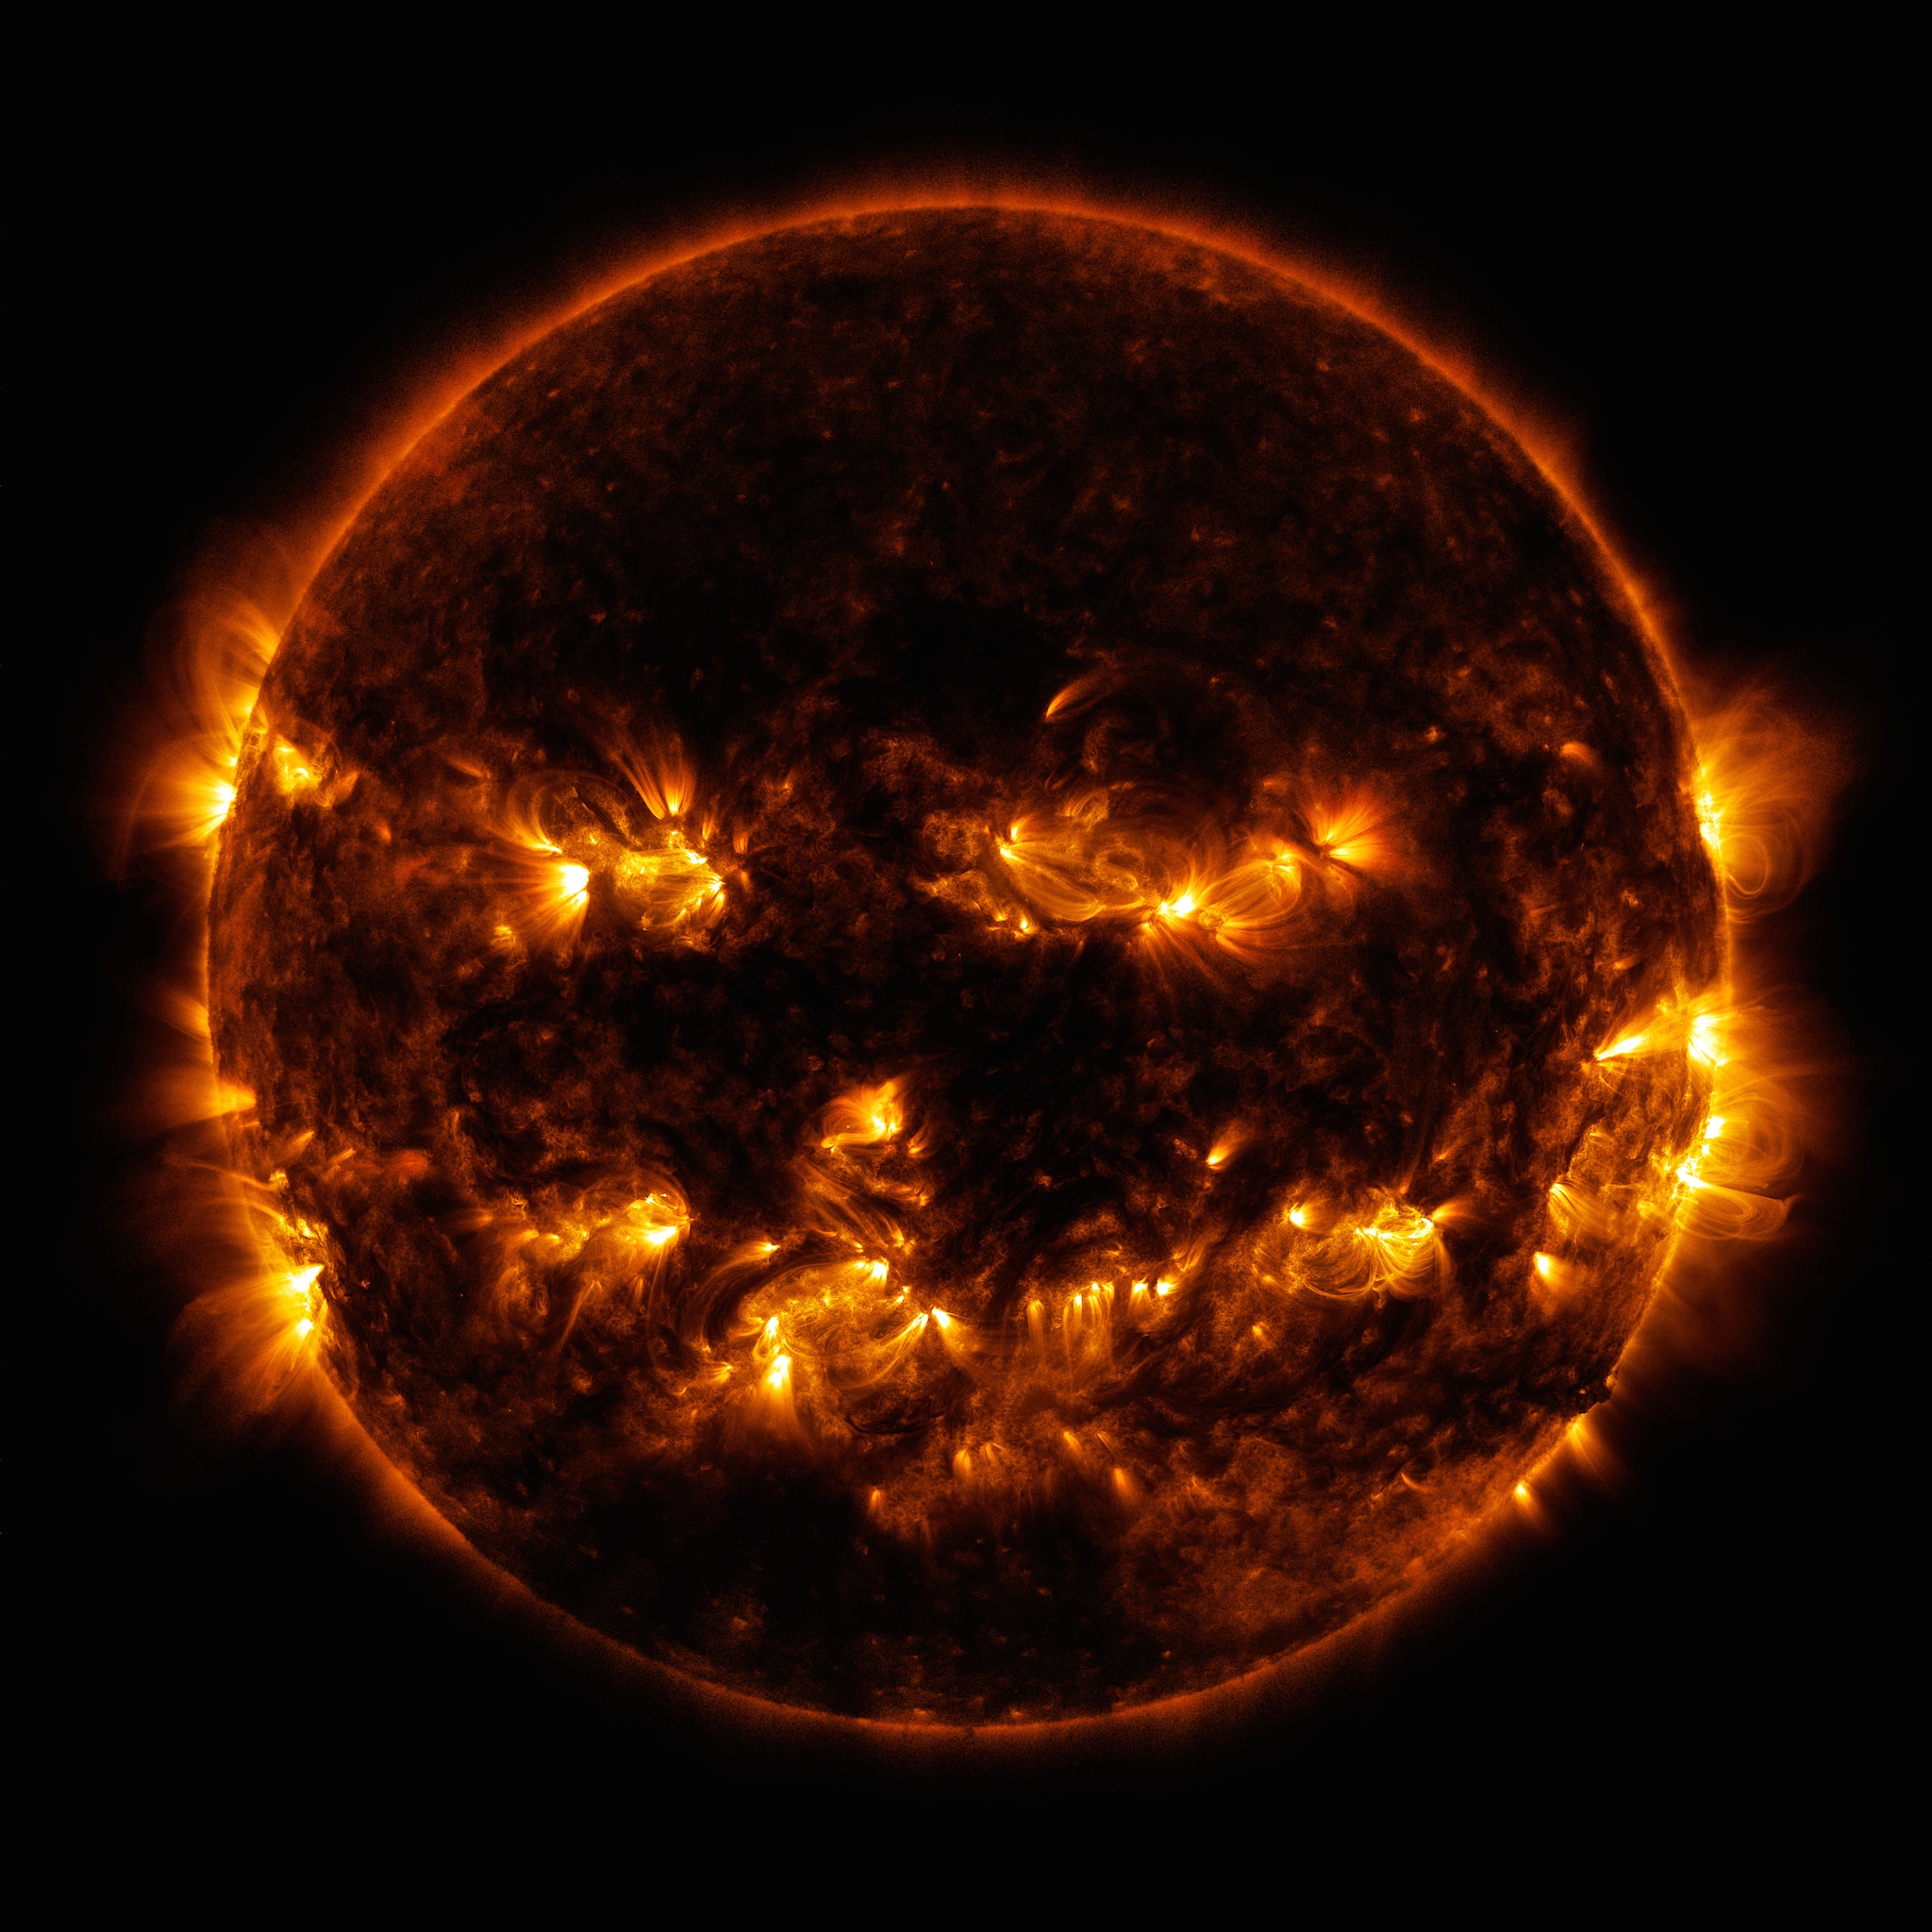
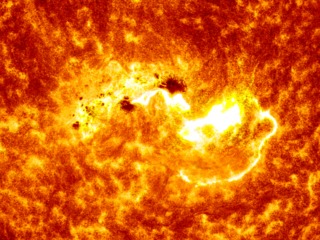
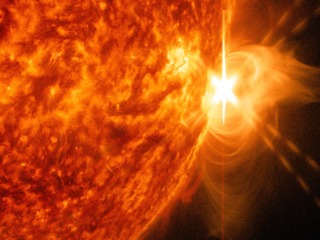
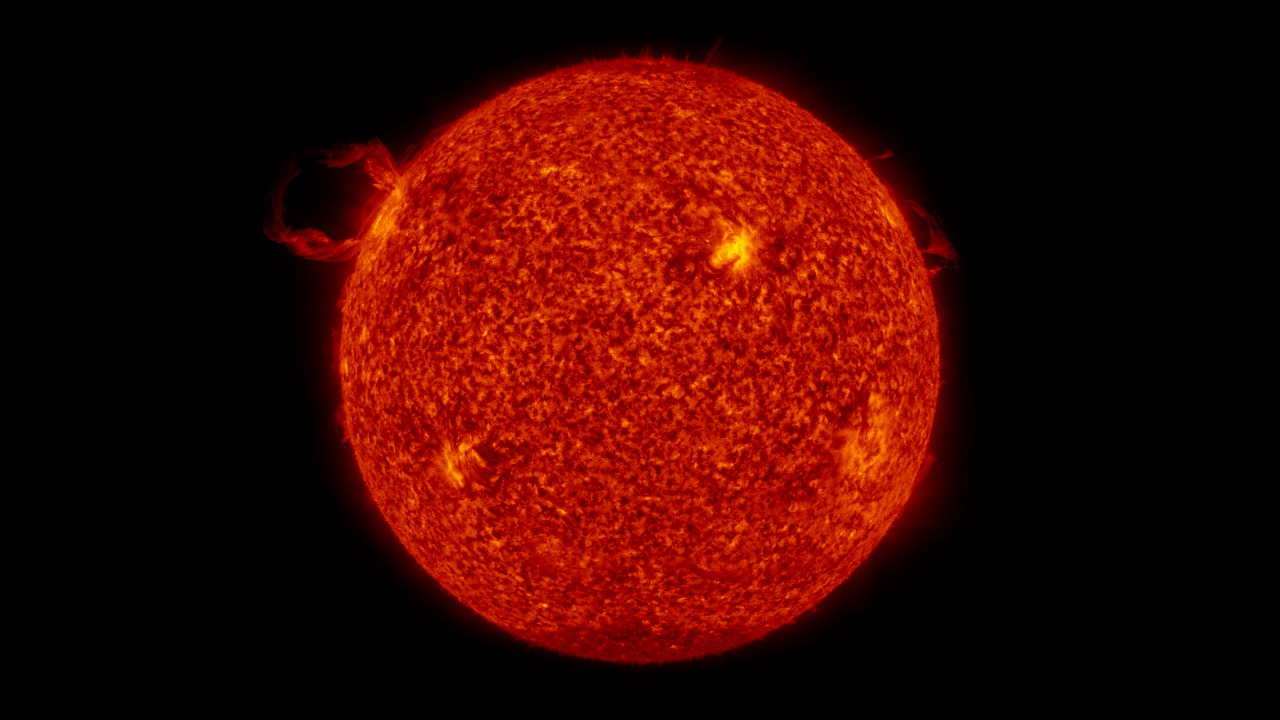
A Smiling Sun
Go to this pageSolar Dynamics Observatory image of the Sun from October, 2022 || 2022-agu-fox-slide5_print.jpg (1024x576) [144.3 KB] || 2022-agu-fox-slide5.png (3840x2160) [10.5 MB] || 2022-agu-fox-slide5_searchweb.png (320x180) [93.5 KB] || 2022-agu-fox-slide5_thm.png (80x40) [7.5 KB] || a-smiling-sun.hwshow [275 bytes] ||
2021
- ID: 4911 Visualization
Aging (Instruments) in Space
Go to this pageThe space environment is harsh not only on humans and other living organisms, but instruments also.Damage from solar energetic particles and cosmic rays can slowly degrade performance of an instrument. Fortunately there are ways to characterize and correct for this degradation. The graphics on this page are based on the tutorial AIApy: Modeling Channel Degradation over Time. ||
- ID: 4854 Visualization
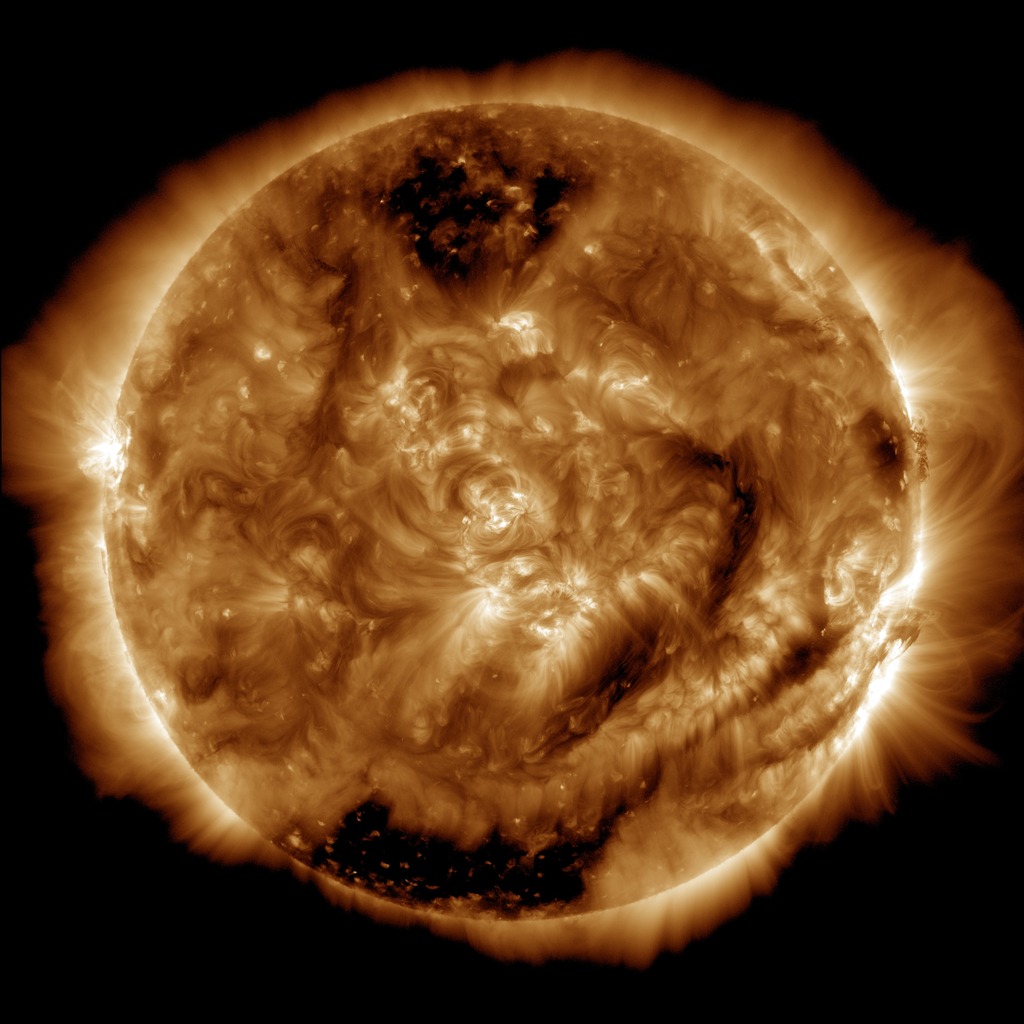
Coronal Holes at Solar Minimum and Solar Maximum
Go to this pageA sample of solar coronal holes around the time of the maximum of sunspot activity (April 2014). Note the polar regions are devoid of coronal holes but a large hole appears in the southern hemisphere. || CoronalHoleMax_AIA193_00150_print.jpg (1024x1024) [173.1 KB] || CoronalHoleMax_AIA193_00150_searchweb.png (320x180) [89.6 KB] || CoronalHoleMax_AIA193_00150_thm.png (80x40) [7.4 KB] || CoronalHoleMax_AIA193_2048p30.mp4 (2048x2048) [61.7 MB] || CoronalHoleMax_AIA193_2048p30.webm (2048x2048) [2.9 MB] || AIA193-Time (4096x4096) [64.0 KB] || AIA193-Frames (4096x4096) [64.0 KB] || CoronalHoleMax_Timestamp (600x100) [64.0 KB] ||
2020
- ID: 13673 Produced Video
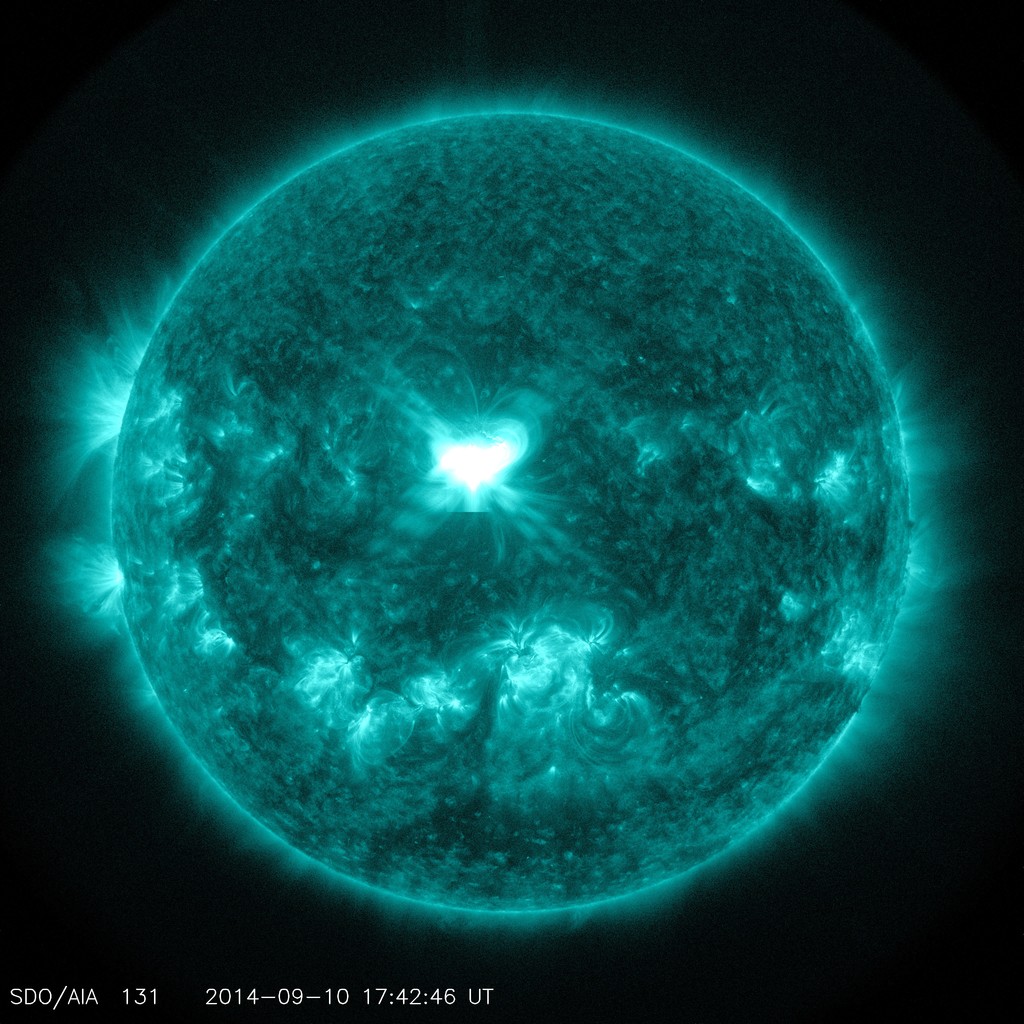
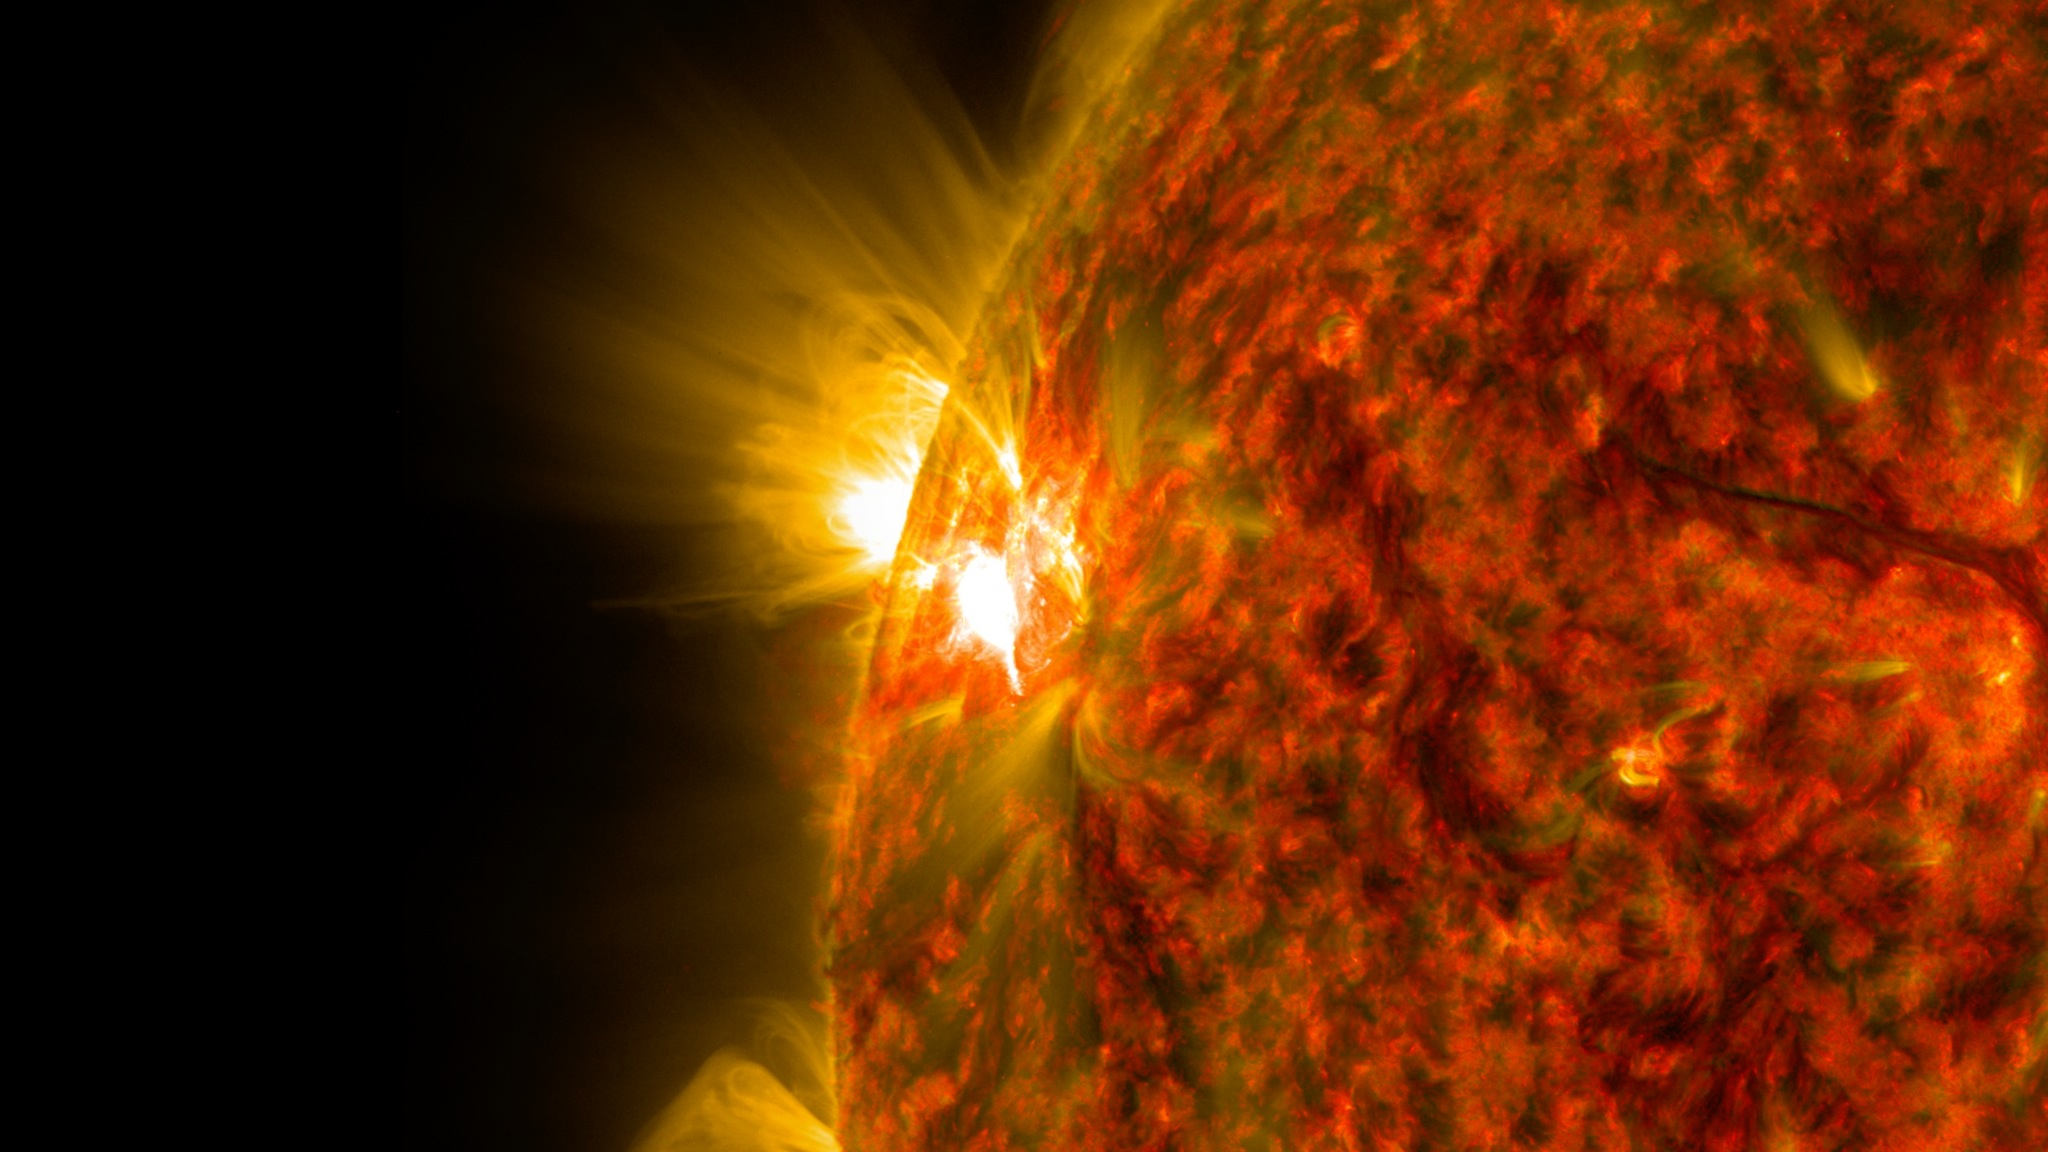
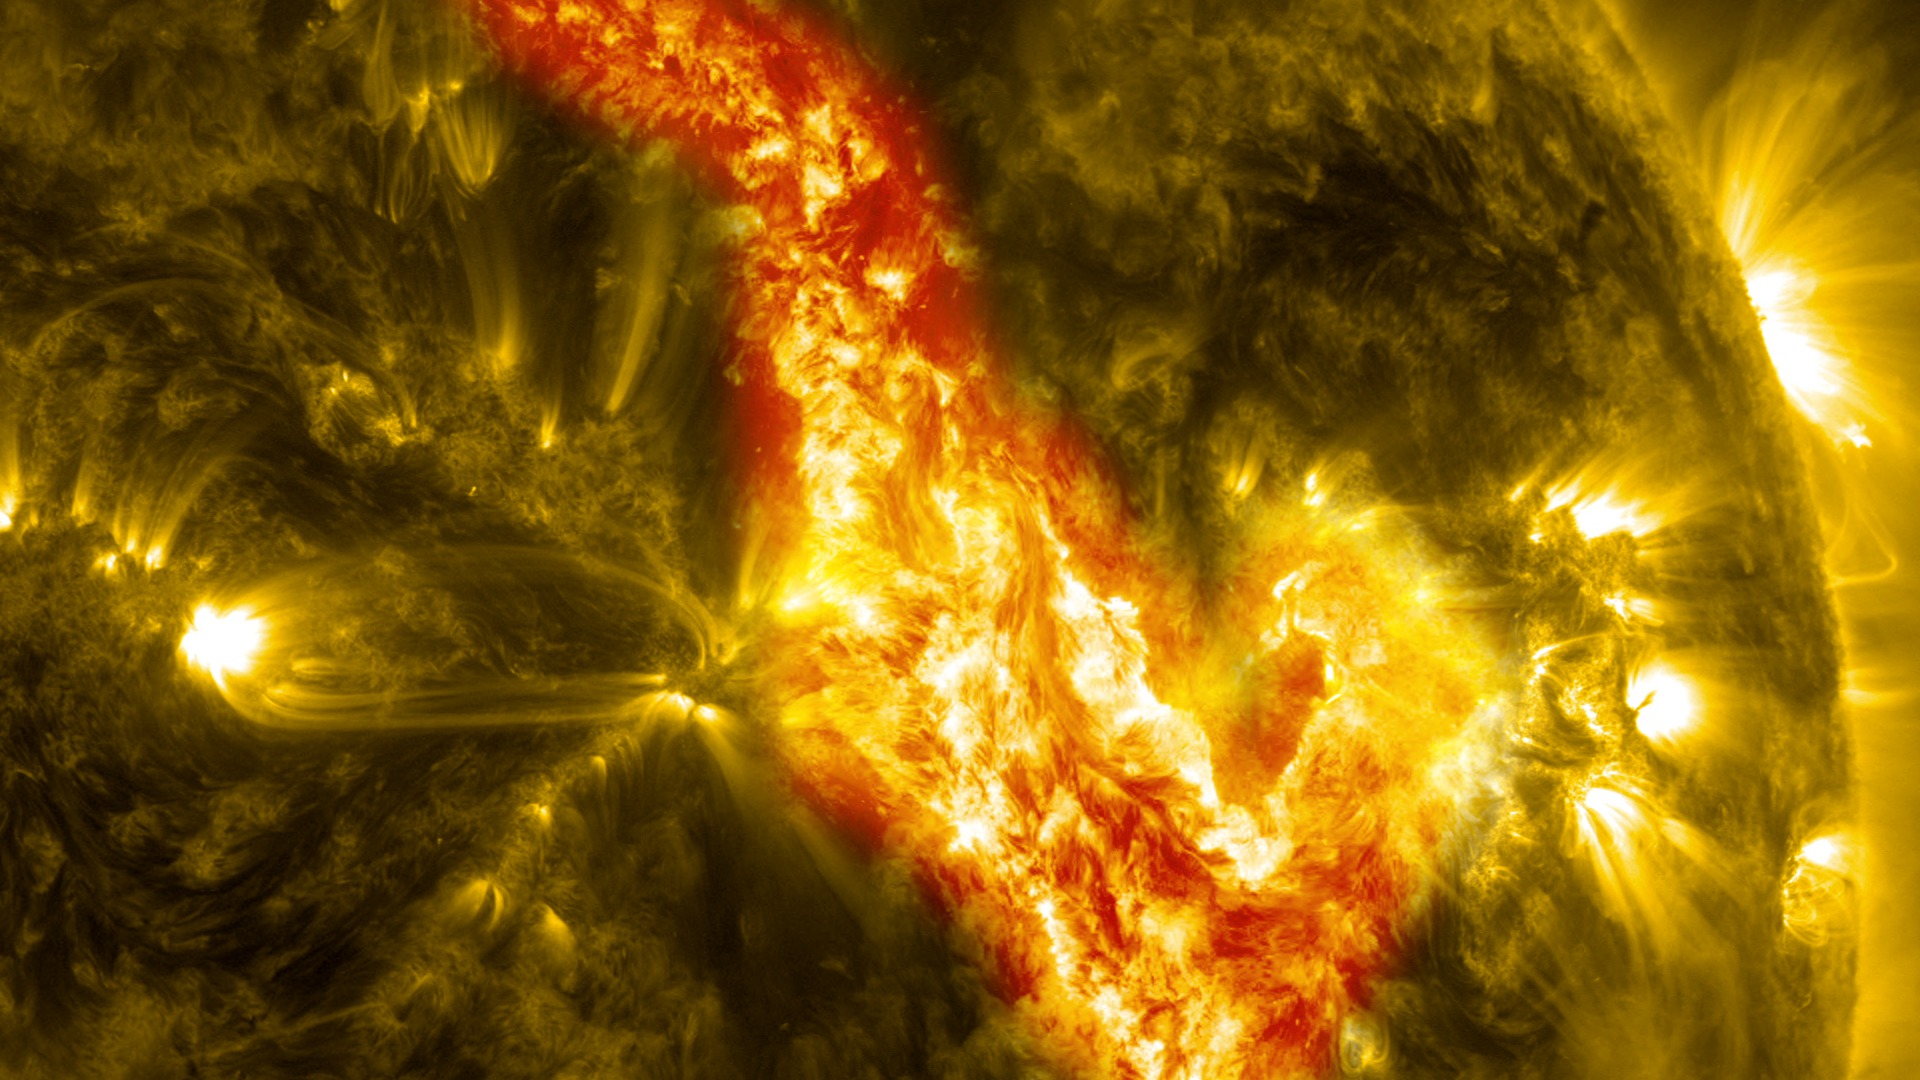
March 7, 2012 X5.4 Flare
Go to this pageAn X5.4 class solar flare flashes in the edge of the Sun on March 07, 2012. This image was captured by NASA's Solar Dynamics Observatory and shows a blend of light from the 171 and 131 angstrom wavelengths. This image was created for the July 31, 2020 issue of ScienceCredit: NASA/GSFC/SDO || 03072012Flare_171and131_Blend_print.jpg (1024x1024) [428.8 KB] || 03072012Flare_171and131_Blend.png (4096x4096) [54.3 MB] || 03072012Flare_171and131_Blend.jpg (4096x4096) [6.5 MB] || 03072012Flare_171and131_Blend_searchweb.png (320x180) [122.4 KB] || 03072012Flare_171and131_Blend_thm.png (80x40) [16.0 KB] ||
2017
- ID: 12563 Produced Video
April 2017 Solar Flare Trio
Go to this pageVideo depicting the trio of solar flares witnessed by SDO in early April 2017. Music credit: A Waltz into Darkness by Joseph BennieComplete transcript available.Watch this video on the NASA Goddard YouTube channel. || 12563_April2017_AR12644_Mflares_V3_VX-685285_youtube_hq.01880_print.jpg (1024x576) [194.4 KB] || 12563_April2017_AR12644_Mflares_V3.mov (1920x1080) [1.4 GB] || 12563_April2017_AR12644_Mflares_V3_VX-685285.mpeg (1280x720) [332.4 MB] || 12563_April2017_AR12644_Mflares_V3_VX-685285_appletv.m4v (1280x720) [49.1 MB] || PRORES_B-ROLL_12563_April2017_AR12644_Mflares_V3_VX-685285_prores.mov (1280x720) [715.1 MB] || 12563_April2017_AR12644_Mflares_V3_VX-685285_youtube_hq.mov (1920x1080) [603.9 MB] || 12563_April2017_AR12644_Mflares_V3_VX-685285_youtube_hq.webm (1920x1080) [11.0 MB] || 12563_April2017_AR12644_Mflares_V3_VX-685285_appletv_subtitles.m4v (1280x720) [49.1 MB] || 12563_April2017_AR12644_Mflares.en_US.srt [880 bytes] || 12563_April2017_AR12644_Mflares.en_US.vtt [892 bytes] || 12563_April2017_AR12644_Mflares_V3_VX-685285_ipod_sm.mp4 (320x240) [17.2 MB] ||
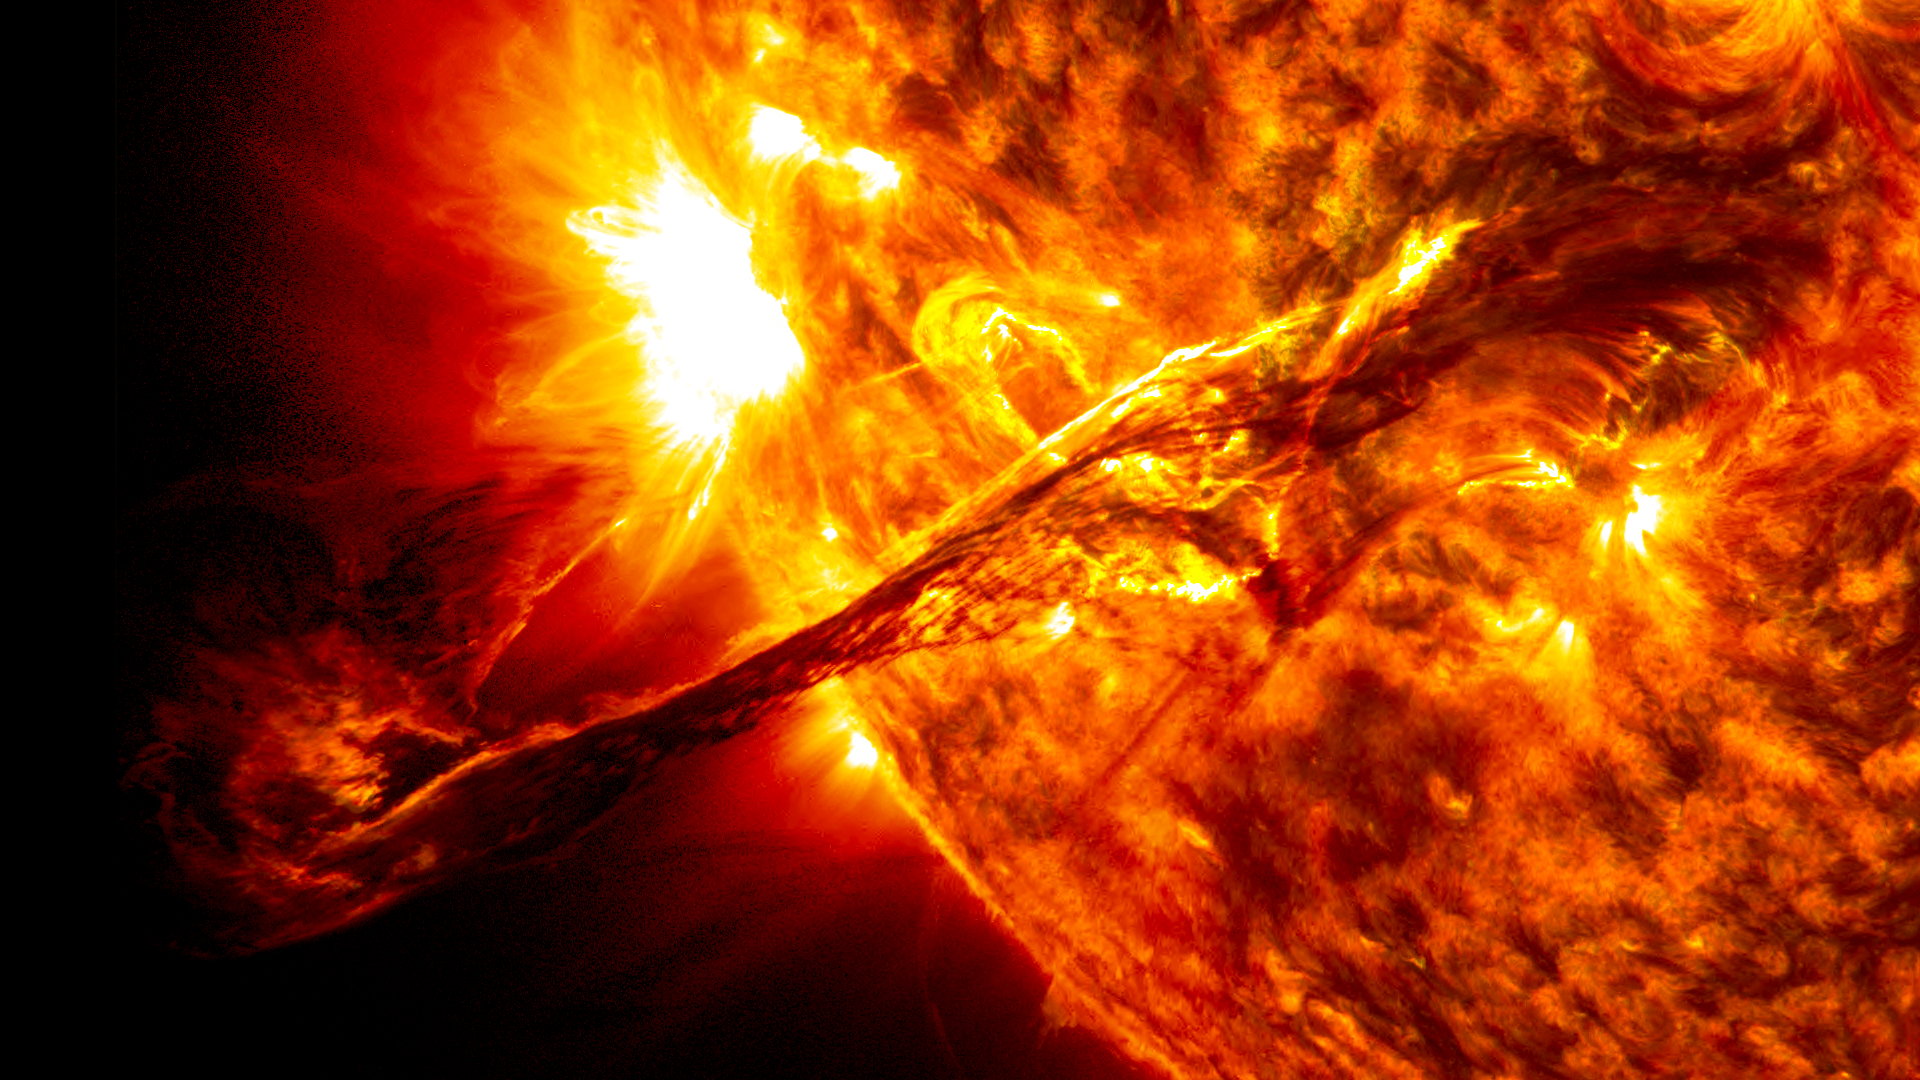
- ID: 12688 Produced Video
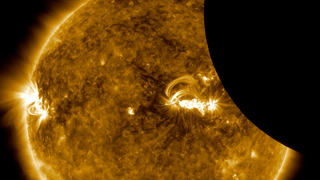
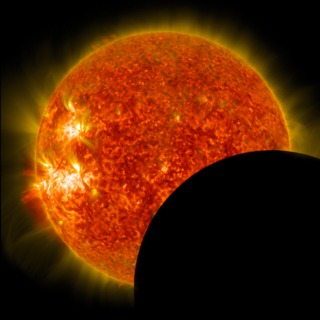
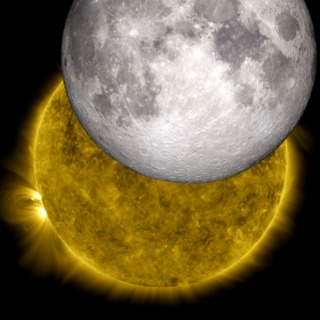
SDO's View of the August 21 Solar Eclipse
Go to this pageA movie of the Aug 21, 2017 lunar transit as viewed by the Solar Dynamics Observatory (SDO.) The Sun appears in visible light, and 171 ångstrom extreme ultraviolet light. The movie shows the Sun moving a bit because SDO has a hard time keeping the Sun centered in the image during a transit, because the Moon blocks so much light. The fine guidance systems on the SDO instruments need to see the whole Sun in order keep the images centered from exposure to exposure. Once the transit was over, the fine guidance systems started back up, once again providing steady images of the Sun.Credit: NASA/SDOWatch this video on the NASA Goddard YouTube channel. || SDO_Eclipse_Transit_Still.jpg (3840x2160) [1.4 MB] || SDO_Eclipse_Transit_Still_searchweb.png (320x180) [70.6 KB] || SDO_Eclipse_Transit_Still_thm.png (80x40) [5.5 KB] || 12688_SDO_Eclipse_Transit_H264_1080.webm (1920x1080) [4.6 MB] || 12688_SDO_Eclipse_Transit_H264_1080.mov (1920x1080) [126.4 MB] || 12688_SDO_Eclipse_Transit_H264_best_3840x2160_2997.mov (3840x2160) [378.1 MB] || 12688_SDO_Eclipse_Transit_ProRes_3840x2160_2997.mov (3840x2160) [2.7 GB] ||
- ID: 30893 Hyperwall Visual
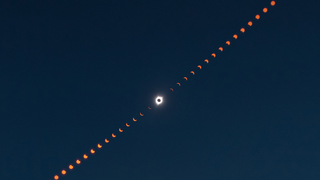
2017 Eclipse Image Collection
Go to this pageThis image is a composite photograph that shows the progression of the total solar eclipse over Madras, Oregon.http://earthobservatory.nasa.gov/NaturalHazards/view.php?id=90796 || eclipsecomposite_pho_lrg.jpg (2231x1487) [541.4 KB] || eclipsecomposite_pho_lrg_searchweb.png (320x180) [47.2 KB] || eclipsecomposite_pho_lrg_thm.png (80x40) [3.3 KB] || 2017-eclipse-images-7.hwshow [293 bytes] ||
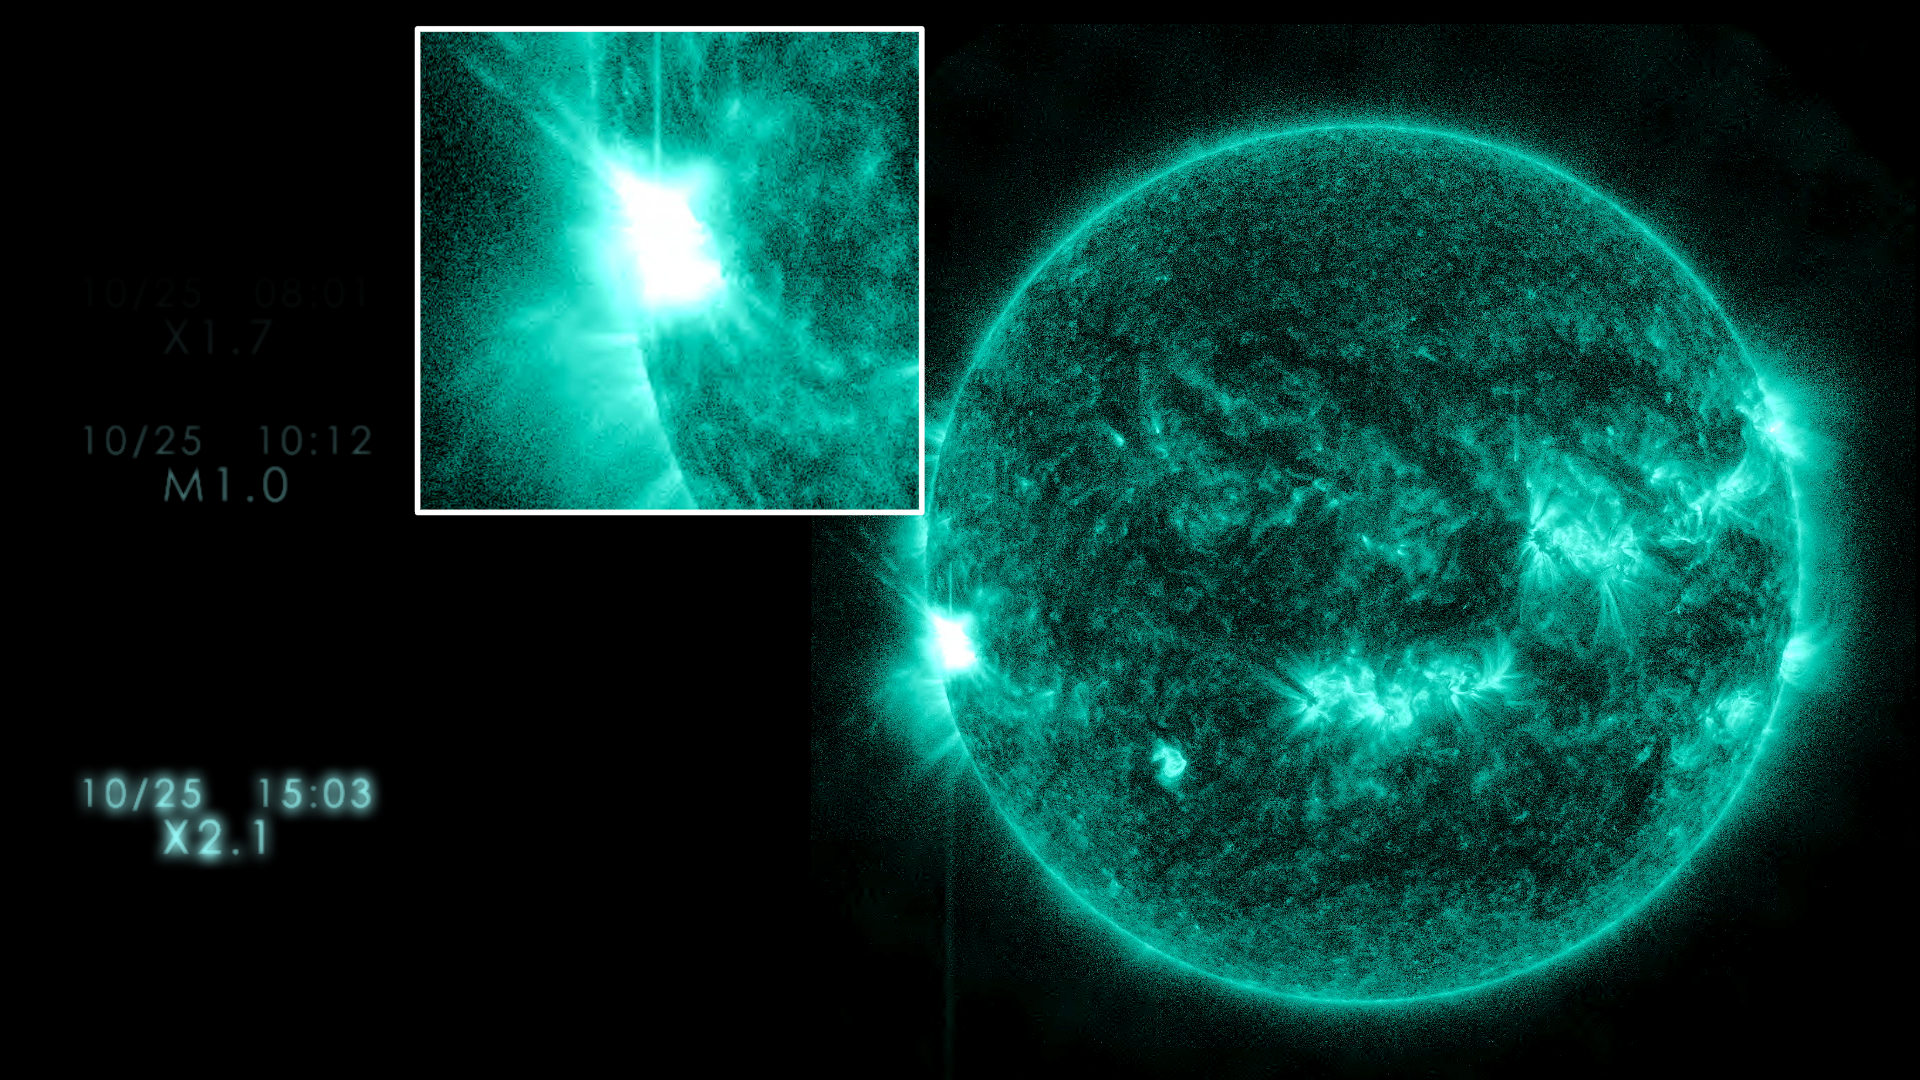
- ID: 12706 Produced Video
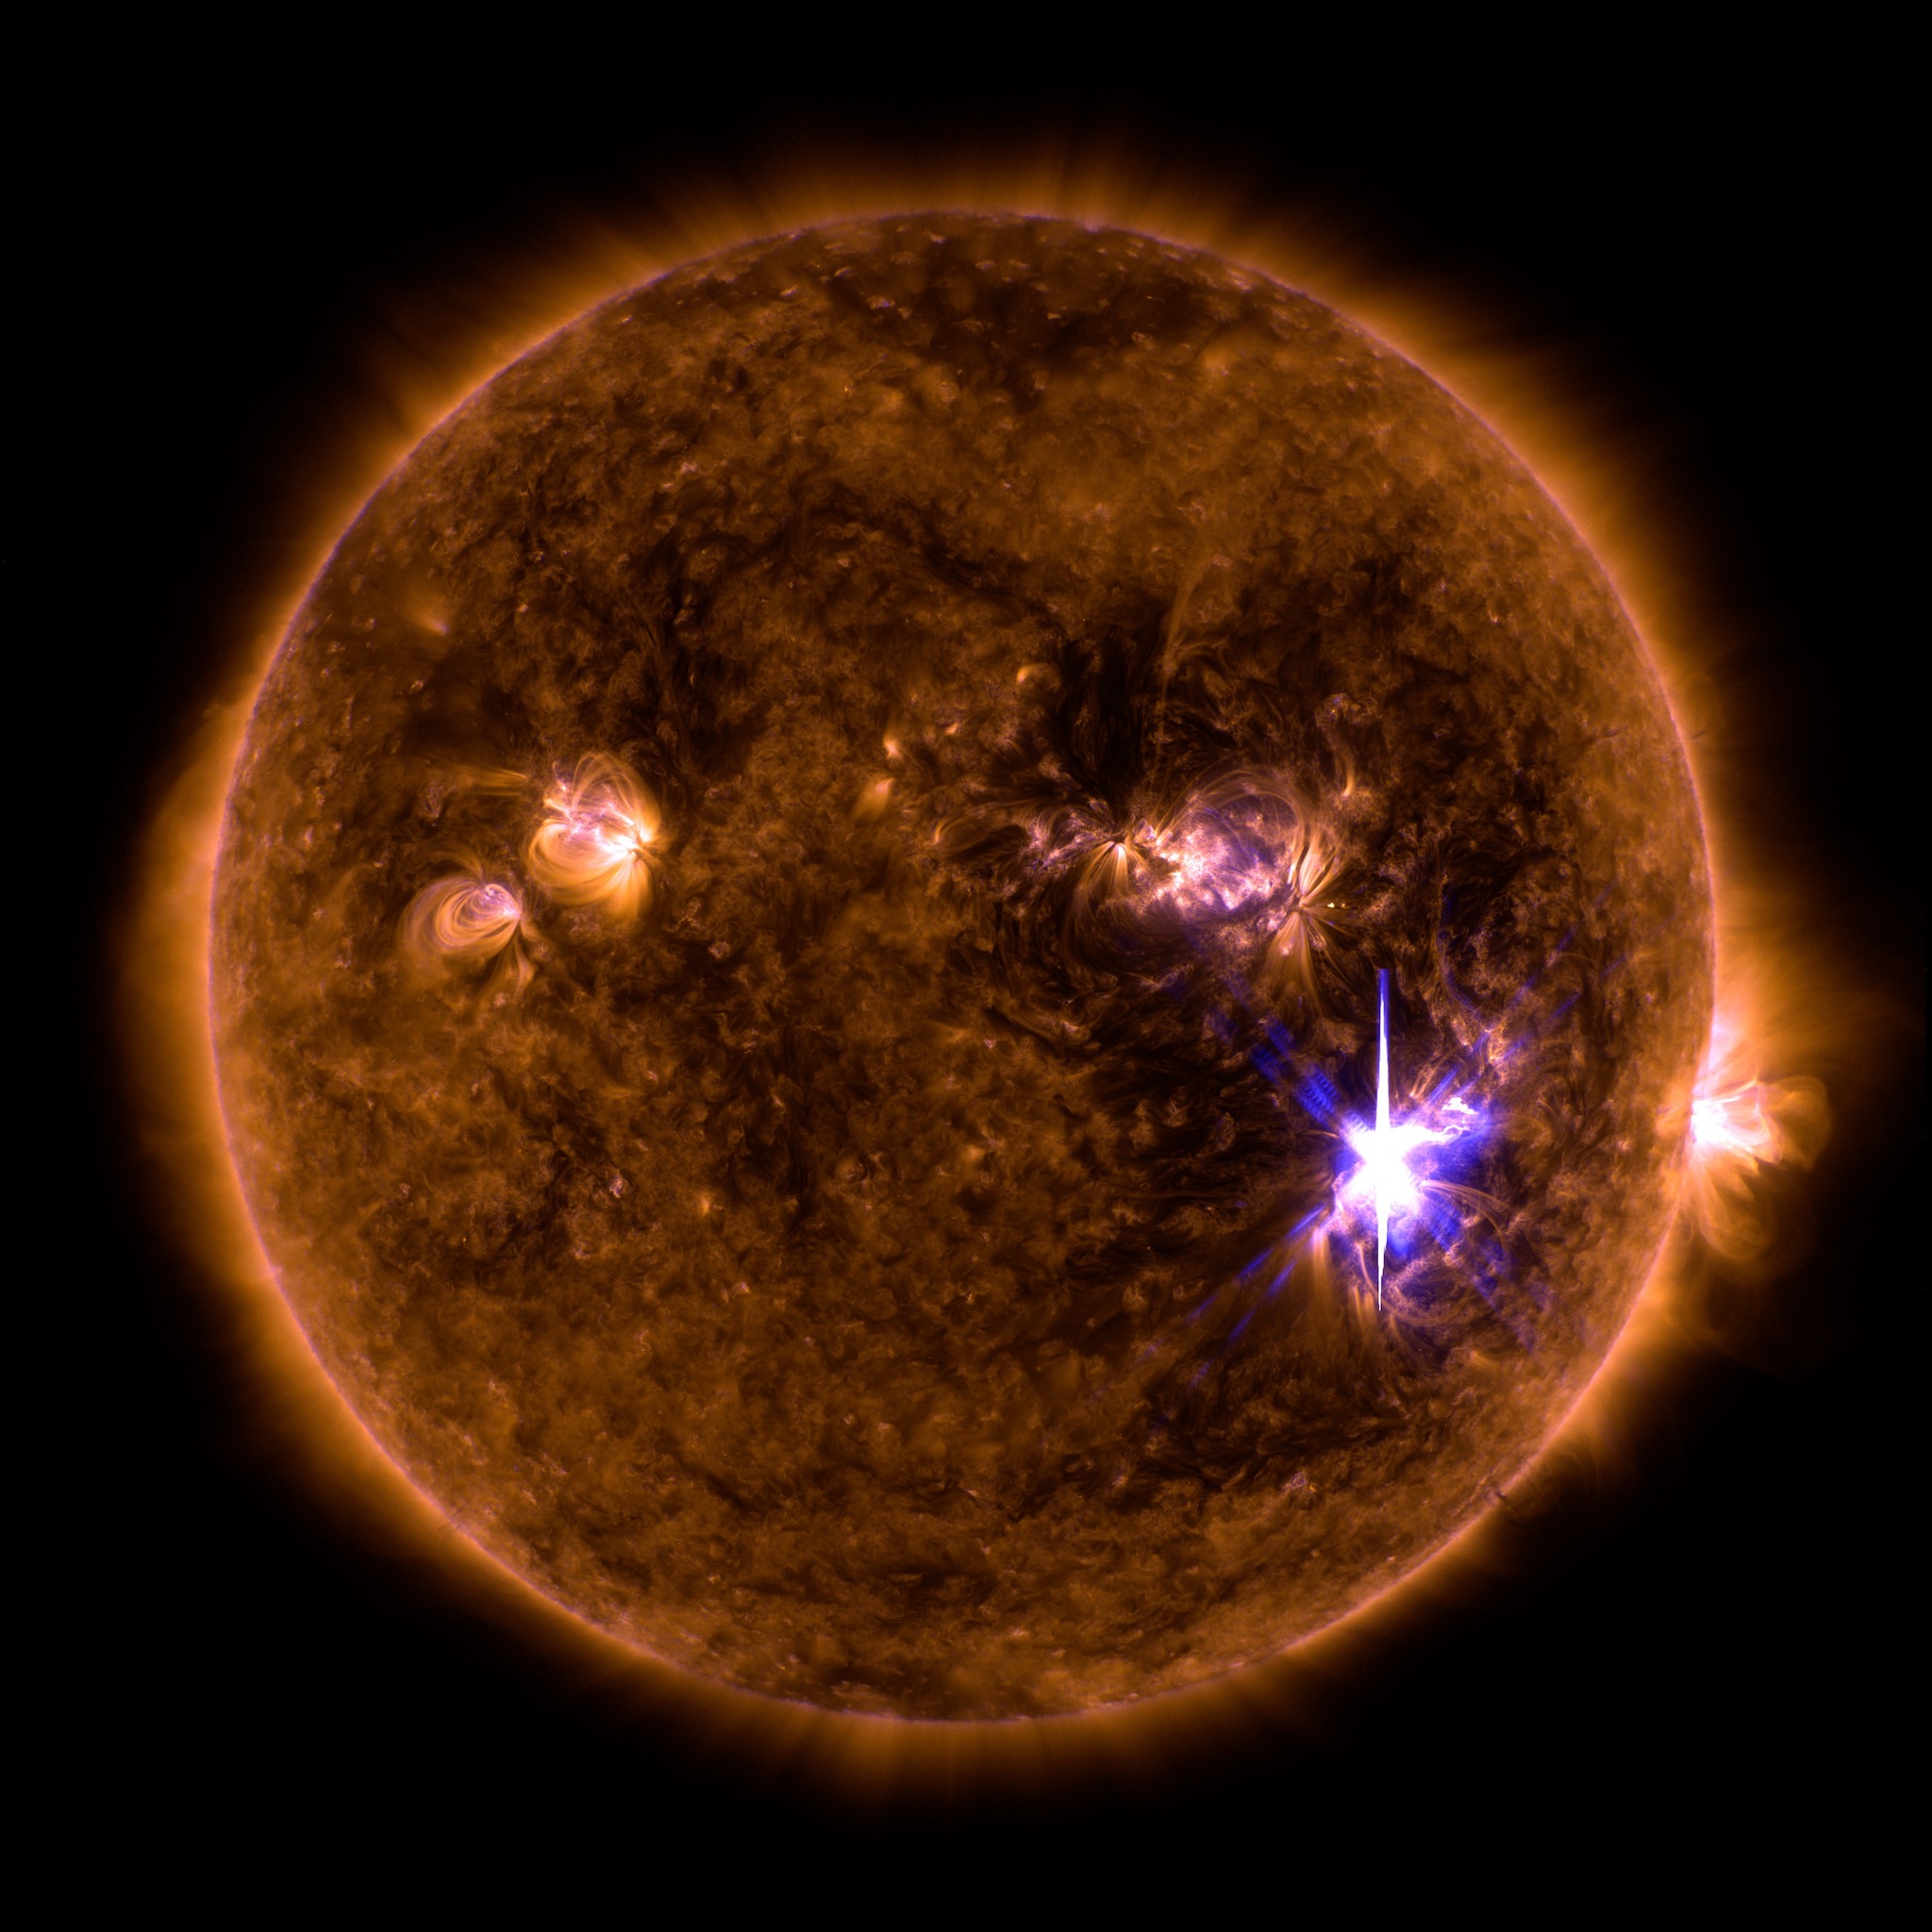
A Powerful Sequence of Flares Start September 2017
Go to this pageShort video showing the sequence of M and X flares starting on September 4, 2017 and culminating with an X9.3 flare — the largest of the solar cycle.Music: "Networked" from Killer TracksWatch this video on the NASA Goddard YouTube channel.Complete transcript available. || SDO_Flare_Still_3.jpg (1920x1080) [326.8 KB] || 12706_SDO_September_2017_Flares_ProRes_1920x1080_2997.mov (1920x1080) [2.9 GB] || 12706_SDO_September_2017_Flares_H264_Best_1080.mov (1920x1080) [1.1 GB] || 12706_SDO_September_2017_Flares_H264_Good_1080.m4v (1920x1080) [223.8 MB] || 12706_SDO_September_2017_Flares_Compatible.m4v (960x540) [90.1 MB] || 12706_SDO_September_2017_Flares_Compatible.webm (960x540) [23.8 MB] || 12706_SDO_September_2017_Flares_SRT_Captions.en_US.srt [2.4 KB] || 12706_SDO_September_2017_Flares_SRT_Captions.en_US.vtt [2.3 KB] ||
2016
- ID: 12144 Produced Video
SDO: Year 6
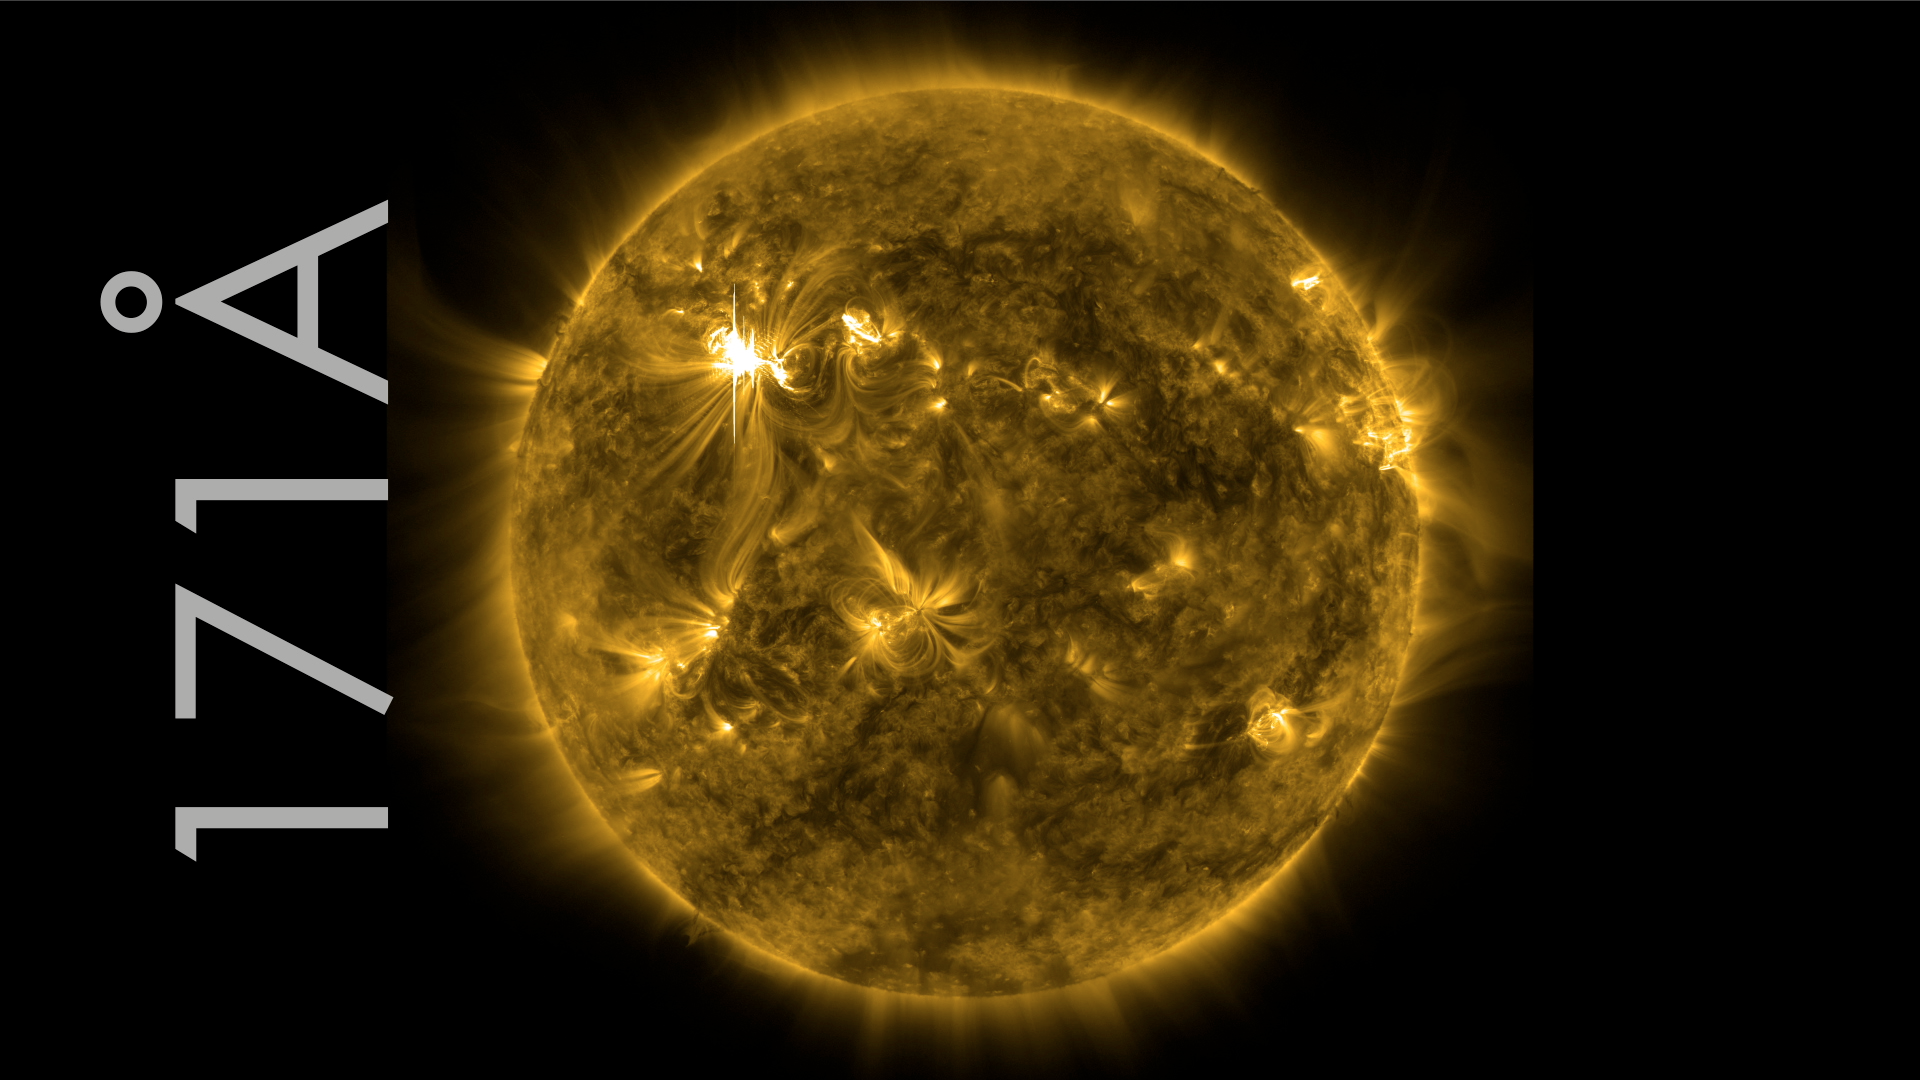
Go to this pageThis ultra-high definition (3840x2160) video shows the sun in the 171 angstrom wavelength of extreme ultraviolet light. It covers a time period of January 2, 2015 to January 28, 2016 at a cadence of one frame every hour, or 24 frames per day. This timelapse is repeated with narration by solar scientist Nicholeen Viall and contains close-ups and annotations. 171 angstrom light highlights material around 600,000 Kelvin and shows features in the upper transition region and quiet corona of the sun. The video is available to download here at 59.94 frames per second, double the rate YouTube currently allows for UHD content. The music is titled "Tides" and is from Killer Tracks.Watch this video on the NASA Goddard YouTube channel.Complete transcript available. || SDO_Year6_HCblend_HD.png (1920x1080) [5.3 MB] || SDO_Year6_HCblend_HD.jpg (1920x1080) [545.9 KB] || SDO_Year6_HCblend_HD_print.jpg (1024x576) [179.5 KB] || SDO_Year6_HCblend_UHD.png (3840x2160) [19.7 MB] || SDO_Year6_HCblend_UHD.jpg (3840x2160) [1.2 MB] || SDO_Year6_HCblend_HD_searchweb.png (180x320) [59.6 KB] || SDO_Year6_HCblend_HD_thm.png (80x40) [4.8 KB] || 12144_SDO_Year_6_appletv.webm (1280x720) [50.5 MB] || 12144_SDO_Year_6_appletv.m4v (1280x720) [241.9 MB] || 12144_SDO_Year_6_appletv_appletv_subtitles.m4v (1280x720) [242.1 MB] || SDO_Year_6_SRT_Captions.en_US.srt [6.3 KB] || SDO_Year_6_SRT_Captions.en_US.vtt [6.3 KB] || 12144_SDO_Year_6_H264_Good_1920x1080_2997.mov (1920x1080) [1.4 GB] || 12144_SDO_Year_6_H264_Good_3840x2160_2997.mov (3840x2160) [9.1 GB] || 12144_SDO_Year_6_H264_Good_3840x2160_5994.mov (3840x2160) [10.2 GB] || 12144_SDO_Year_6_ProRes_3840x2160_5994.mov (3840x2160) [50.3 GB] ||
- ID: 12235 Produced Video
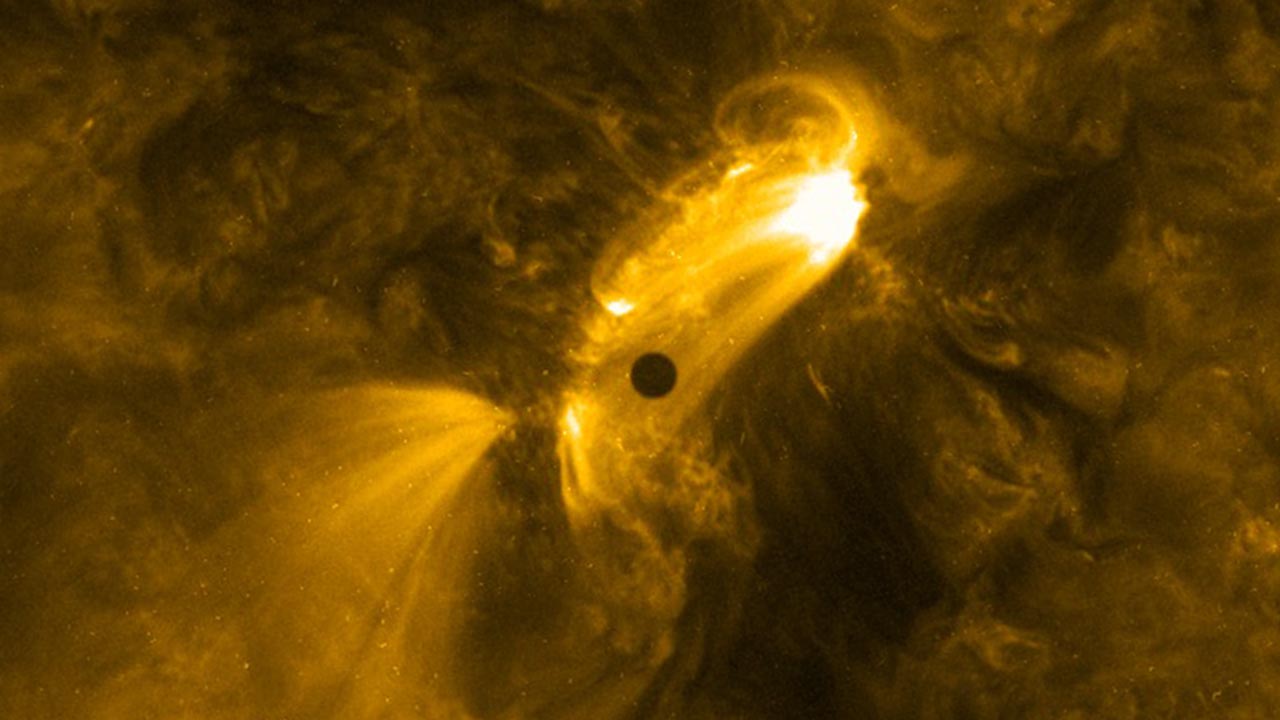
2016 Mercury Transit Timelapse
Go to this pageComplete transcript available.Watch this video on the NASA Goddard YouTube channel.Music: Encompass by Mark Petrie || 2016mercurytransitthumb.jpg (1280x720) [99.4 KB] || 2016mercurytransitthumb_searchweb.png (320x180) [99.9 KB] || 2016mercurytransitthumb_thm.png (80x40) [15.6 KB] || 12235_Mercury_Transit_2016_1080_appletv.m4v (1280x720) [77.4 MB] || 12235_Mercury_Transit_2016_1080_youtube_hq.webm (1920x1080) [16.1 MB] || 12235_Mercury_Transit_2016_1080_appletv_subtitles.m4v (1280x720) [77.5 MB] || 12235_Mercury_Transit_transcriptPH.en_US.srt [1.2 KB] || 12235_Mercury_Transit_transcriptPH.en_US.vtt [1.2 KB] || PRORES_B-ROLL_12235_Mercury_Transit_2016_1080_prores.mov (1280x720) [1.0 GB] || 12235_Mercury_Transit_2016_1080_youtube_hq.mov (1920x1080) [975.3 MB] || 12235_Mercury_Transit_2016_1080.mov (1920x1080) [1.9 GB] || 12235_Mercury_Transit_2016_1080_ipod_sm.mp4 (320x240) [25.6 MB] ||
- ID: 12292 Produced Video
Solar Highlights of 2016/2017
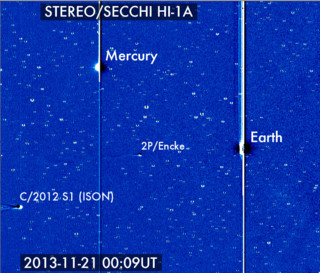
Go to this pageA collection of solar highlights featuring:- NASA's Solar Dynamics Observatory (SDO)- NASA's Interface Region Imaging Spectrograph (IRIS) mission- ESA/NASA's Solar and Heliospheric Observatory (SOHO)- NASA's Solar TErrestrial RElations Observatory (STEREO) mission ||
- ID: 12326 Produced Video
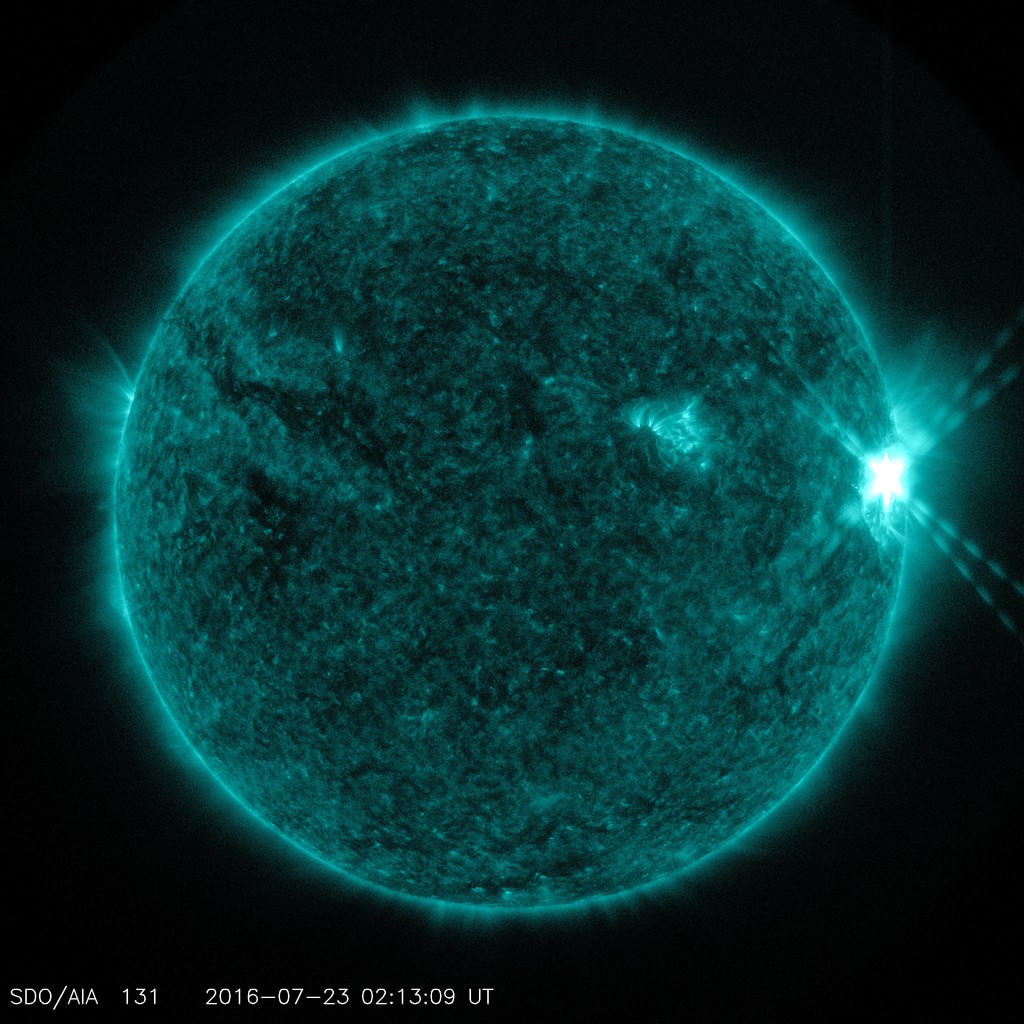
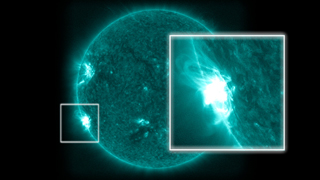
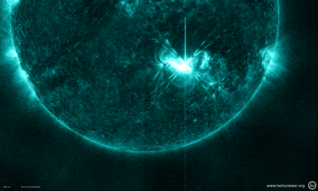
SDO Sees Trio of Mid-Level Flares
Go to this pageThe sun emitted three mid-level solar flares on July 22-23, 2016, the strongest peaking at 1:16 am EDT on July 23. The sun is currently in a period of low activity, moving toward what's called solar minimum when there are few to no solar eruptions – so these flares were the first large ones observed since April. They are categorized as mid-strength flares, substantially less intense than the most powerful solar flares. ||
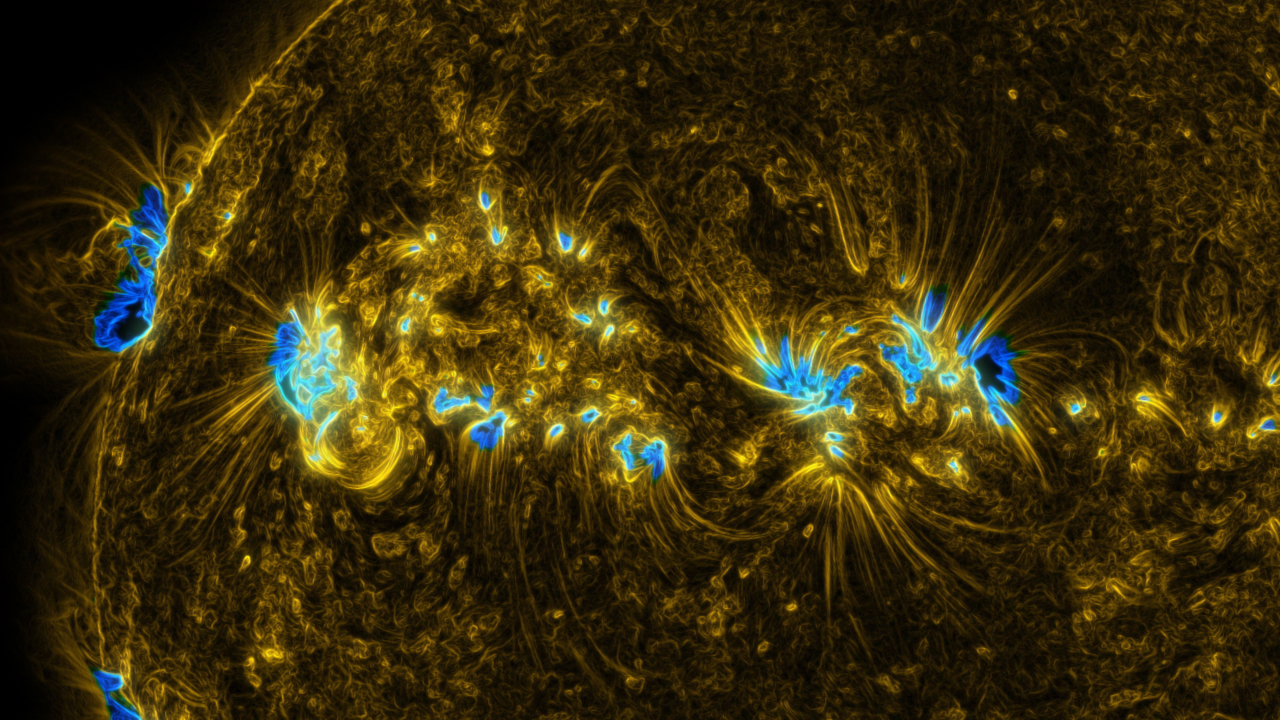
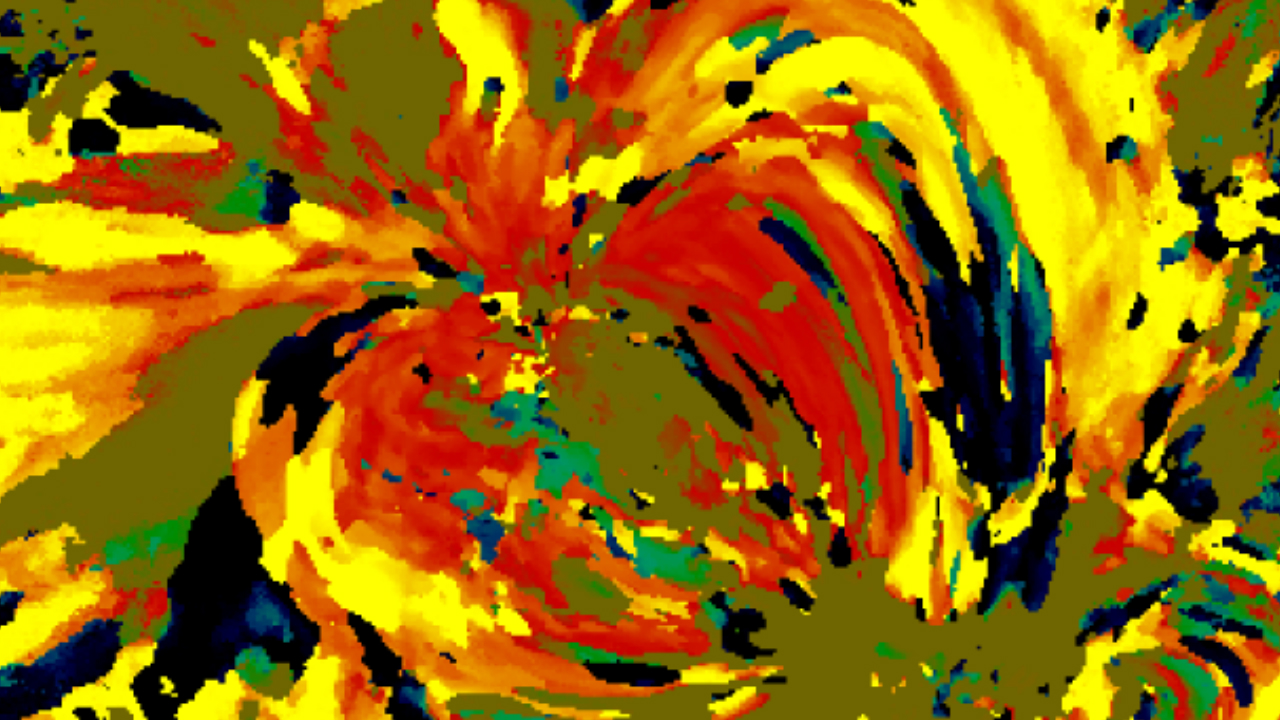
- ID: 4269 Visualization
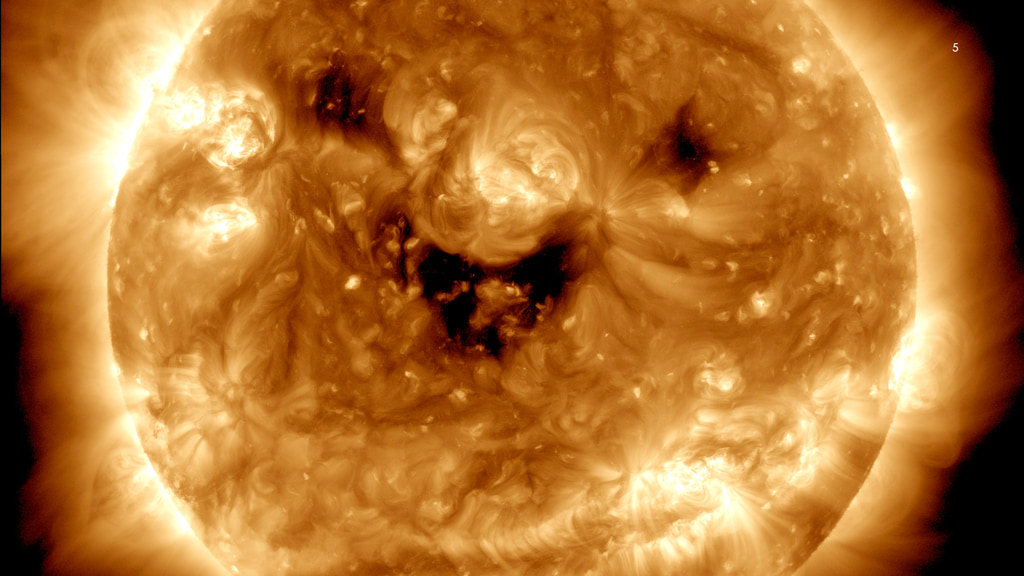
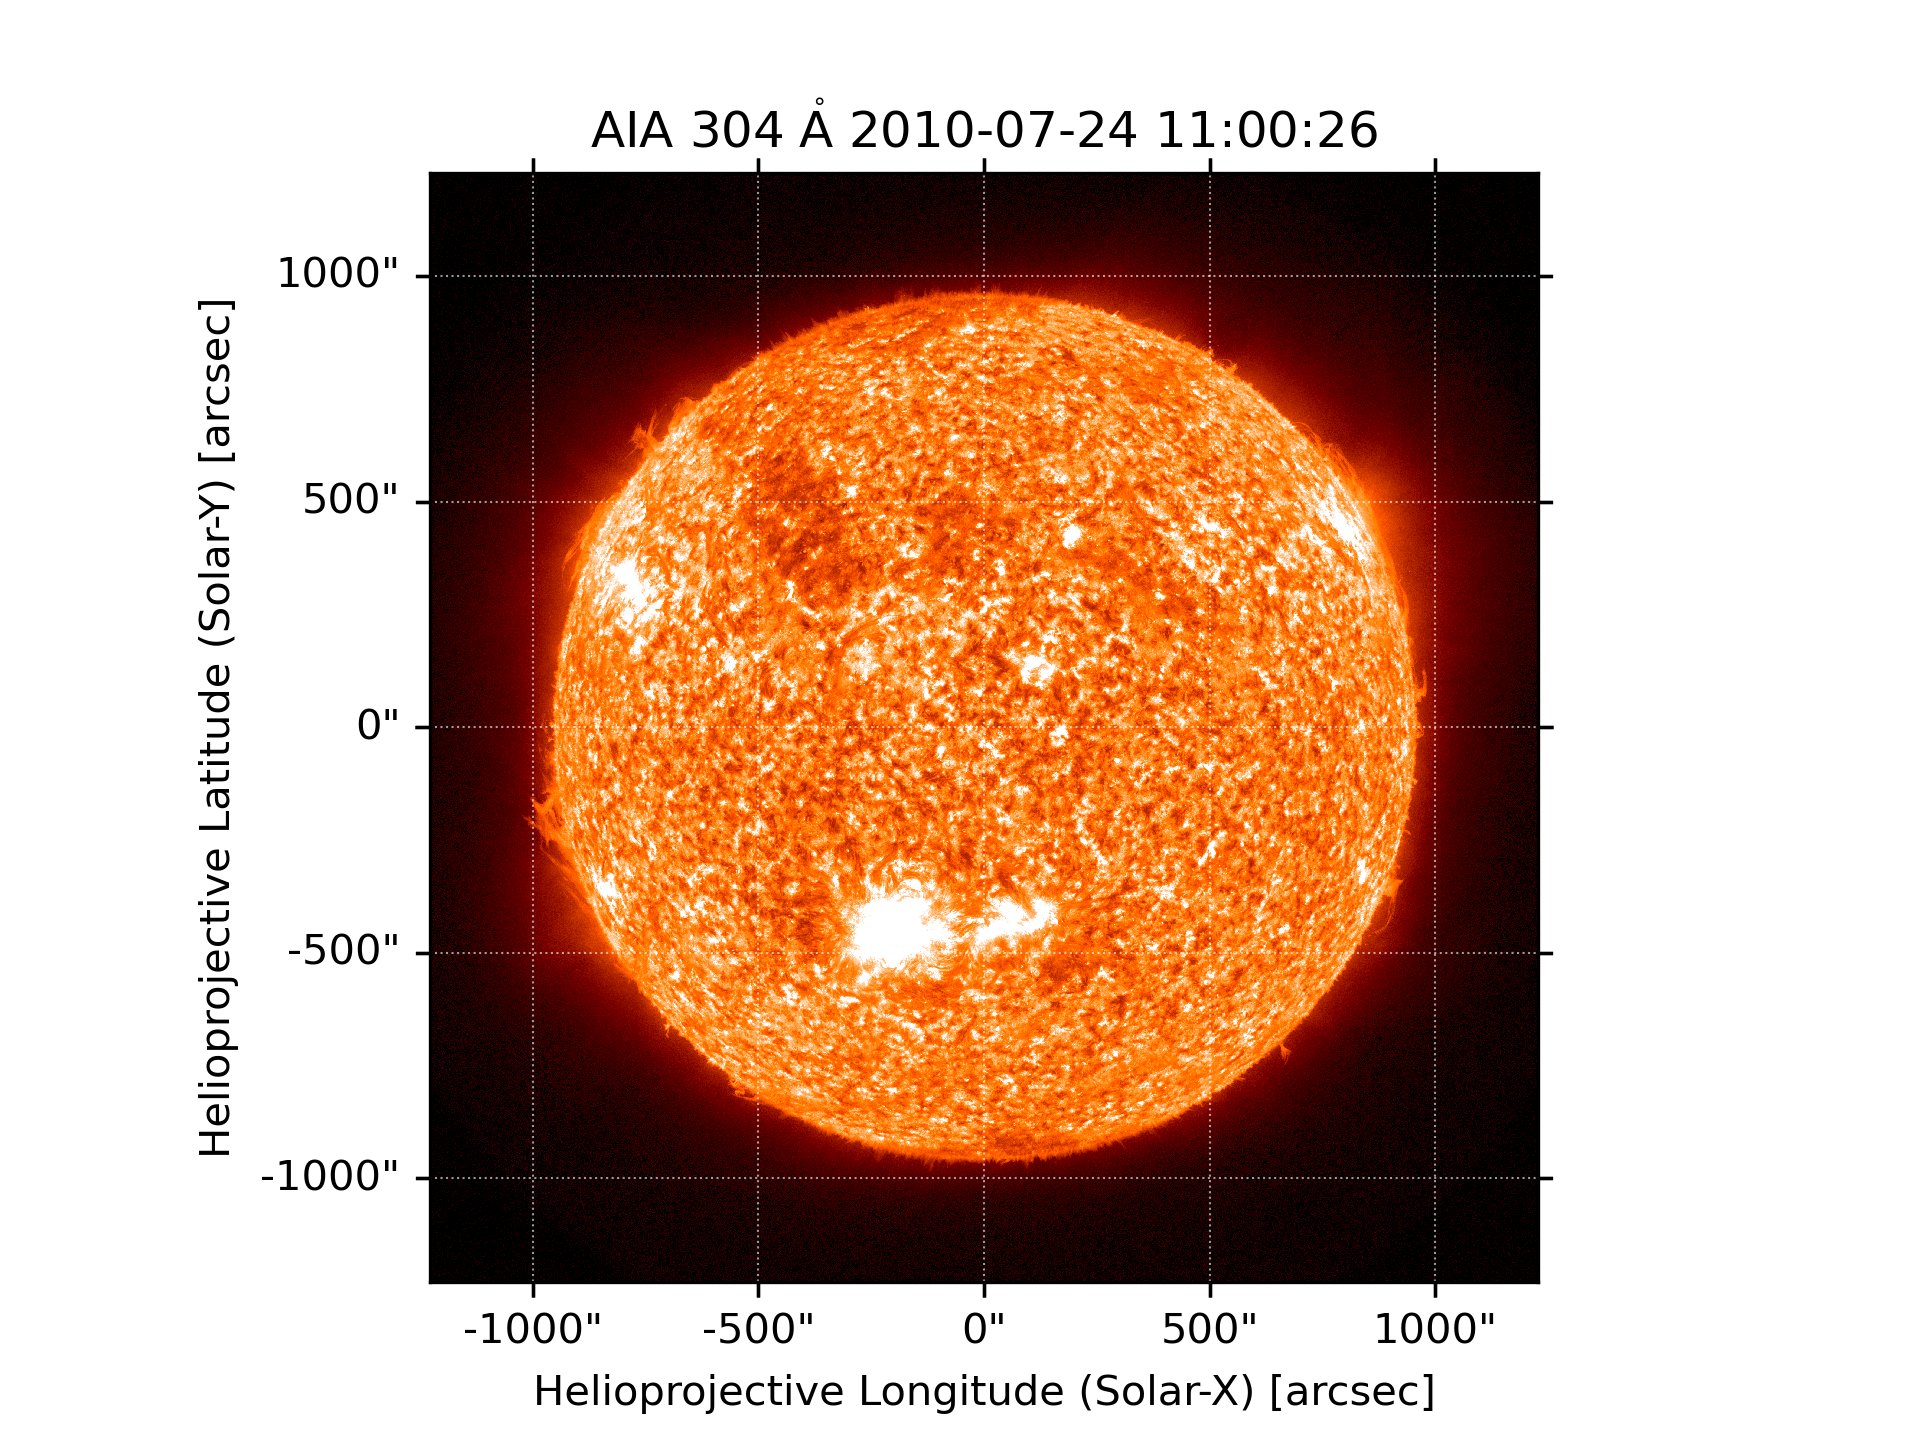
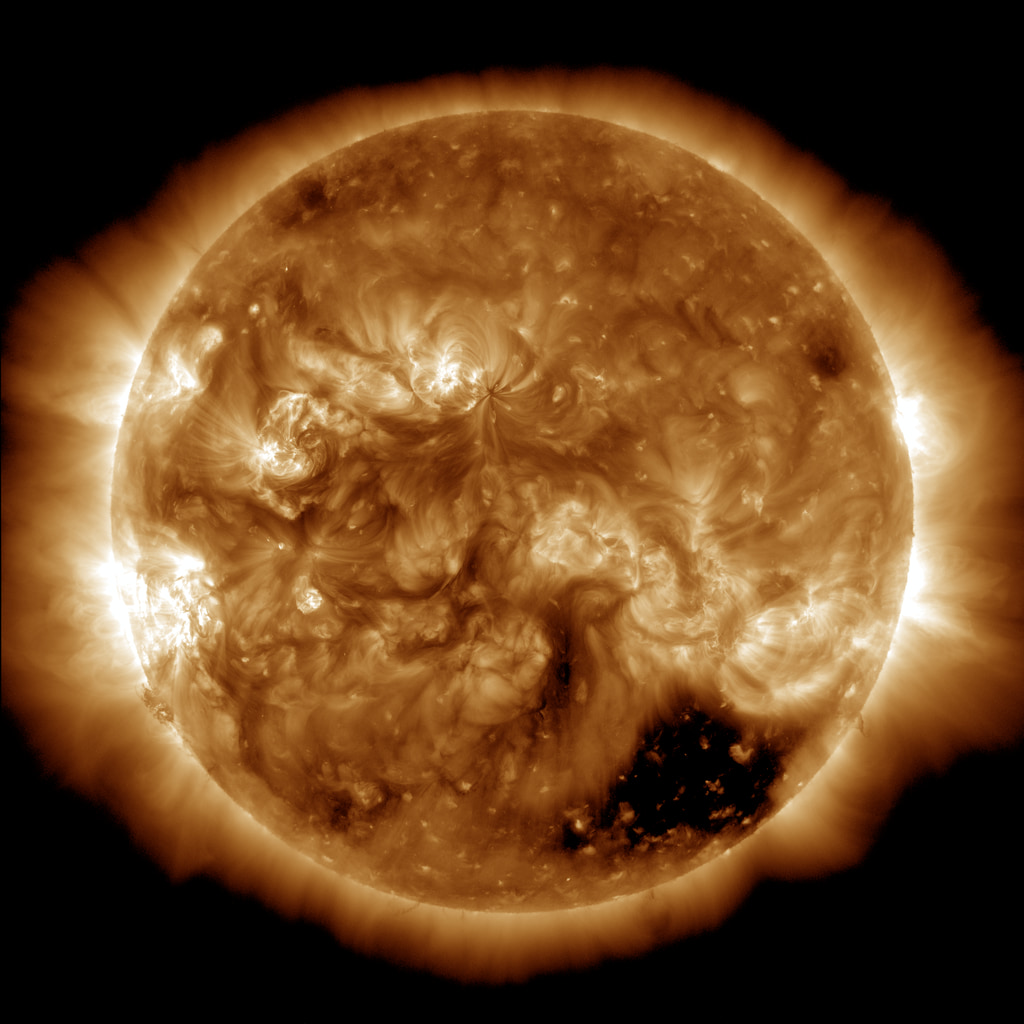
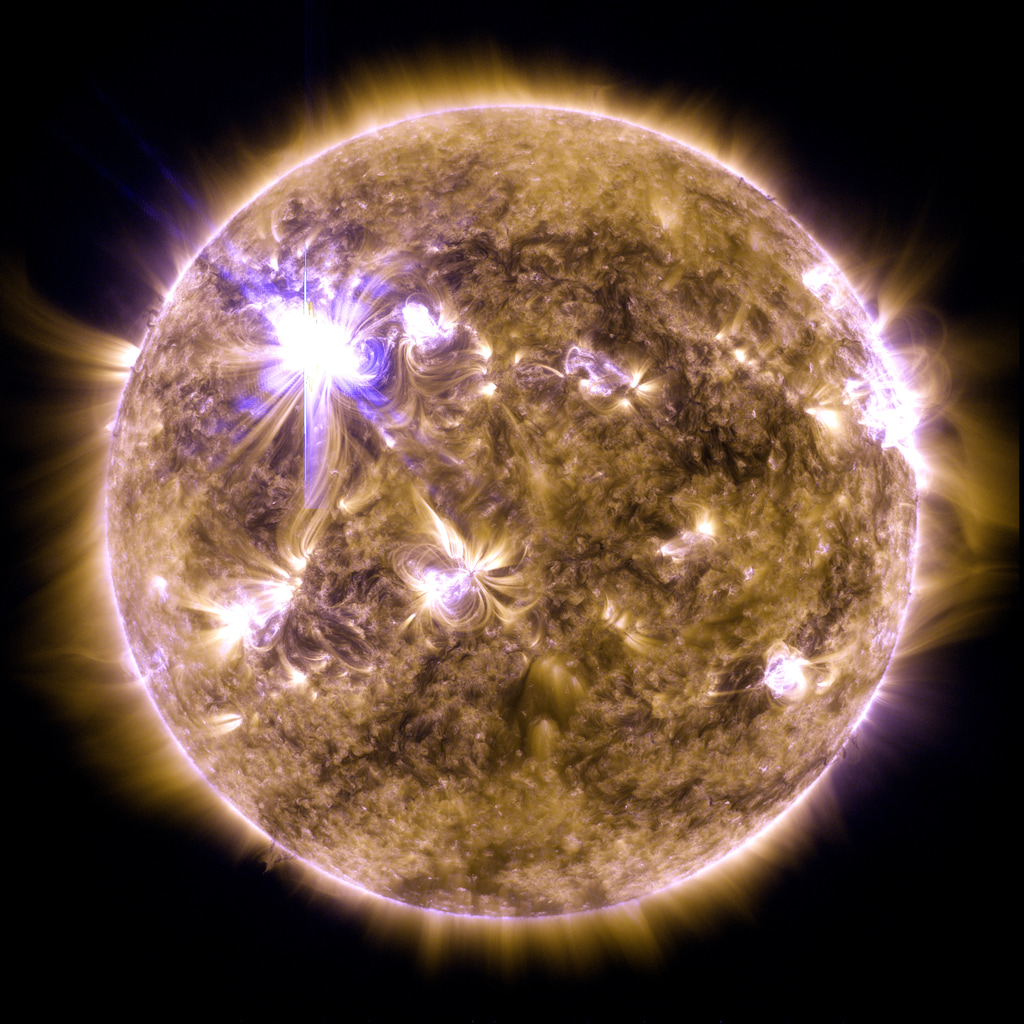
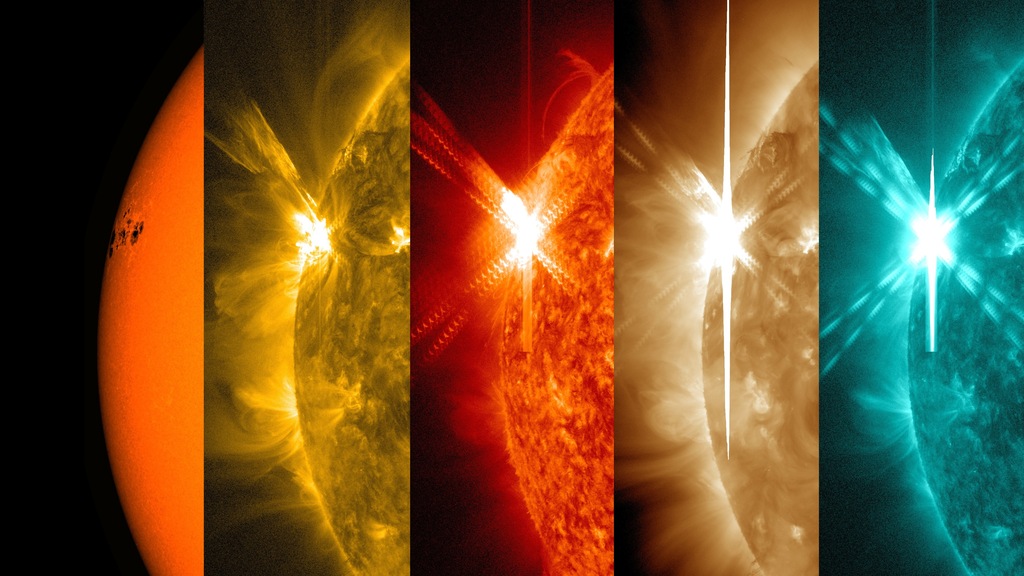
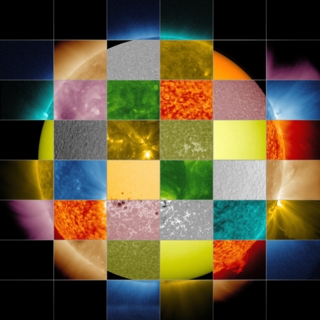
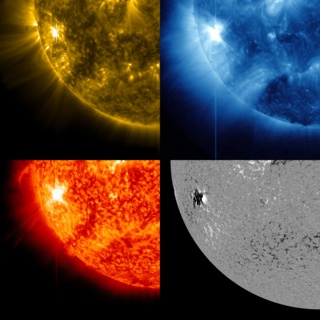
Various Sun Images for the Hyperwall
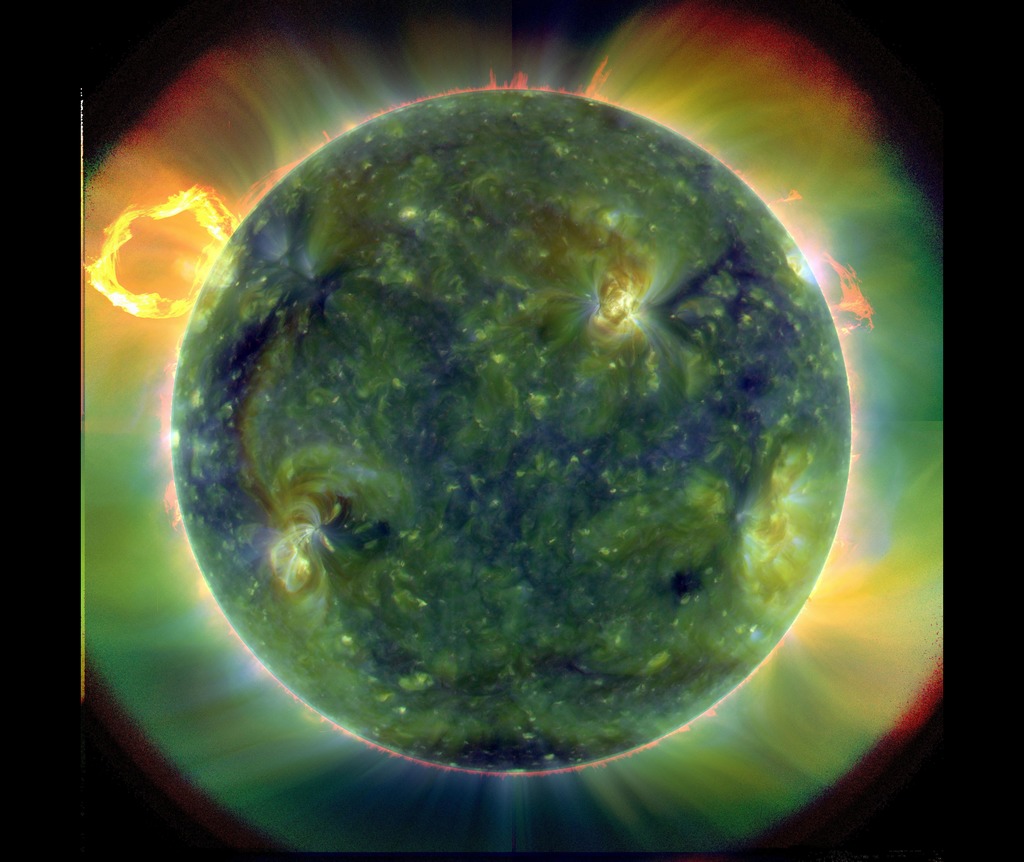
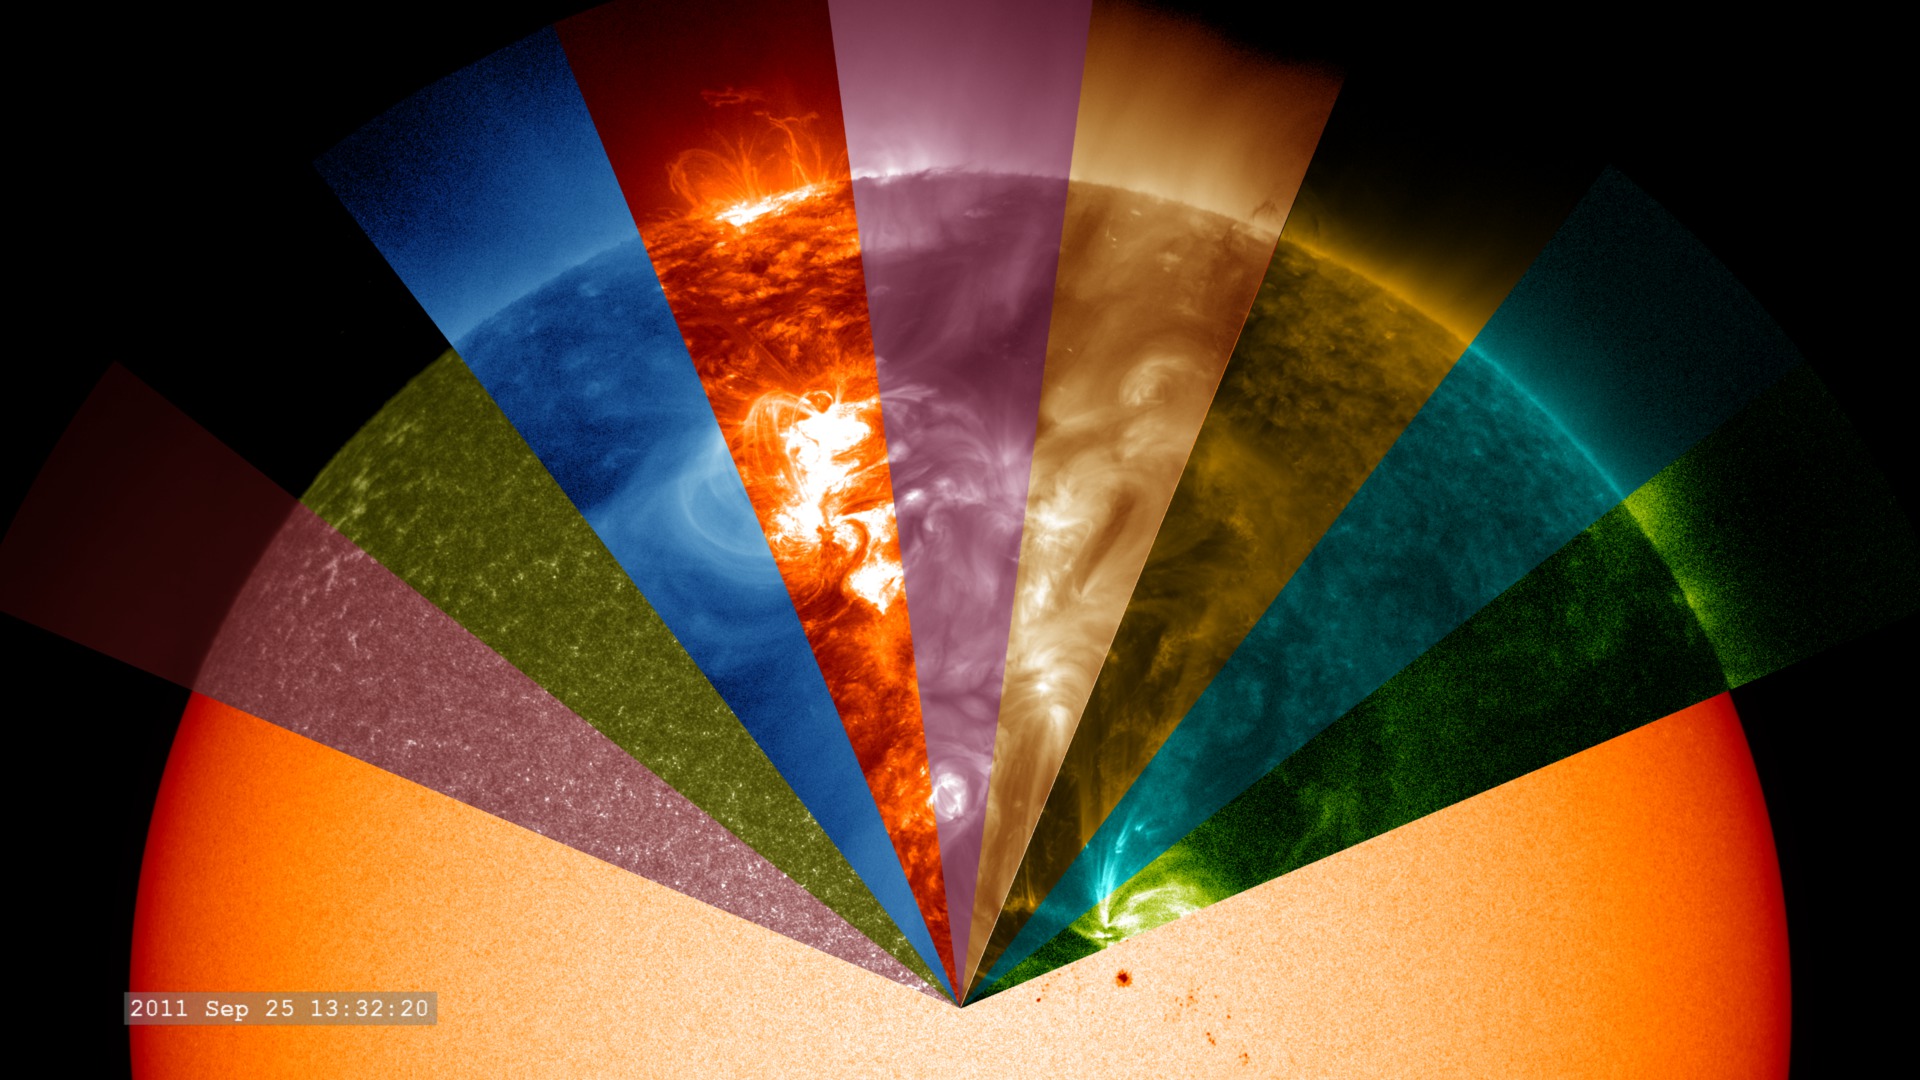
Go to this pageThe Solar Dynamics Observatory (SDO) provides ultra high-definition imagery of the Sun in 13 different wavelengths, utilizing two imaging instruments, the Atmospheric Imaging Assembly (AIA) instrument and the Helioseismic and Magnetic Imager (HMI). These images were captured by SDO on December 6, 2010. ||
2015
- ID: 11739 Produced Video
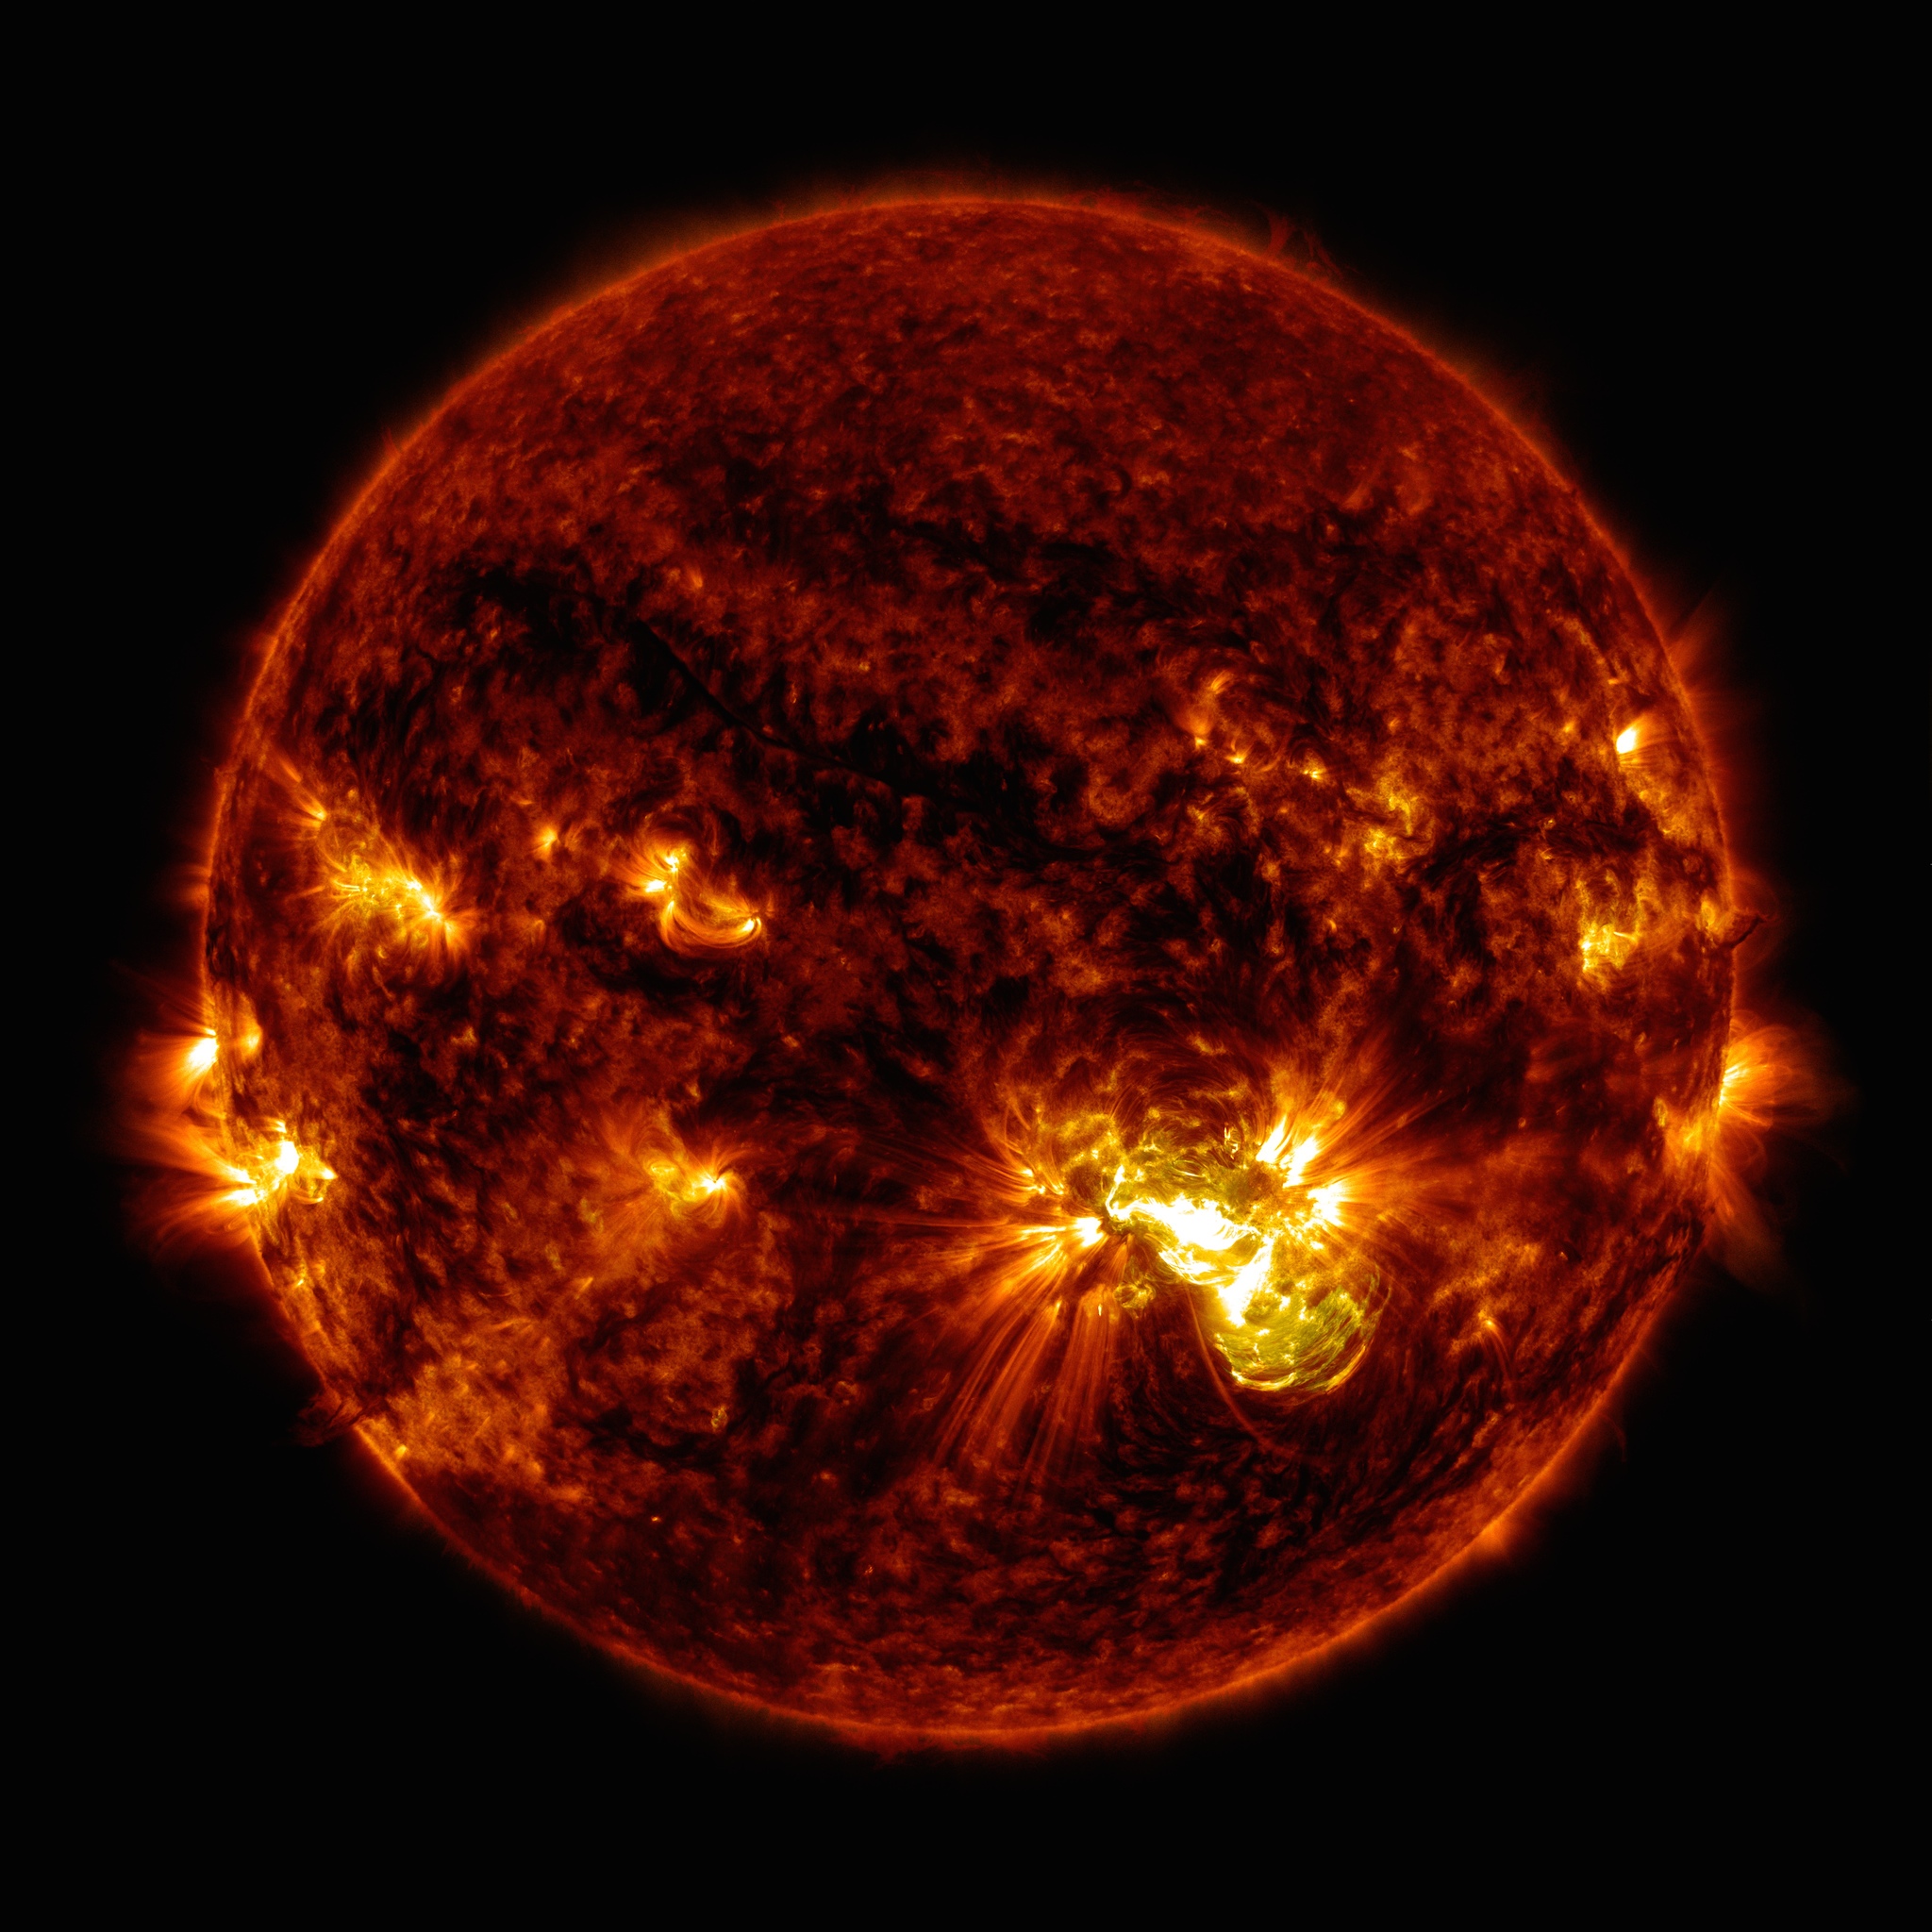
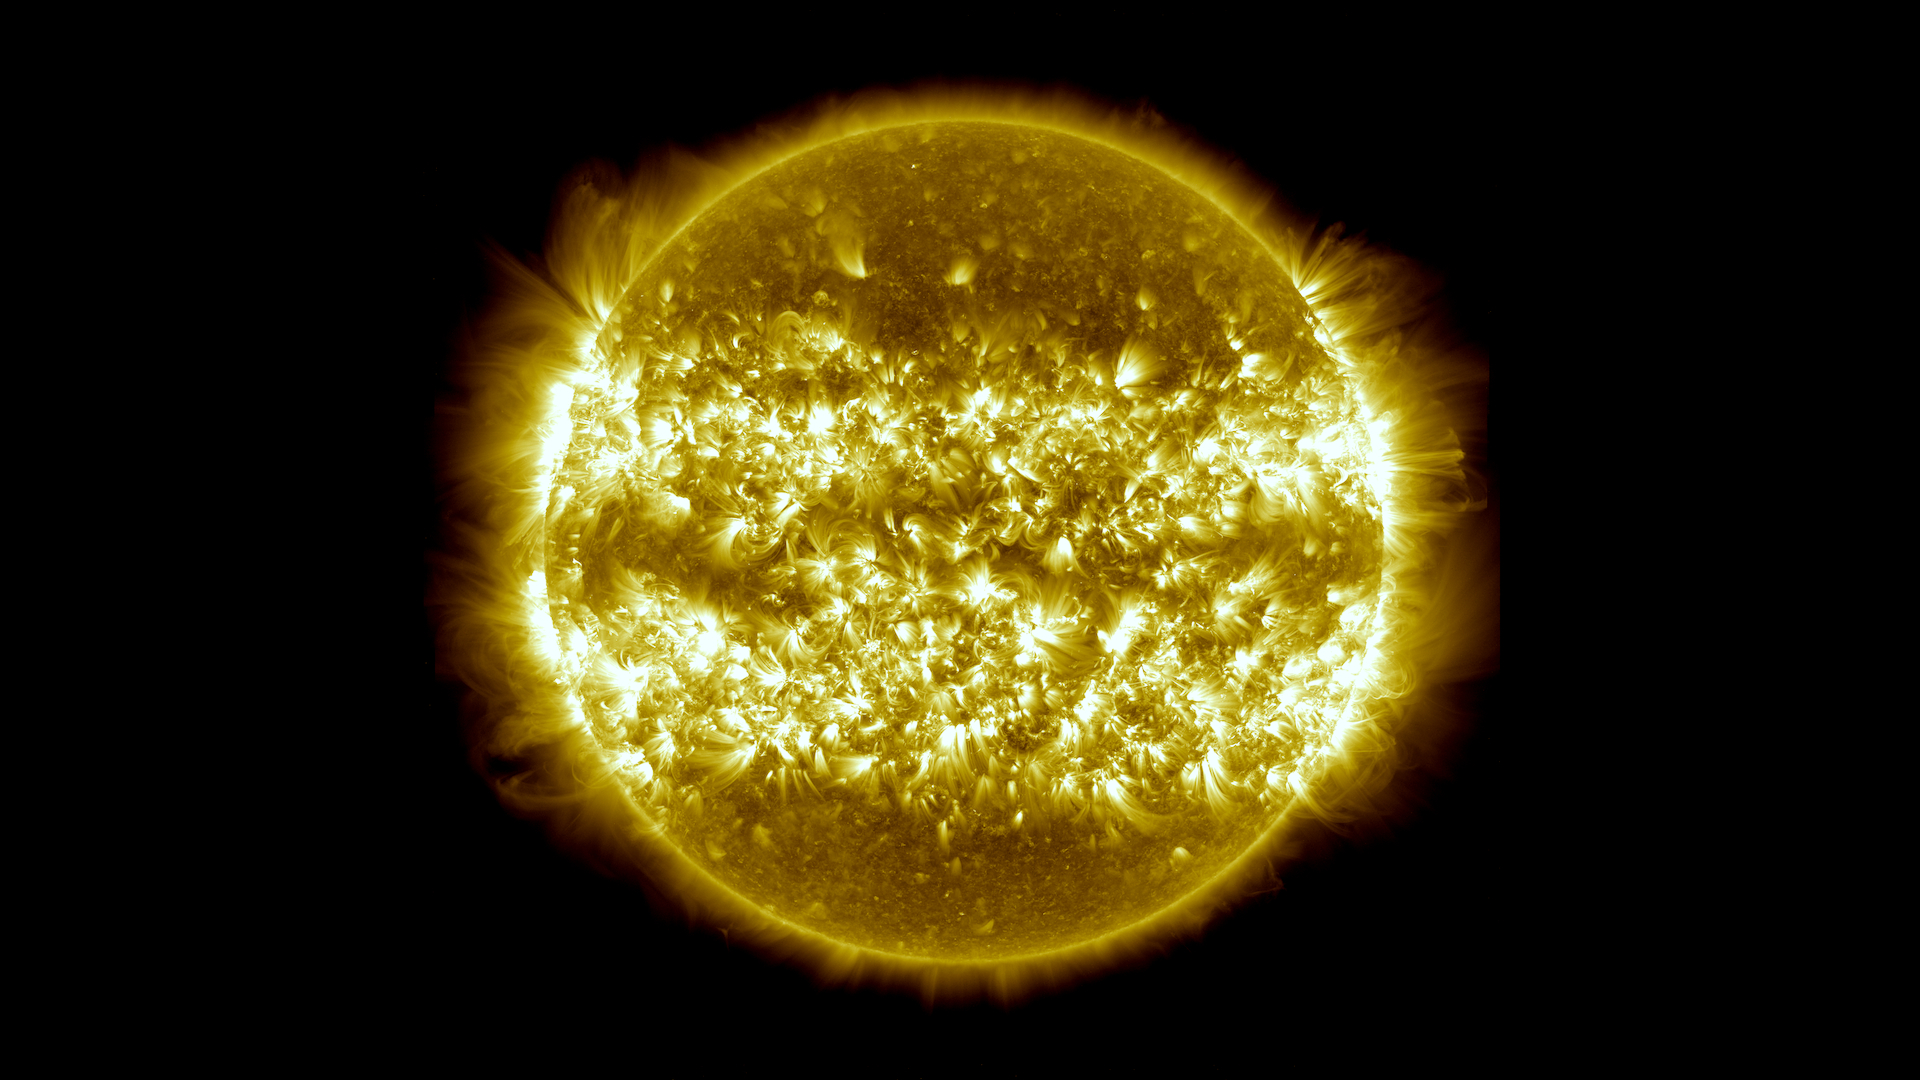
Telescope on NASA's SDO Collects Its 100 Millionth Image
Go to this page100 million images of the sun: The Advanced Imaging Assembly on NASA's Solar Dynamics Observatory captured its 100 millionth image of the sun on Jan. 19, 2015. The image shows the glow in the solar atmosphere of gases at about 1.5 million Kelvin. Credit: NASA/SDO/AIA/LMSAL || SDO_AIA_193_100Millionth_print.jpg (1024x1024) [168.6 KB] || SDO_AIA_193_100Millionth.jpeg (4096x4096) [2.4 MB] || SDO_AIA_193_100Millionth_web.jpg (320x320) [27.3 KB] || SDO_AIA_193_100Millionth_searchweb.png (320x180) [95.6 KB] || SDO_AIA_193_100Millionth_thm.png (80x40) [10.2 KB] ||
- ID: 11745 Produced Video
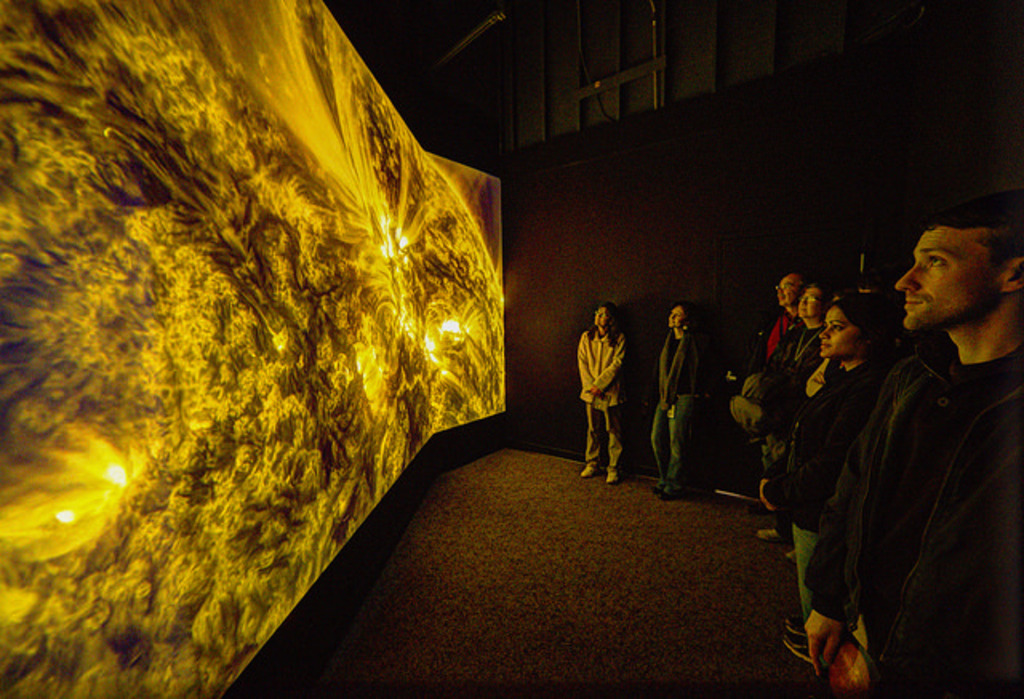
Solarium - Resource Page
Go to this pageA child looks up at Solarium at the Goddard Visitor Center in Greenbelt, Maryland.Photo Credit: NASA's Goddard Space Flight Center || E_LowAngle_304_crop_print.jpg (1024x677) [110.0 KB] || E_LowAngle_304_crop.png (3938x2604) [11.3 MB] || E_LowAngle_304_crop.jpg (3938x2604) [1.8 MB] || E_LowAngle_304_crop_web.png (320x211) [82.5 KB] ||
- ID: 11805 Produced Video
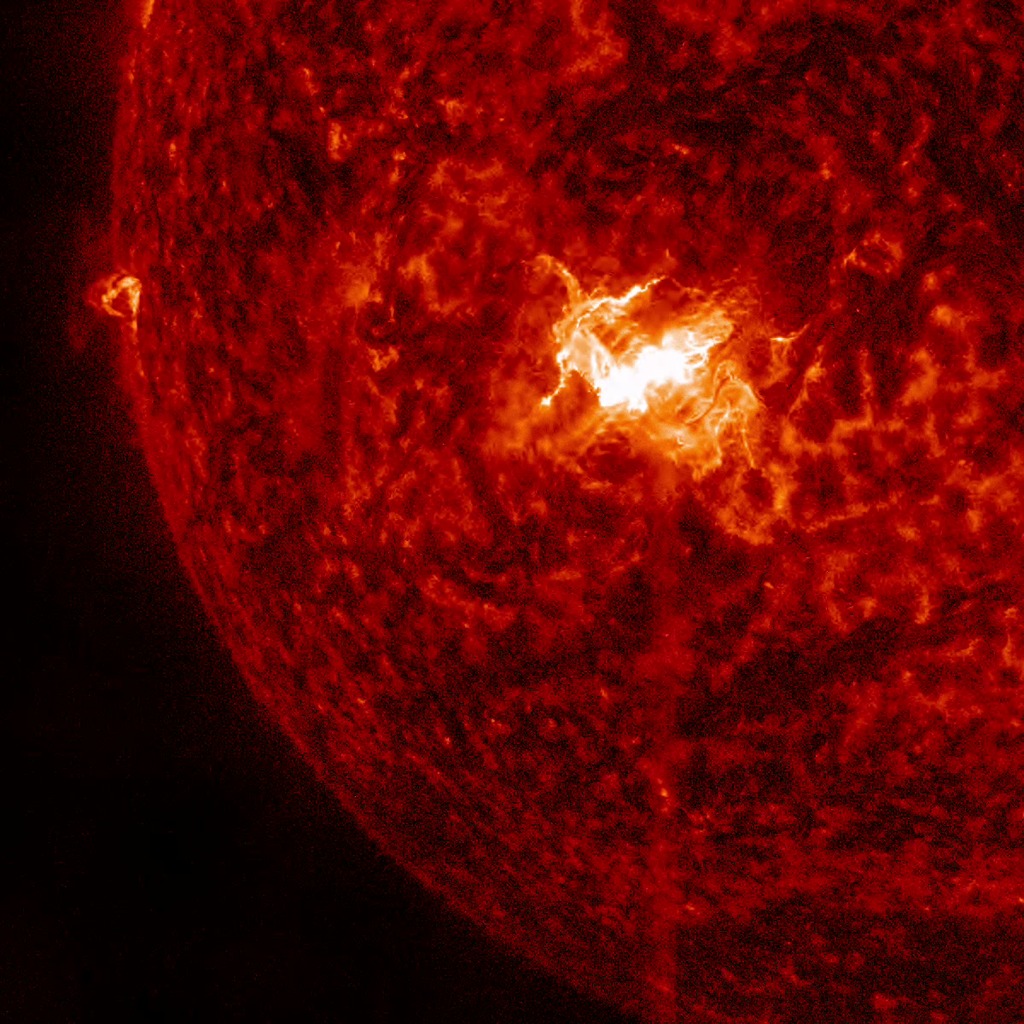
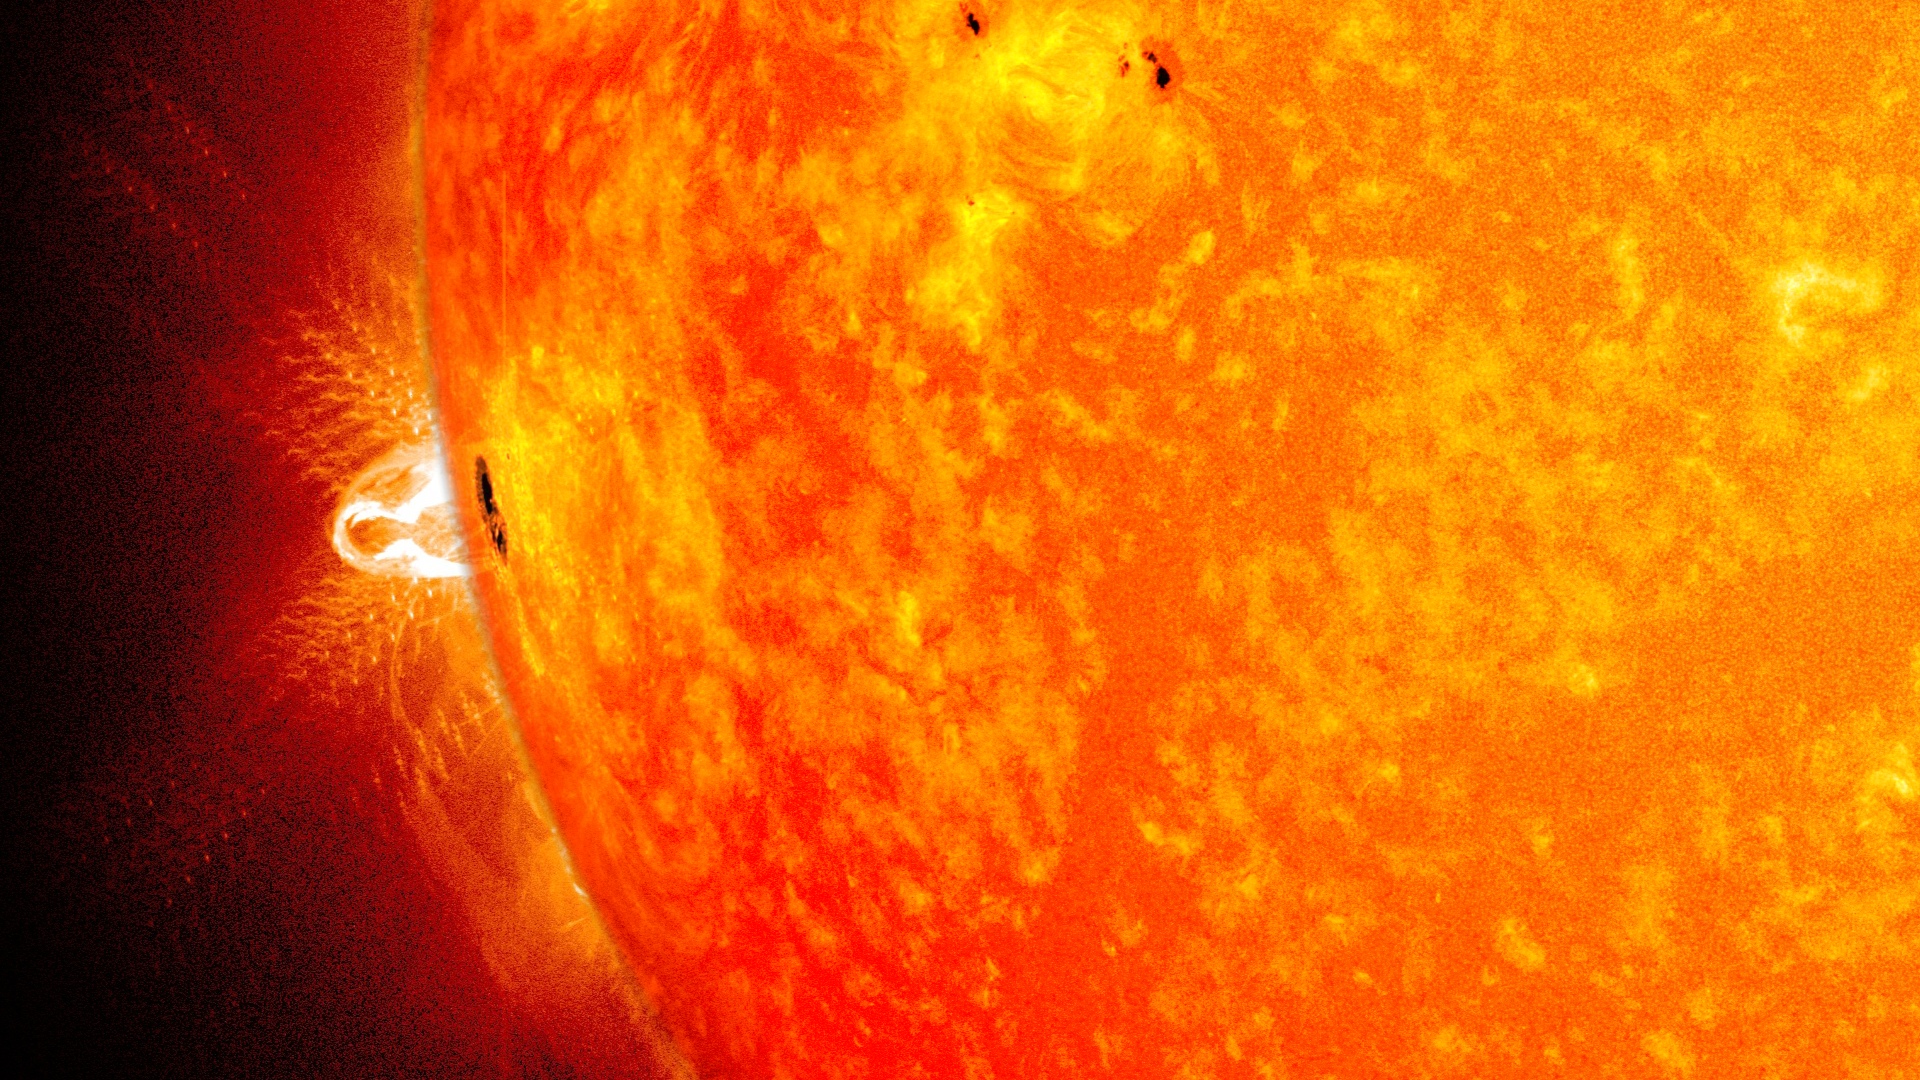
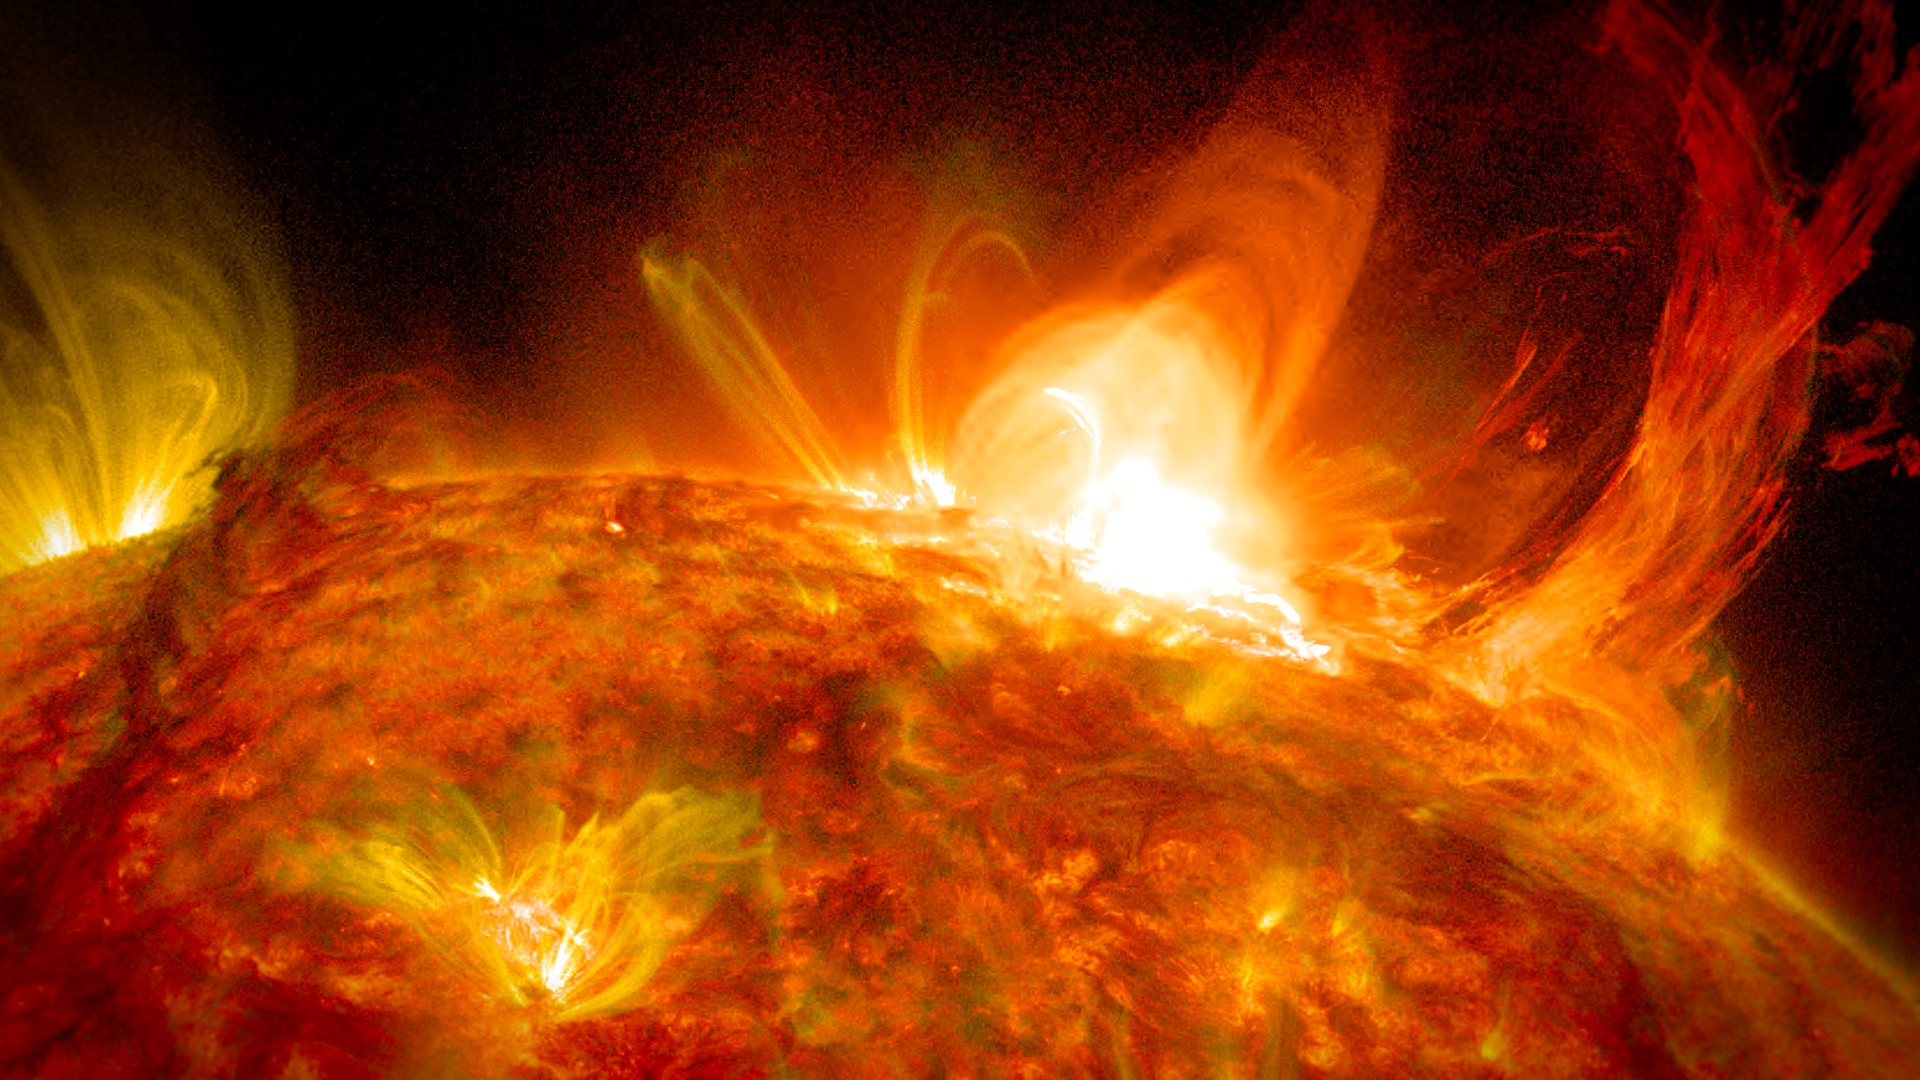
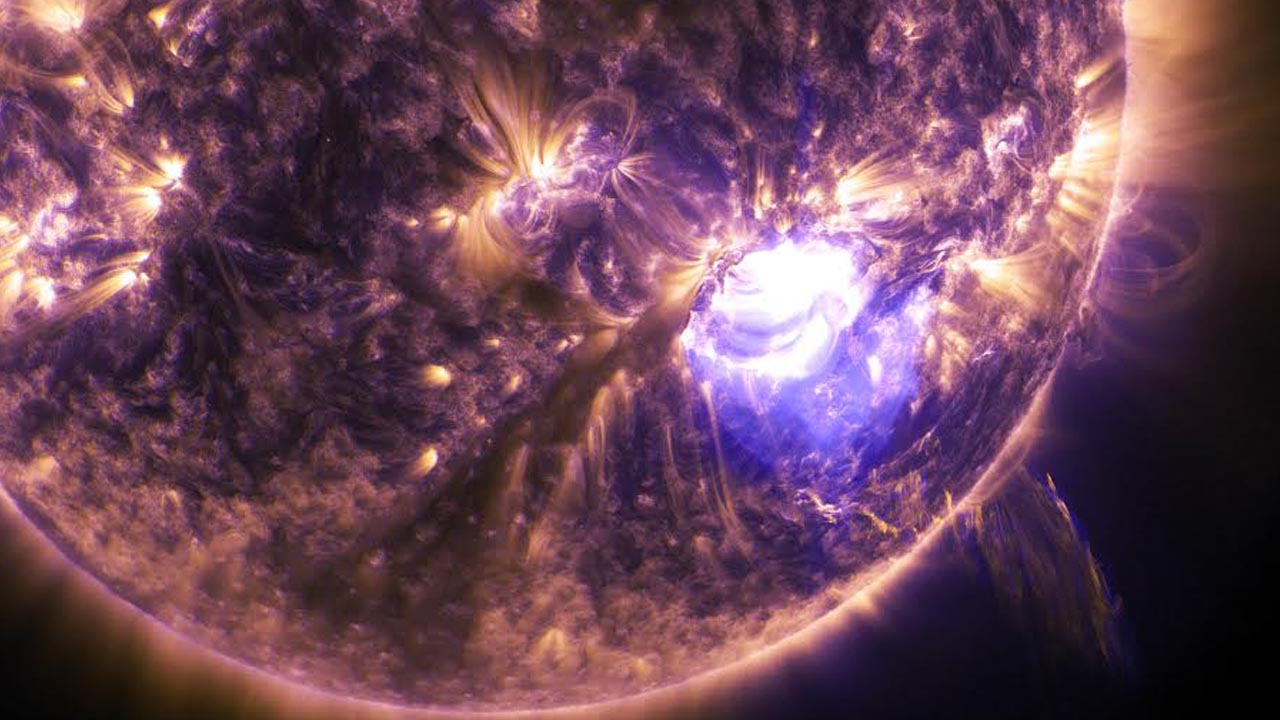
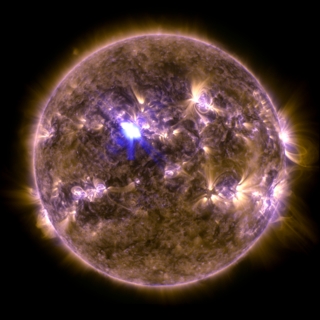
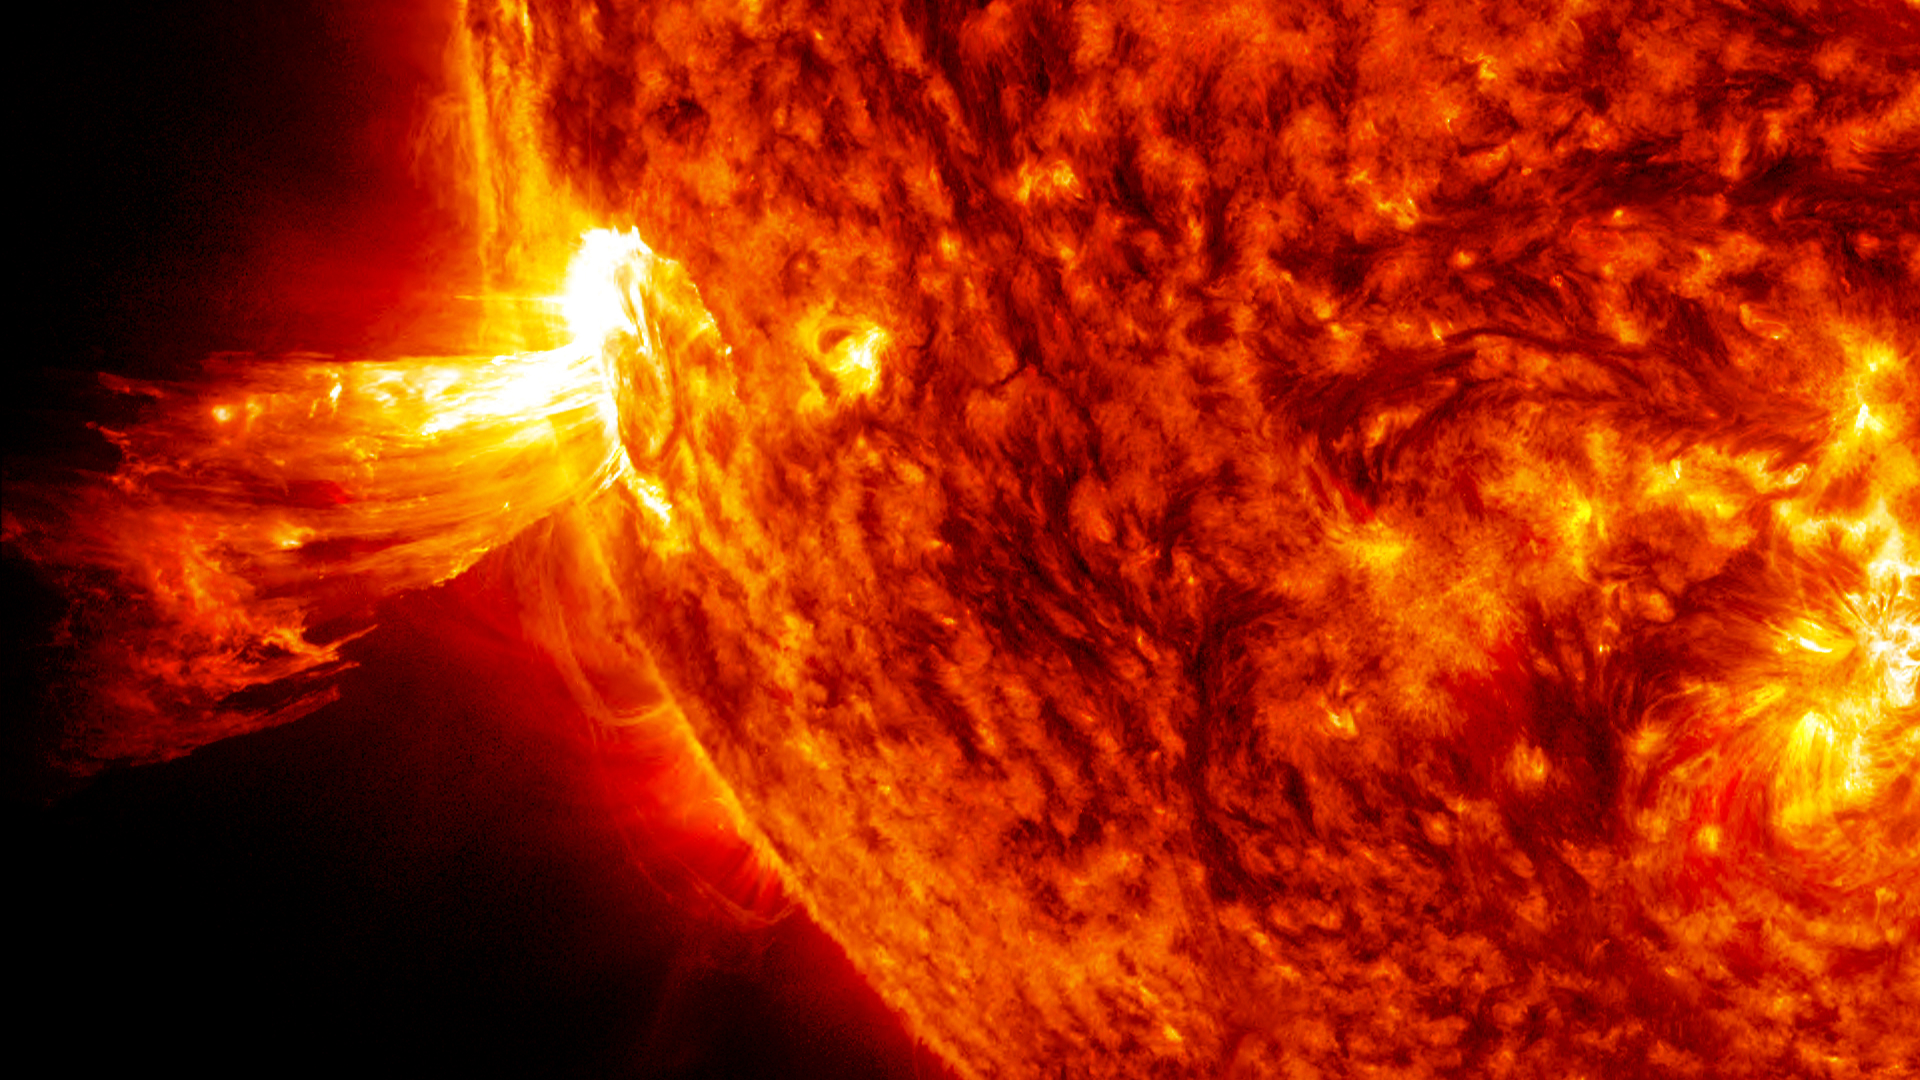
Sun Emits an X2.2 Flare on March 11, 2015
Go to this pageAn X2.2 class solar flare flashes in the middle of the sun on Mar. 11, 2015. This image was captured by NASA's Solar Dynamics Observatory and shows a blend of light from the 171 and 131 angstrom wavelengths.Credit: NASA/GSFC/SDO || March_11_2015_X2pt2_Flare_171-131-crop_2.png (1920x1200) [12.7 MB] || March_11_2015_X2pt2_Flare_171-131-crop_2.jpg (1920x1200) [682.3 KB] || March_11_2015_X2pt2_Flare_171-131-crop_2_print.jpg (1024x640) [168.4 KB] || March_11_2015_X2pt2_Flare_171-131-crop_2_web.jpg (320x200) [24.0 KB] || March_11_2015_X2pt2_Flare_171-131-crop_2_searchweb.png (320x180) [118.6 KB] || March_11_2015_X2pt2_Flare_171-131-crop_2_thm.png (80x40) [10.5 KB] ||
- ID: 11868 Produced Video
NASA's SDO Observes a Cinco de Mayo Solar Flare
Go to this pageVideo of May 5, 2015 X2.7 flare.Credit: NASA/GSFC/SDO || May_5_2015_Flare_Still_304-171.png (1920x1080) [8.1 MB] || May_5_2015_Flare_Still_304-171.jpg (1920x1080) [415.9 KB] || May_5_2015_Flare_Still_304-171_print.jpg (1024x576) [145.7 KB] || May_5_2015_Flare_Still_304-171_web.png (320x180) [83.3 KB] || 11868_May_5_X_Flare_MPEG4_1920X1080_2997.mp4 (1920x1080) [42.2 MB] || 11868_May_5_X_Flare_H264_Good_1920x1080_2997.webm (1920x1080) [4.8 MB] || 11868_May_5_X_Flare_1280x720.wmv (1280x720) [23.1 MB] || 11868_May_5_X_Flare_appletv.m4v (960x540) [19.0 MB] || 11868_May_5_X_Flare_appletv_subtitles.m4v (960x540) [19.0 MB] || 11868_May_5_X_Flare_ipod_lg.m4v (640x360) [7.1 MB] || 11868_May_5_X_Flare_ipod_sm.mp4 (320x240) [3.6 MB] || 11868_May_5_X_Flare_SRT_Captions.en_US.srt [230 bytes] || 11868_May_5_X_Flare_SRT_Captions.en_US.vtt [243 bytes] || 11868_May_5_X_Flare_ProRes_1920x1080_2997.mov (1920x1080) [674.9 MB] || 11868_May_5_X_Flare_H264_Best_1920x1080_2997.mov (1920x1080) [682.7 MB] || 11868_May_5_X_Flare_H264_Good_1920x1080_2997.mov (1920x1080) [219.1 MB] ||
- ID: 11905 Produced Video
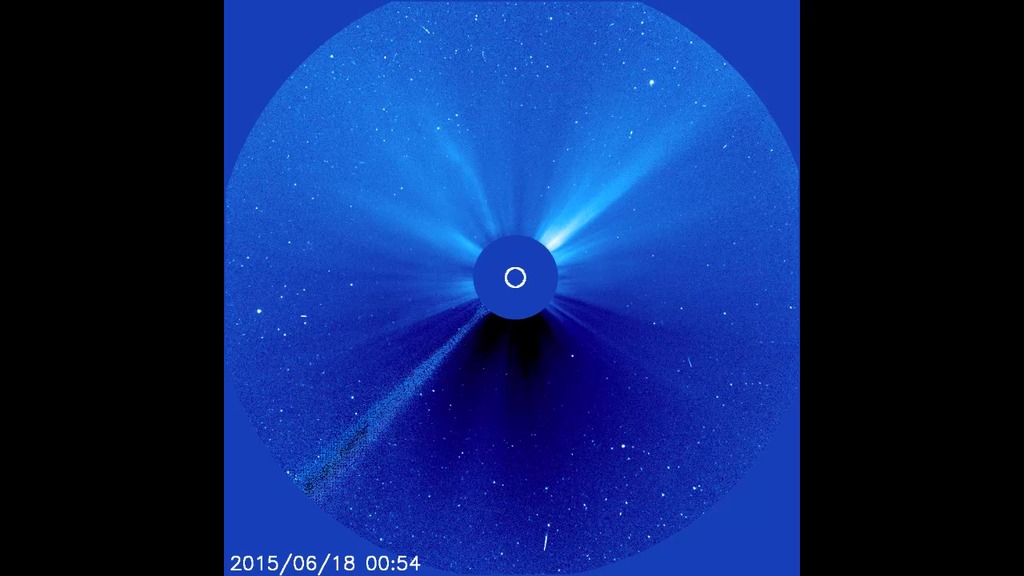
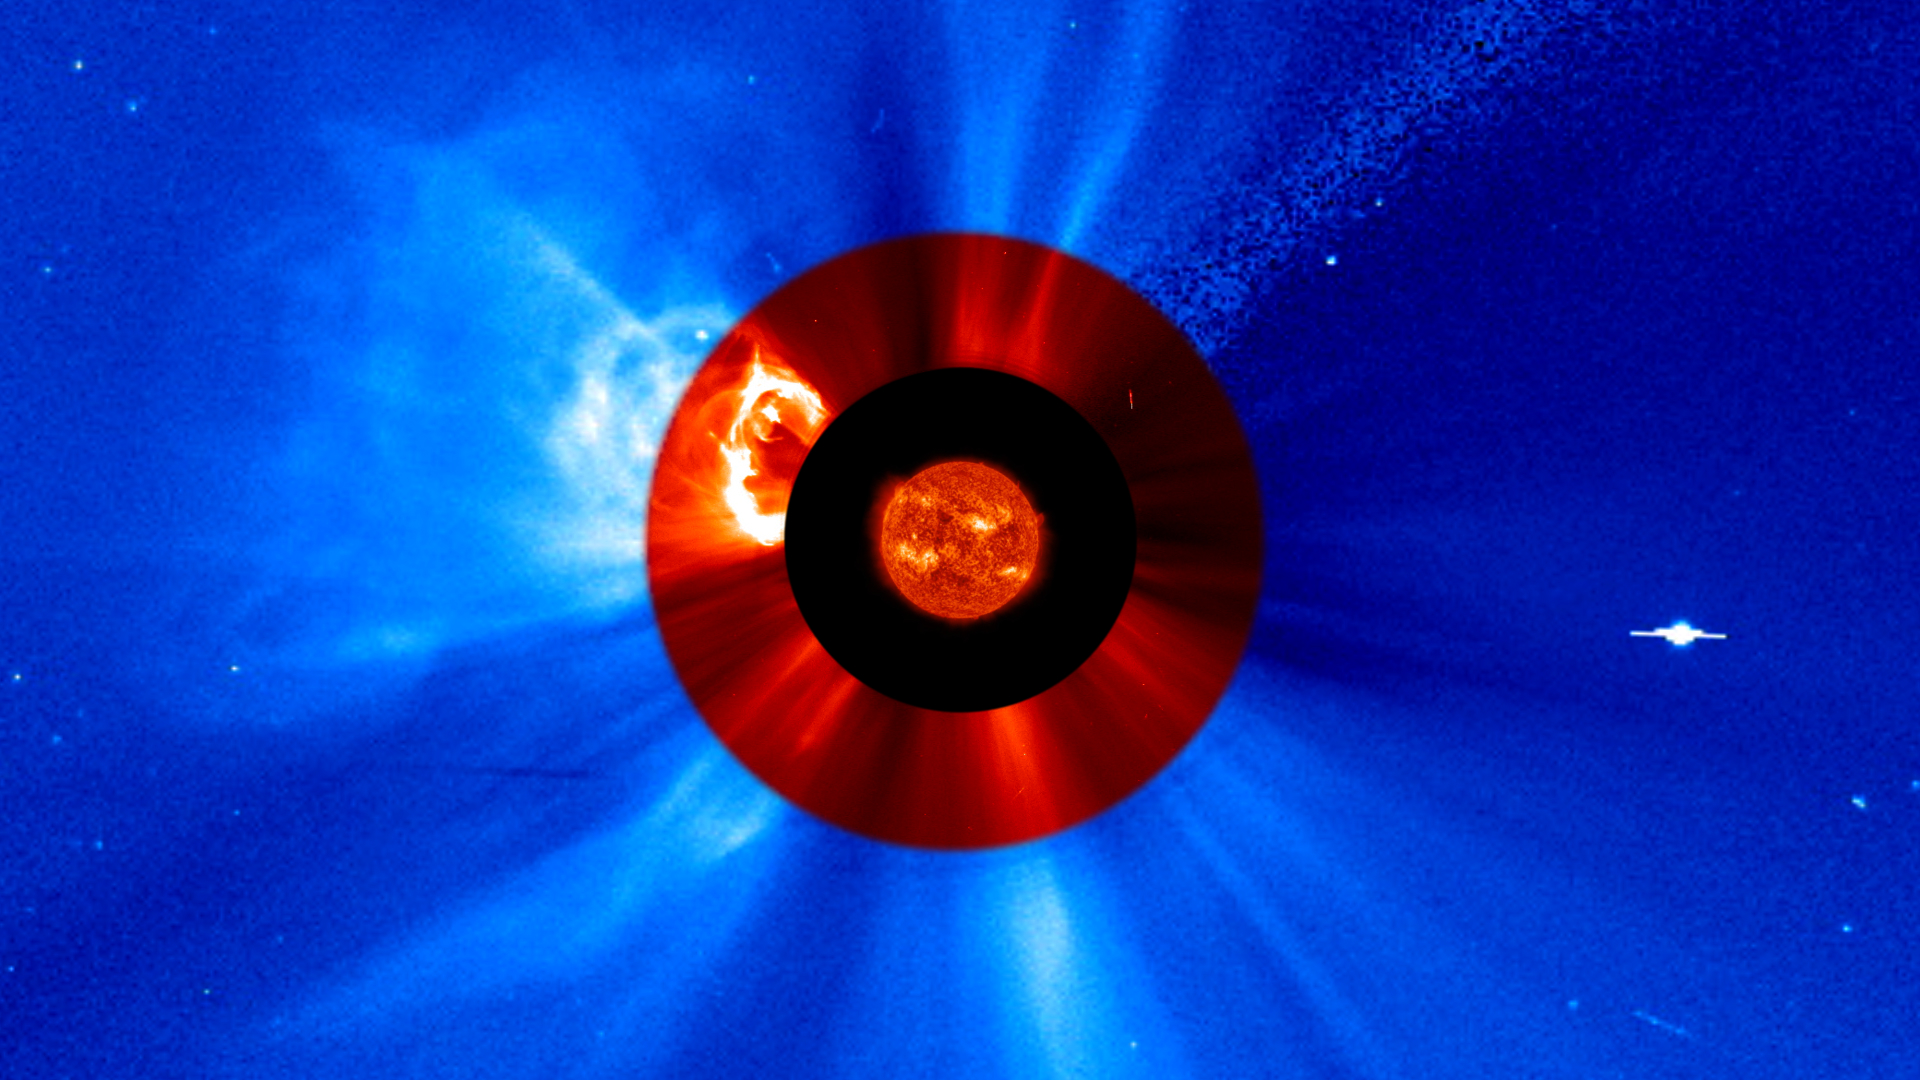
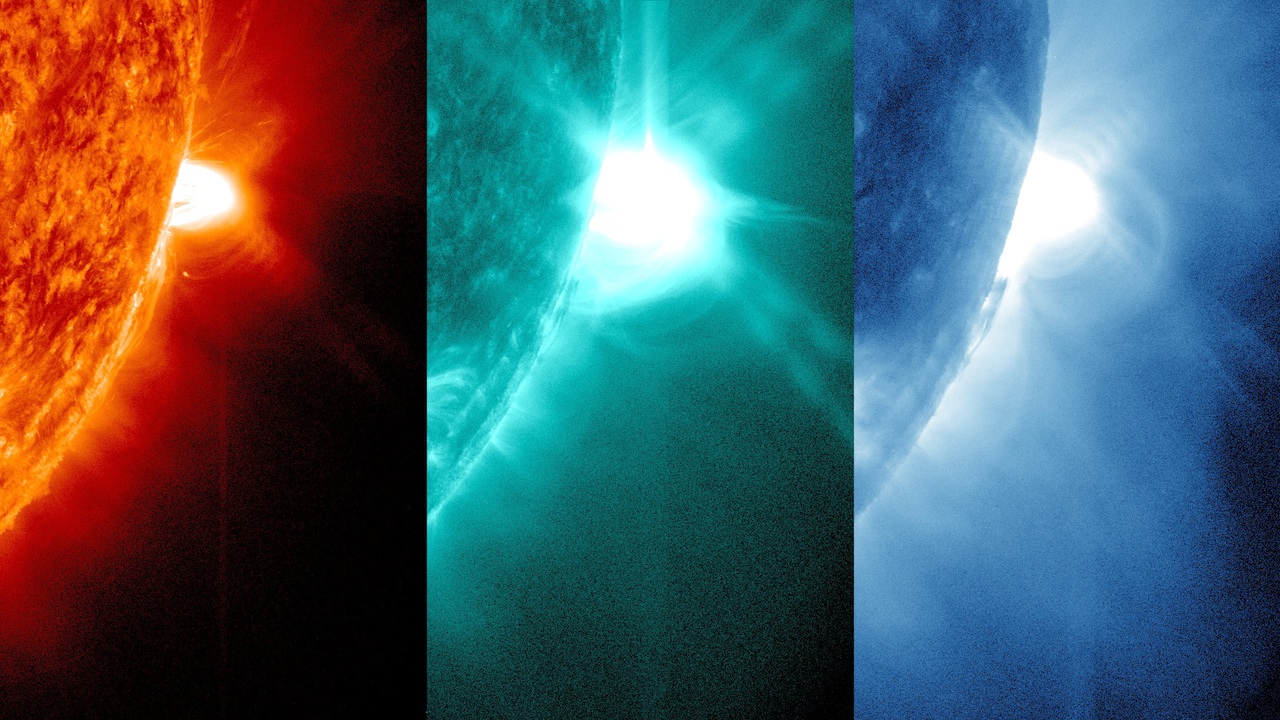
Space Weather Imagery of June 22 - 23, 2015 Events
Go to this pageThe sun emitted a CME and mid-level solar flare, peaking at 2:23 p.m. EDT, on June 22, 2015. Again on June 25, 2015, a mid-level solar flare peaked at 4:16 a.m. EDT.NASA’s Solar Dynamics Observatory, which watches the sun constantly, captured an image of the event. Solar flares are powerful bursts of radiation. Harmful radiation from a flare cannot pass through Earth's atmosphere to physically affect humans on the ground, however -- when intense enough -- they can disturb the atmosphere in the layer where GPS and communications signals travel. To see how this event may affect Earth, please visit NOAA's Space Weather Prediction Center at http://spaceweather.gov, the U.S. government's official source for space weather forecasts, alerts, watches and warnings. This first flare is classified as an M6.6 flare and the second was M7.9. M-class flares are a tenth the size of the most intense flares, the X-class flares. The number provides more information about its strength. An M2 is twice as intense as an M1, an M3 is three times as intense, etc. ||
- ID: 11993 Produced Video
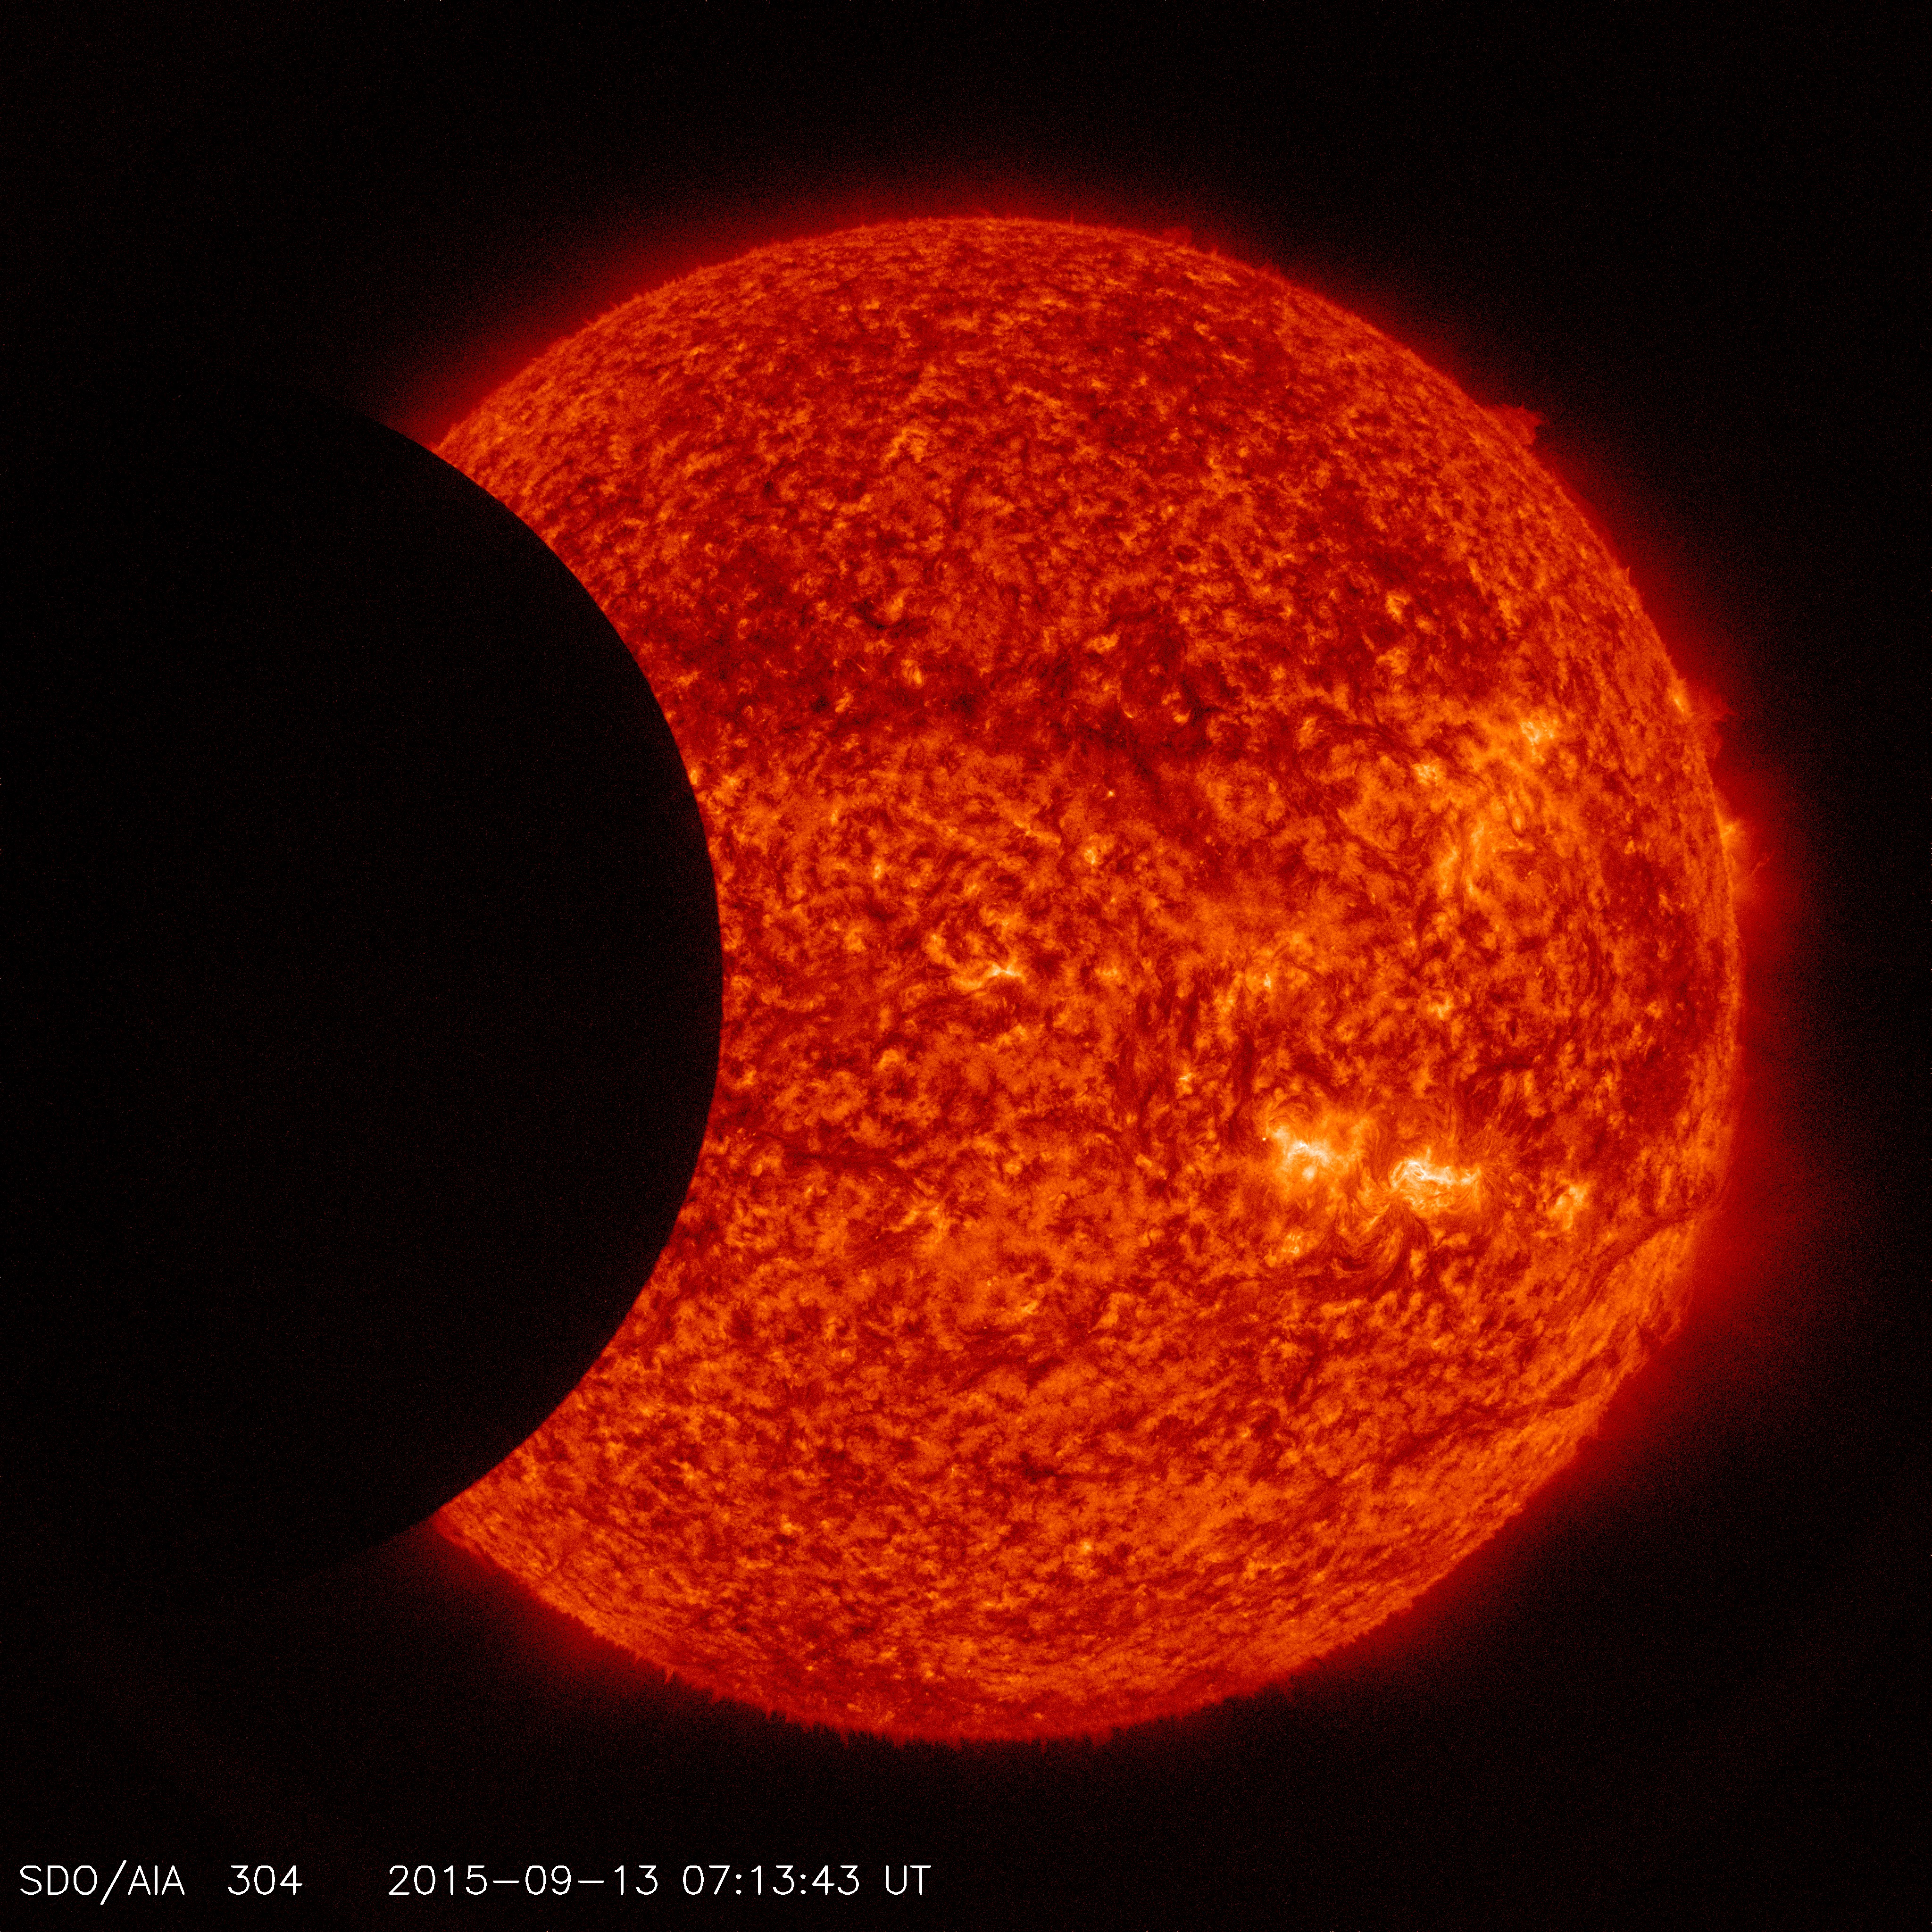
SDO Transit - September 2015
Go to this pageThe Earth and moon photobomb SDO.Watch this video on the NASAexplorer YouTube channel. || sdophotobombthumb.jpg (1280x720) [78.0 KB] || G2015-072_SDOtransit9.13.15.mov (1920x1080) [1.3 GB] || G2015-072_SDOtransit9.13.15.webm (1920x1080) [5.7 MB] || G2015-072_SDOtransit9.13.15-H264_Best_1920x1080_59.94.mov (1920x1080) [253.2 MB] || G2015-072_SDOtransit9.13.15-H264_Good_1080_29.97.mov (1920x1080) [48.7 MB] || G2015-072_SDOtransit9.13.15_youtube_hq.mov (1920x1080) [131.1 MB] || G2015-072_SDOtransit9.13.15_appletv.m4v (1280x720) [30.9 MB] || G2015-072_SDOtransit9.13.15_appletv_subtitles.m4v (1280x720) [30.9 MB] || G2015-072_SDOtransit9.en_US.srt [514 bytes] || G2015-072_SDOtransit9.en_US.vtt [527 bytes] || G2015-072_SDOtransit9.13.15_ipod_sm.mp4 (320x240) [12.1 MB] ||
2014
- ID: 11711
 Produced Video
 - ID: 11136
 Produced Video
 - ID: 11463
 Produced Video
 - ID: 11483
 Produced Video
 - ID: 11493
 Produced Video
 - ID: 11497
 Produced Video
 - ID: 11528
 Produced Video
 - ID: 11522
 Produced Video
 - ID: 11564
 Produced Video
 - ID: 11629
 Produced Video
 - ID: 11651
 Produced Video
 - ID: 11670
 Produced Video
 - ID: 11717
 Produced Video
 - ID: 11718
 Produced Video
 - ID: 10158
 Produced Video
 - ID: 11721
 Produced Video
2013
- ID: 11167
 Produced Video
 - ID: 11071
 Produced Video
 - ID: 11180
 Produced Video
 - ID: 11211
 Produced Video
 - ID: 11246
 Produced Video
 - ID: 11255
 Produced Video
 - ID: 11262
 Produced Video
 - ID: 10785
- ID: 11285
 Produced Video
 - ID: 11291
 Produced Video
 - ID: 11298
 Produced Video
 - ID: 11199
 Produced Video
 - ID: 11379
 Produced Video
 - ID: 11383
 Produced Video
 - ID: 11386
 Produced Video
 - ID: 11387
 Produced Video
 - ID: 11422
- ID: 4117
 Visualization
 - ID: 4128
 Visualization
2012
- ID: 10925
 Produced Video
 - ID: 13673Produced Video
- ID: 10962
 Produced Video
 - ID: 10990
 Produced Video
 - ID: 10996
 Produced Video
 - ID: 11032
 Produced Video
 - ID: 11043
 Produced Video
 - ID: 11044
 Produced Video
 - ID: 11047
 Produced Video
 - ID: 11046
 Produced Video
 - ID: 11095
 Produced Video
 - ID: 11111
 Produced Video
 - ID: 11112
 Produced Video
 - ID: 11120
 Produced Video
 - ID: 11072
 Produced Video
2011
- ID: 11500 Produced Video
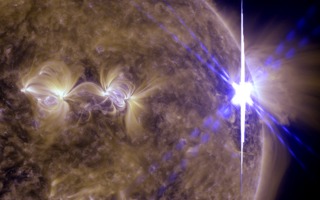
Sun Unleashes X6.9 Class Flare on August 9, 2011
Go to this pageOn August 9, 2011 at 3:48 a.m. EDT, the sun emitted an Earth-directed X6.9 flare, as measured by the NOAA GOES satellite. These gigantic bursts of radiation cannot pass through Earth's atmosphere to harm humans on the ground, however they can disrupt the atmosphere and disrupt GPS and communications signals. In this case, it appears the flare is strong enough to potentially cause some radio communication blackouts. It also produced increased solar energetic proton radiation — enough to affect humans in space if they do not protect themselves. As of March 2014, this flare is the largest of solar cycle 24. ||
- ID: 10817 Produced Video
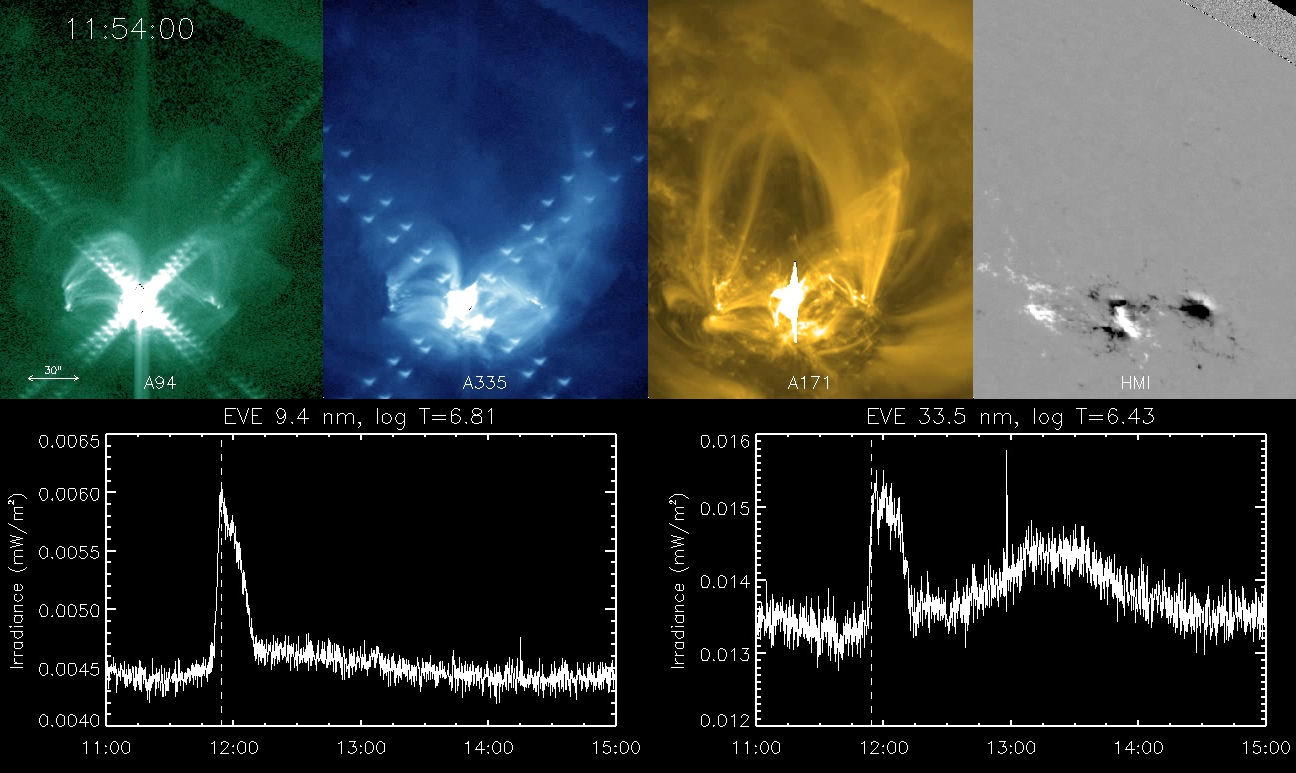
SDO EVE Late Phase Flares
Go to this pageScientists have been seeing just the tip of the iceberg when monitoring flares with X-rays. With the complete extreme ultraviolet (EUV) coverage by the SDO EUV Variability Experiment (EVE), they have observed enhanced EUV radiation that appears not only during the X-ray flare, but also a second time delayed by many minutes after the X-ray flare peak. These delayed, second peaks are referred to as the EUV Late Phase contribution to flares.The solar EUV radiation creates our Earth's ionosphere (plasma in our atmosphere), so solar flares disturb our ionosphere and consequently our communication and navigation technologies, such as Global Positioning System (GPS), that transmit through the ionosphere. For over 30 years, scientists have relied on the GOES X-ray monitor to tell them when to expect disturbances to our ionosphere. With these new SDO EVE results, they now recognize that additional ionospheric disturbances from these later EUV enhancements are also a concern. ||
2010
- ID: 10733 Produced Video
SDO First Light Media
Go to this pageA compilation of some of the videos and stills used during the SDO First Light press conference.There are more video and stills available. ||
- ID: 10610 Produced Video
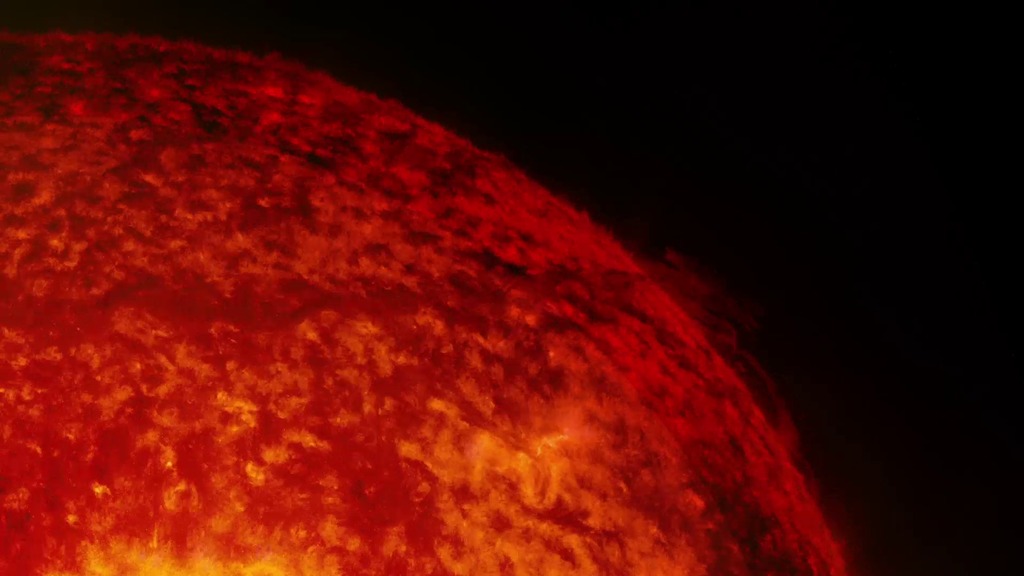
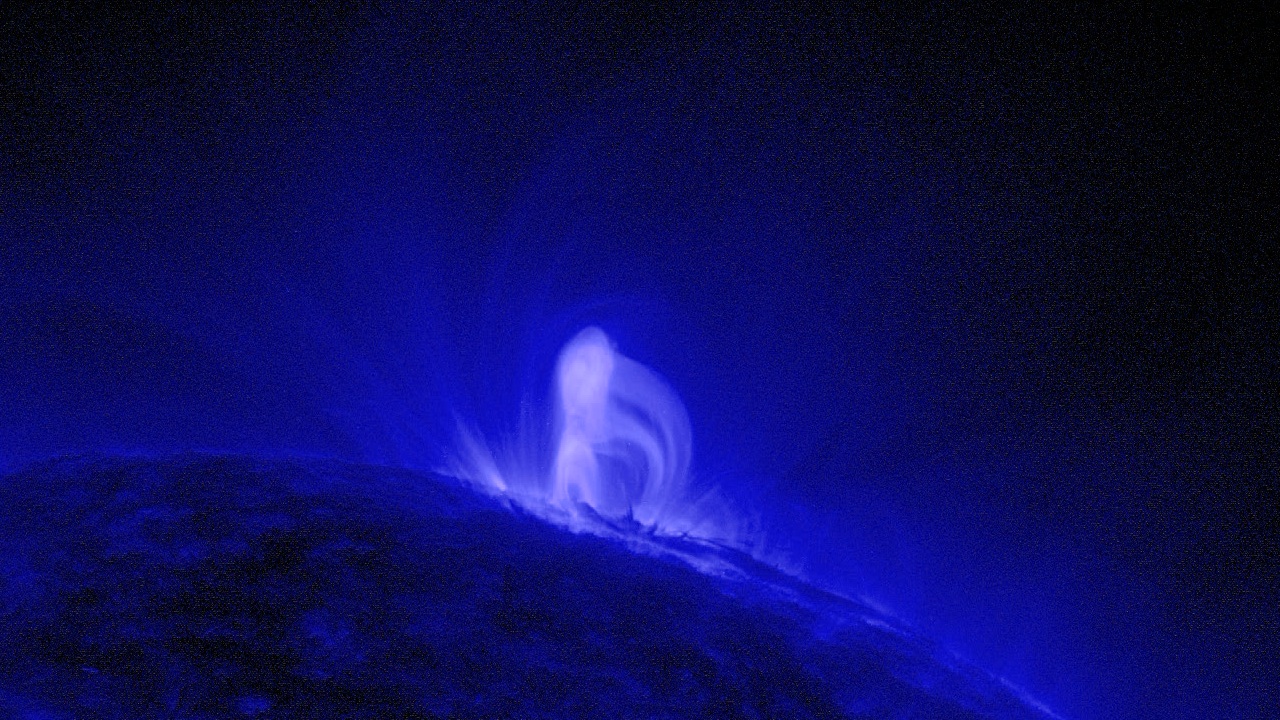
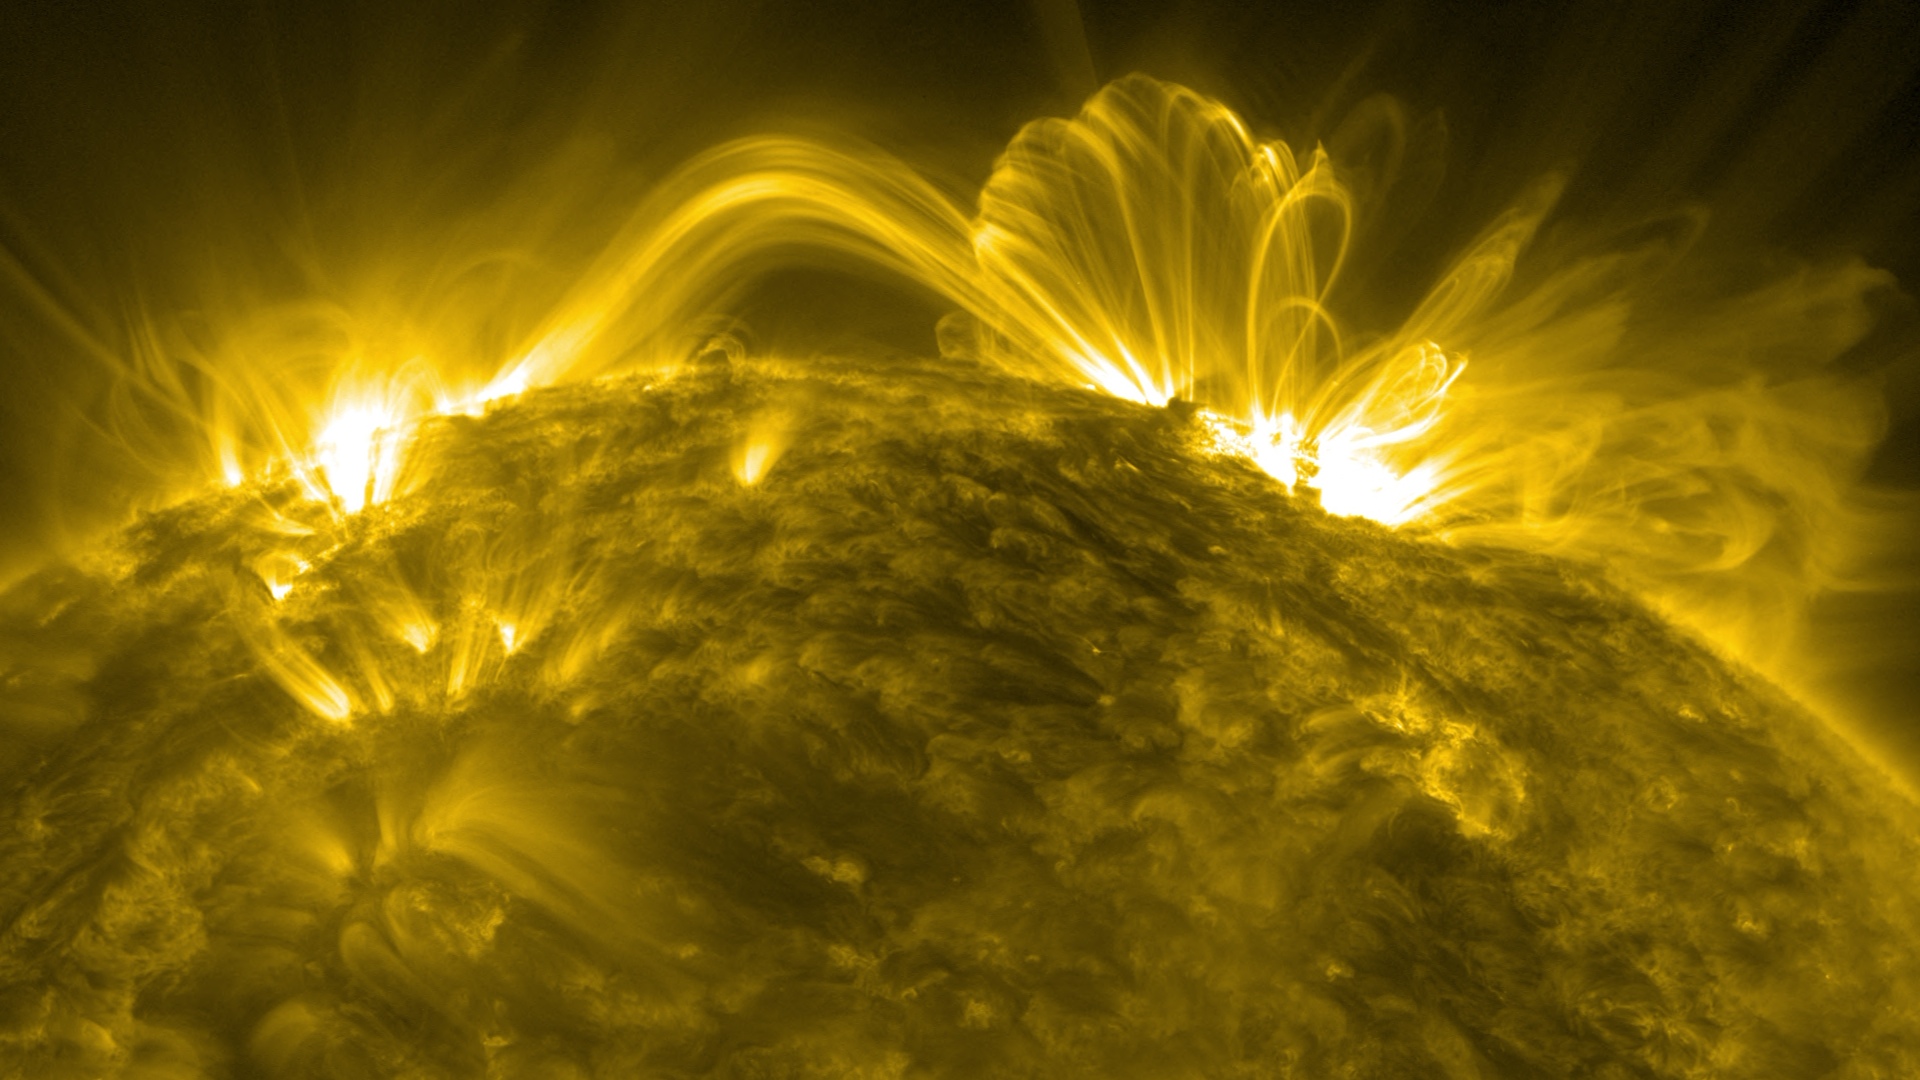
SDO First Light High Resolution Stills
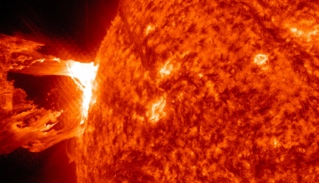
Go to this pageStills from the AIA instrument on SDO. They show the March 30, 2010 "First Light" prominence eruption captured just after the AIA sensors were activated. All images are from the ultraviolet part of the spectrum, specifically the wavelengths of 304, 211, 193, and 171 Ångstroms. The stills are in multiple resolutions and are available as tiff and jpeg files. ||
- ID: 4075 Visualization
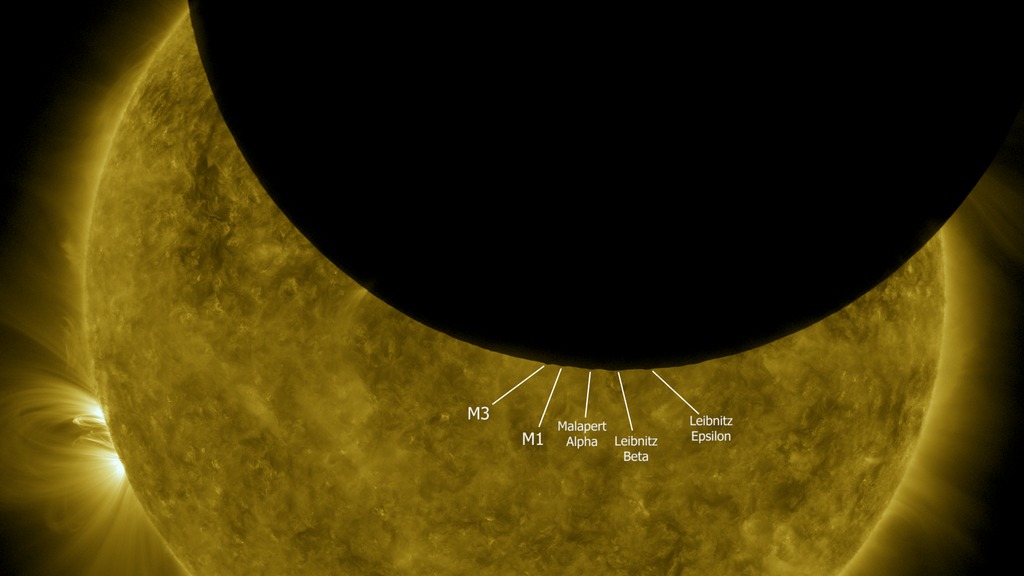
Lunar Transit from Solar Dynamics Observatory (2010)
Go to this pageJust as we do on Earth, the Solar Dynamics Observatory satellite periodically crosses the Moon's shadow and experiences a solar eclipse. During the eclipse witnessed by SDO on October 7, 2010, the southern hemisphere of the Moon was silhouetted against the solar disk, revealing some especially prominent mountain peaks near the Moon's south pole. By using elevation data from Lunar Reconnaissance Orbiter to visualize the Moon from SDO's point of view, it's possible to identify these peaks. Although all of these are well-known features, all but one of them have no official names. The following list corresponds to the labels in the animation, from left to right.In his 1954 sketch of the lunar south pole, astronomer Ewen Whitaker labeled this feature "M3." It's a mountain about halfway between the craters Cabeus and Drygalski, at 83.2°S 68°W.Whitaker's "M1," a mountain on the northern rim of Cabeus, 83.4°S 33°W.A mountain on the southern rim of Malapert crater, about halfway between the centers of Malapert and Haworth. Whitaker labels this Malapert Alpha. It's also known as Mons Malapert or Malapert Peak. 85.8°S 0°E.Labeled Leibnitz Beta by Whitaker and now officially named Mons Mouton, this is part of the highlands adjacent to the northern rim of Nobile crater. 84°S 37°E. Part of the Leibnitz mountain range first identified by Johann Schröter in the late 1700s, unrelated to Leibnitz Crater on the lunar far side.A mountain near Amundsen crater, on the western (Earthward) rim of Hédervári crater, 82.2°S 75°E. Whitaker tentatively labels this Leibnitz Epsilon in his sketch.The Moon visualization uses the latest albedo and elevation maps from Lunar Reconnaissance Orbiter (LRO). ||