SDO Observes Fast-Growing Sunspot
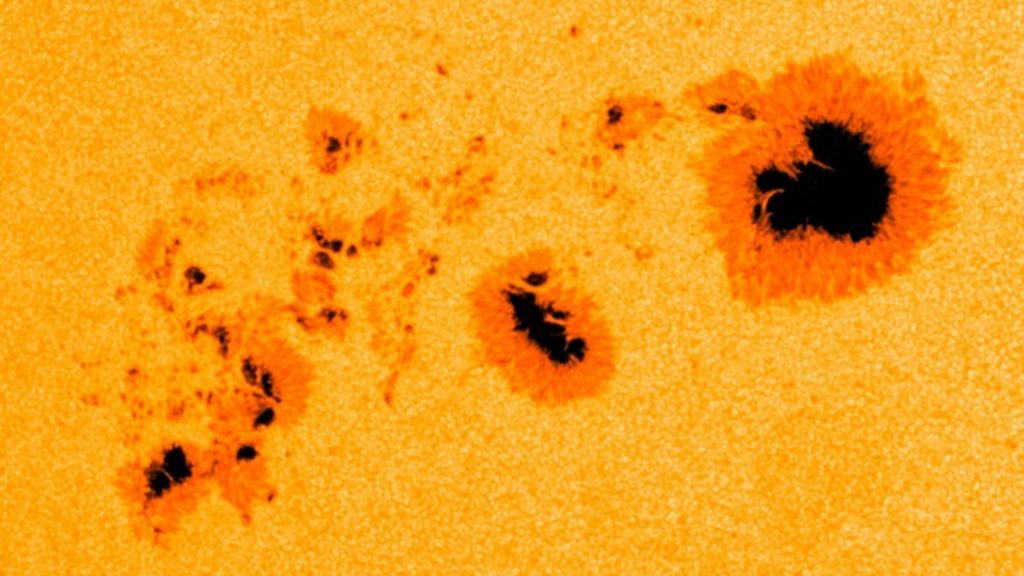
As magnetic fields on the sun rearrange and realign, dark spots known as sunspots can appear on its surface. Over the course of Feb. 19-20, 2013, scientists watched a giant sunspot form in under 48 hours. It has grown to over six Earth diameters across but its full extent is hard to judge since the spot lies on a sphere not a flat disk.
The spot quickly evolved into what's called a delta region, in which the lighter areas around the sunspot, the penumbra, exhibit magnetic fields that point in the opposite direction of those fields in the center, dark area. This is a fairly unstable configuration that scientists know can lead to eruptions of radiation on the sun called solar flares.
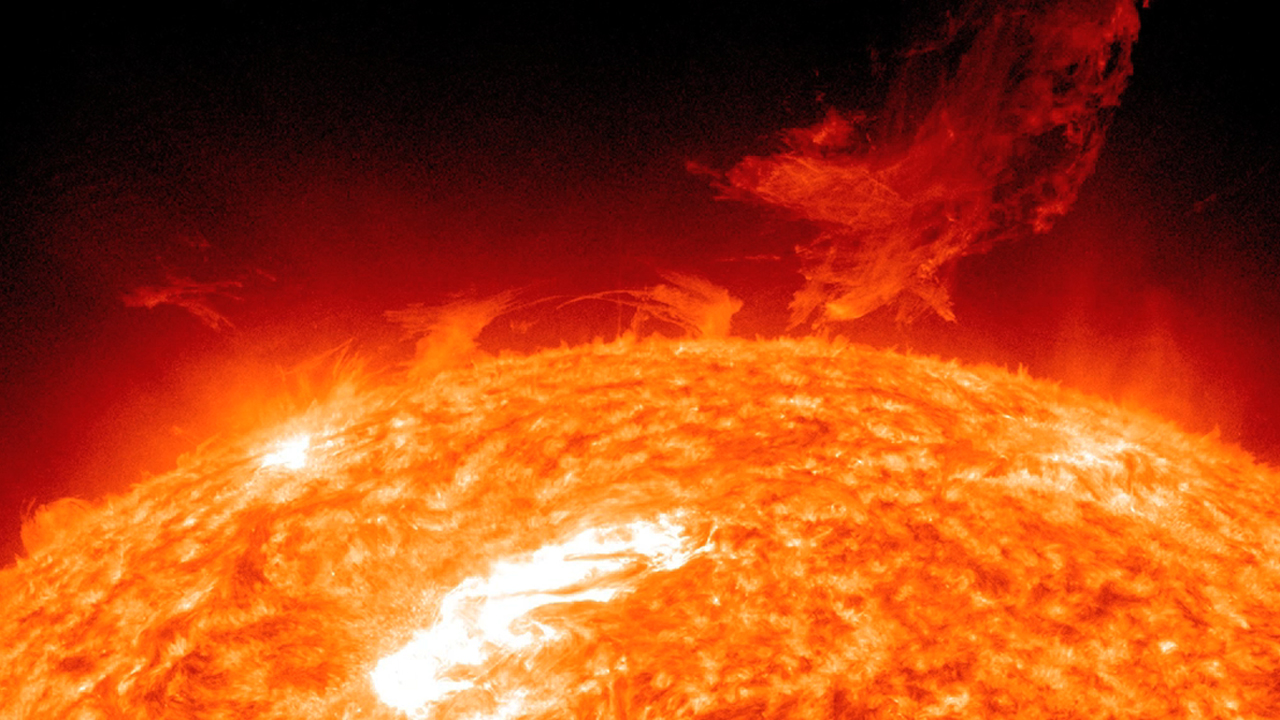
: the Helioseismic and Magnetic Imager (HMI), which takes pictures in visible light that show sunspots and the Advanced Imaging Assembly (AIA), which took an image in the 304 angstrom wavelength showing the lower atmosphere of the sun, which is colorized in red. Credit: NASA/SDO/AIA/HMI/Goddard Space Flight Center")
The bottom two black spots on the sun, known as sunspots, appeared quickly over the course of Feb. 19-20, 2013. These two sunspots are part of the same system and are over six Earths across. This image combines images from two instruments on NASA's Solar Dynamics Observatory (SDO): the Helioseismic and Magnetic Imager (HMI), which takes pictures in visible light that show sunspots and the Advanced Imaging Assembly (AIA), which took an image in the 304 angstrom wavelength showing the lower atmosphere of the sun, which is colorized in red.
Credit: NASA/SDO/AIA/HMI/Goddard Space Flight Center
Wider version of image. The bottom two black spots on the sun, known as sunspots, appeared quickly over the course of Feb. 19-20, 2013. These two sunspots are part of the same system and are over six Earths across. This image combines images from two instruments on NASA's Solar Dynamics Observatory (SDO): the Helioseismic and Magnetic Imager (HMI), which takes pictures in visible light that show sunspots and the Advanced Imaging Assembly (AIA), which took an image in the 304 angstrom wavelength showing the lower atmosphere of the sun, which is colorized in red.
Credit: NASA/SDO/AIA/HMI/Goddard Space Flight Center
Full Disk image at full SDO resolution. This image combines images from two instruments on NASA's Solar Dynamics Observatory (SDO): the Helioseismic and Magnetic Imager (HMI), which takes pictures in visible light that show sunspots and the Advanced Imaging Assembly (AIA), which took an image in the 304 angstrom wavelength showing the lower atmosphere of the sun, which is colorized in red.
Credit: NASA/SDO/AIA/HMI/Goddard Space Flight Center
Full disk, full resolution image of sun the Helioseismic and Magnetic Imager (HMI), which takes pictures in visible light that show sunspots.
Credit: NASA/SDO/HMI/Goddard Space Flight Center
For More Information
Credits
Please give credit for this item to:
NASA's Goddard Space Flight Center/SDO
-
Animator
- Scott Wiessinger (USRA)
-
Producer
- Scott Wiessinger (USRA)
-
Writer
- Karen Fox (ADNET Systems, Inc.)
Missions
This page is related to the following missions:Series
This page can be found in the following series:Tapes
The media on this page originally appeared on the following tapes:-
2013 Heliophysics Breaking News
(ID: 2013021)
Tuesday, December 31, 2013 at 5:00AM
Produced by - Robert Crippen (NASA)
Datasets used
-
[SDO]
ID: 168This dataset can be found at: http://sdo.gsfc.nasa.gov/
See all pages that use this dataset -
SDO Continuum (Continuum) [SDO: HMI]
ID: 674 -
SDO Magnetogram (Magnetogram) [SDO: HMI]
ID: 675 -
AIA 304 (304 Filter) [SDO: AIA]
ID: 677This dataset can be found at: http://jsoc.stanford.edu/
See all pages that use this dataset -
AIA 171 (171 Filter) [SDO: AIA]
ID: 680This dataset can be found at: http://jsoc.stanford.edu/
See all pages that use this dataset
Note: While we identify the data sets used on this page, we do not store any further details, nor the data sets themselves on our site.
Related
- ID: 12073
 Produced Video
 - ID: 11473
 Produced Video
Release date
This page was originally published on Friday, February 22, 2013.
This page was last updated on Wednesday, May 3, 2023 at 1:52 PM EDT.