The 2024 Total Solar Eclipse
This page is also available in the following languages:
- Tagalog (Wikang Tagalog)
- Vietnamese (tiếng Việt)
- Simplified Chinese (汉语)
- Traditional Chinese (漢語)
- Arabic (بهاس ملايو)
- Korean (한국어)

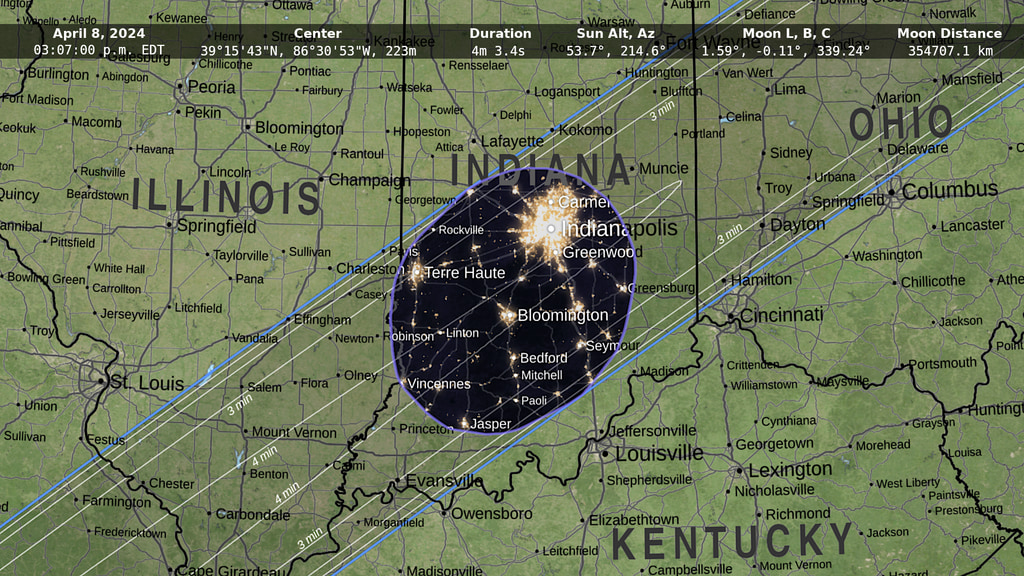
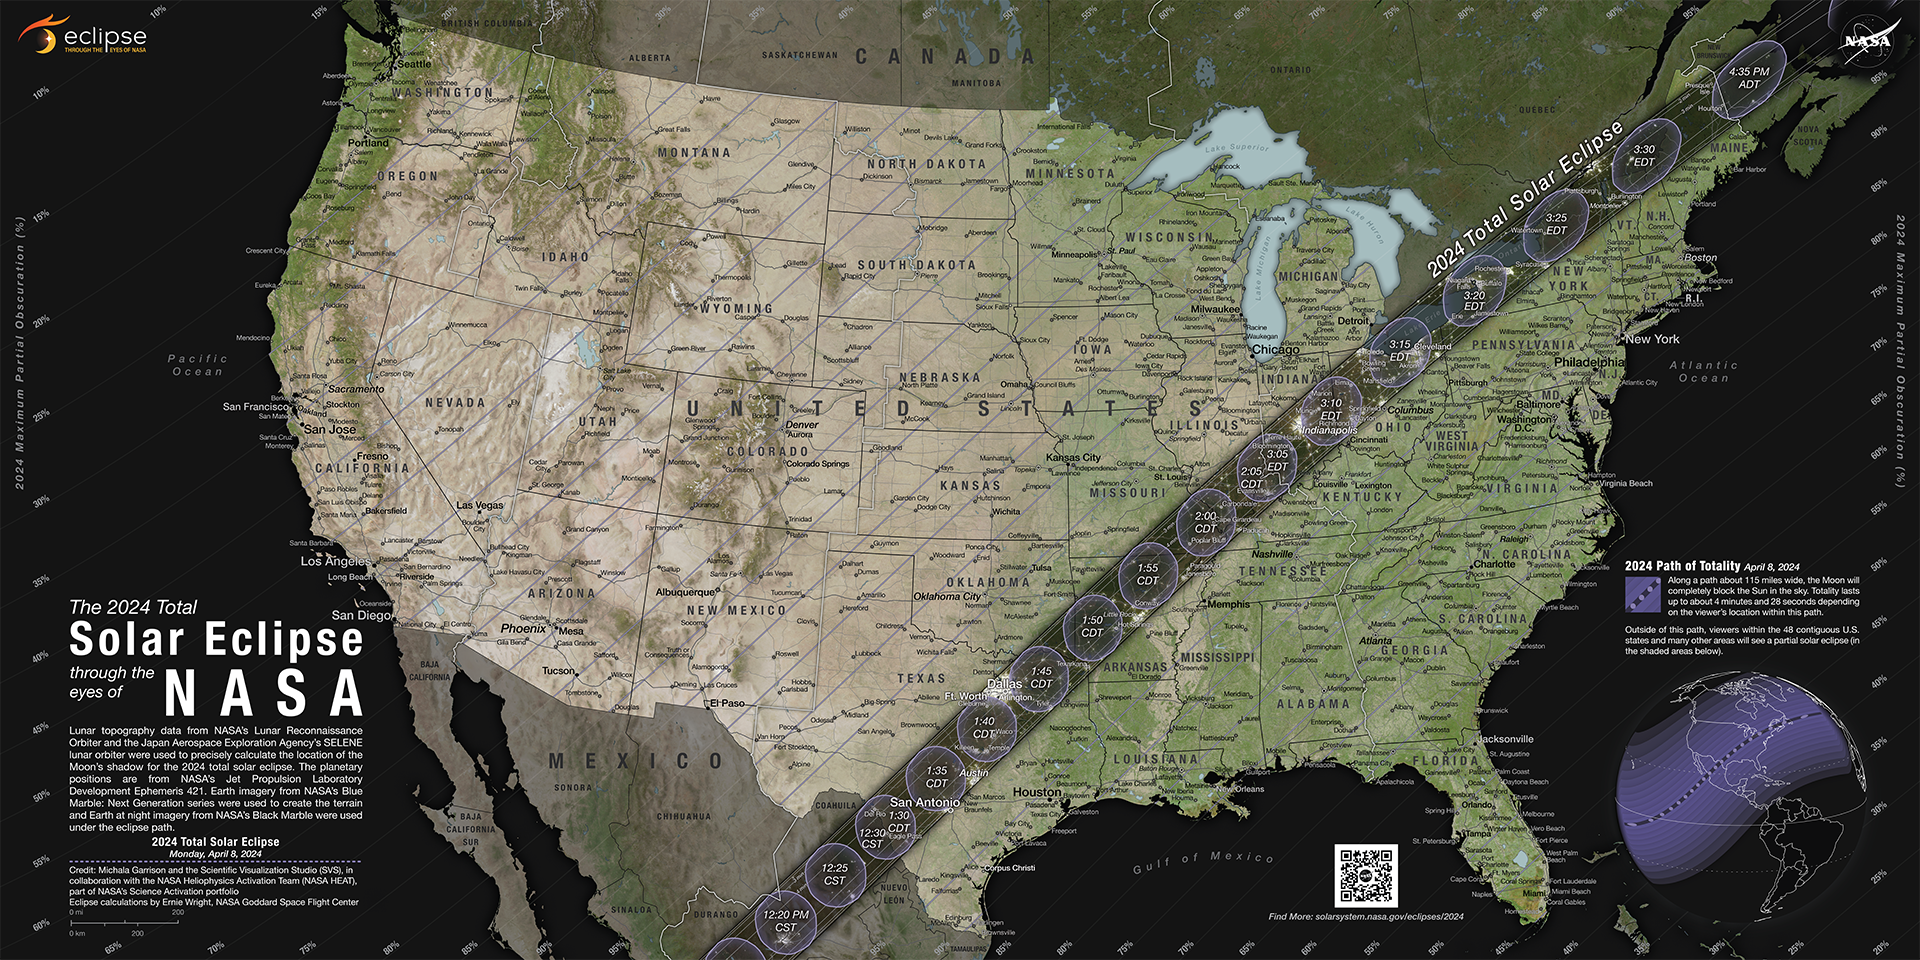
The path of totality and partial contours crossing the U.S. for the 2024 total solar eclipse occurring on April 8, 2024.
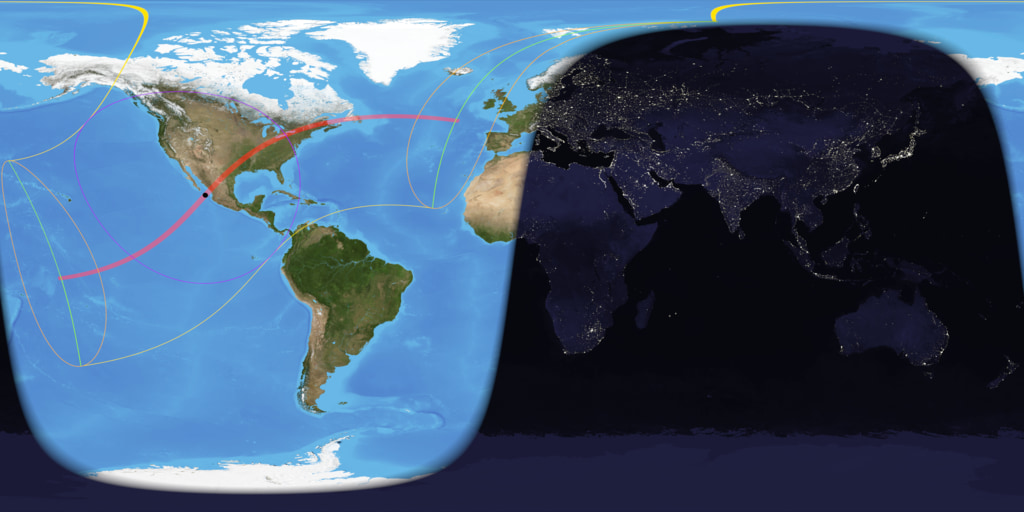
This map illustrates the paths of the Moon’s shadow across the U.S. during the 2024 total solar eclipse. On April 8, 2024, a total solar eclipse will cross North and Central America creating a path of totality. During a total solar eclipse, the Moon completely blocks the Sun while it passes between the Sun and Earth. The sky will darken as if it were dawn or dusk and those standing in the path of totality may see the Sun’s outer atmosphere (the corona) if weather permits.
Making the Map
This map uses datasets from several NASA missions. The eclipse data were calculated by visualizer Ernie Wright using elevation information from SRTM, lunar topography from LRO, and planetary positions from the JPL DE421 ephemeris. The lead visualizer, Michala Garrison, used Earth imagery from NASA’s Blue Marble Next Generation to create the terrain map. Likewise, nighttime Earth imagery from NASA’s Black Marble were used along the path of the 2024 total solar eclipse.Reading the Map
The dark path across the map is where the largest area of the Sun will be covered by the Moon. People in this path will experience a total solar eclipse. Inside the dark eclipse path are irregular ovals that delineate the Moon’s shadow on the Earth’s surface. For a total solar eclipse, the ovals are called the umbra and create the path of totality. On the map, the ovals contain times inside corresponding to the shape of the Moon’s shadow cast at that time during the eclipse.Also within the dark path are duration contours. These delineate the length of time totality will last. The closer to the center of the solar eclipse path, the longer it will last. For the total path, times range up to 4 minutes.
Outside the eclipse path, the map displays contours of obscuration, or percentage of the Sun’s area covered by the Moon. Readers can trace the lines to percentages printed along all sides of the map that range from 95% to 10% obscuration. The dark path marks when 100% obscuration begins.
Download Eclipse Data
2024 Total Solar Eclipse Data: 2024eclipse_shapefiles.zipThe .zip file above contains the following files:
- center.shp A high-resolution polyline tracing the path of the shadow center. Region limited.
- duration.shp Isocontours of maximum total duration, at 30-second intervals.
- ppath.shp “Penumbra path,” contours of maximum partial obscuration (area of the Sun covered by the Moon) at 5% intervals.
- ppath01.shp “Penumbra path,” contours of maximum partial obscuration (area of the Sun covered by the Moon) at 1% intervals.
- umbra_hi.shp High resolution umbra polygons, at 1-second intervals. Region limited.
- umbra_lo.shp Lower resolution umbra polygons, at 10-second intervals. Global.
- upath_hi.shp High resolution path shape. Region limited.
- upath_lo.shp Lower resolution path shape. Global.
More Map Versions
Same map with no QR code.
Same map with no text.
Map with no cities.
Map with no cities or text.
Credits
Please give credit for this item to:
NASA's Scientific Visualization Studio
-
Visualizers
- Michala Garrison (SSAI)
-
Ernie Wright
(USRA)

-
Technical support
- Laurence Schuler (ADNET Systems, Inc.)
- Ian Jones (ADNET Systems, Inc.)
Datasets used
-
[SRTM: SIR-C]
ID: 92 -
Blue Marble Land Cover [Terra and Aqua: MODIS]
ID: 510Credit: The Blue Marble data is courtesy of Reto Stockli (NASA/GSFC).
See all pages that use this dataset -
DEM (Digital Elevation Map) [LRO: LOLA]
ID: 653 -
DE421 (JPL DE421)
ID: 752Planetary ephemerides
This dataset can be found at: http://ssd.jpl.nasa.gov/?ephemerides#planets
See all pages that use this dataset -
SLDEM2015 (DIgital Elevation Model) [LRO/SELENE: LOLA/TC]
ID: 948A digital elevation model of the Moon derived from the Lunar Orbiter Laser Altimeter and the SELENE Terrain Camera. See the description in Icarus. The data is here.
See all pages that use this dataset -
Black Marble (Black Marble: Next Generation) [Suomi NPP: VIIRS]
ID: 1176Earth at night imagery
Credit: NASA Earth Observatory images by Joshua Stevens, using Suomi NPP VIIRS data from Miguel Román, NASA GSFC.
This dataset can be found at: https://visibleearth.nasa.gov/images/144898/earth-at-night-black-marble-2016-color-maps/144947l
See all pages that use this dataset
Note: While we identify the data sets used on this page, we do not store any further details, nor the data sets themselves on our site.
Related
- ID: 14551
- ID: 14537
 Produced Video
 - ID: 5219
 Visualization
 - ID: 14520
![NASA's 2024 Total Solar Eclipse Broadcast (OFFICIAL TRAILER)Music Credit: “Fallout Instrumental” by Christopher James Brett [PRS] via Universal Production MusicComplete transcript available.](/vis/a010000/a014500/a014520/14520_TSEBroadcastTrailer_thumb.png) Produced Video
Produced Video - ID: 14519
 Produced Video
 - ID: 5212
Alternate Versions
- ID: 5247
 Visualization
 - ID: 5249Visualization
- ID: 5250
 Visualization
 - ID: 5251
 Visualization
 - ID: 5252
 Visualization
 - ID: 5253
 Visualization
Sources
- ID: 5073
 Visualization
Used as a Source In
- ID: 14474
![Map Credit: Michala Garrison and the Scientific Visualization Studio (SVS), in collaboration with the NASA Heliophysics Activation Team (NASA HEAT), part of NASA’s Science Activation portfolio; eclipse calculations by Ernie Wright, NASA Goddard Space Flight CenterMusic Credit: “Cascades” by Air Jared [ASCAP], Sebastian Barnaby Robertson [BMI] via Universal Production Music
Watch this video on the NASA Goddard YouTube channel.](/vis/a010000/a014400/a014474/14474_Thumbnail.png) Produced Video
Produced Video
Release date
This page was originally published on Monday, July 10, 2023.
This page was last updated on Sunday, January 12, 2025 at 10:59 PM EST.