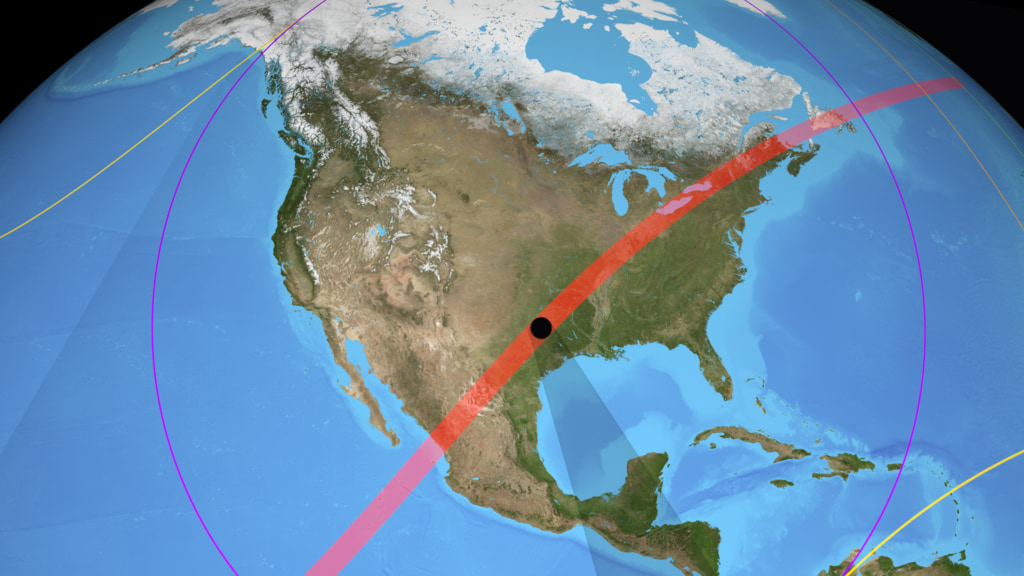
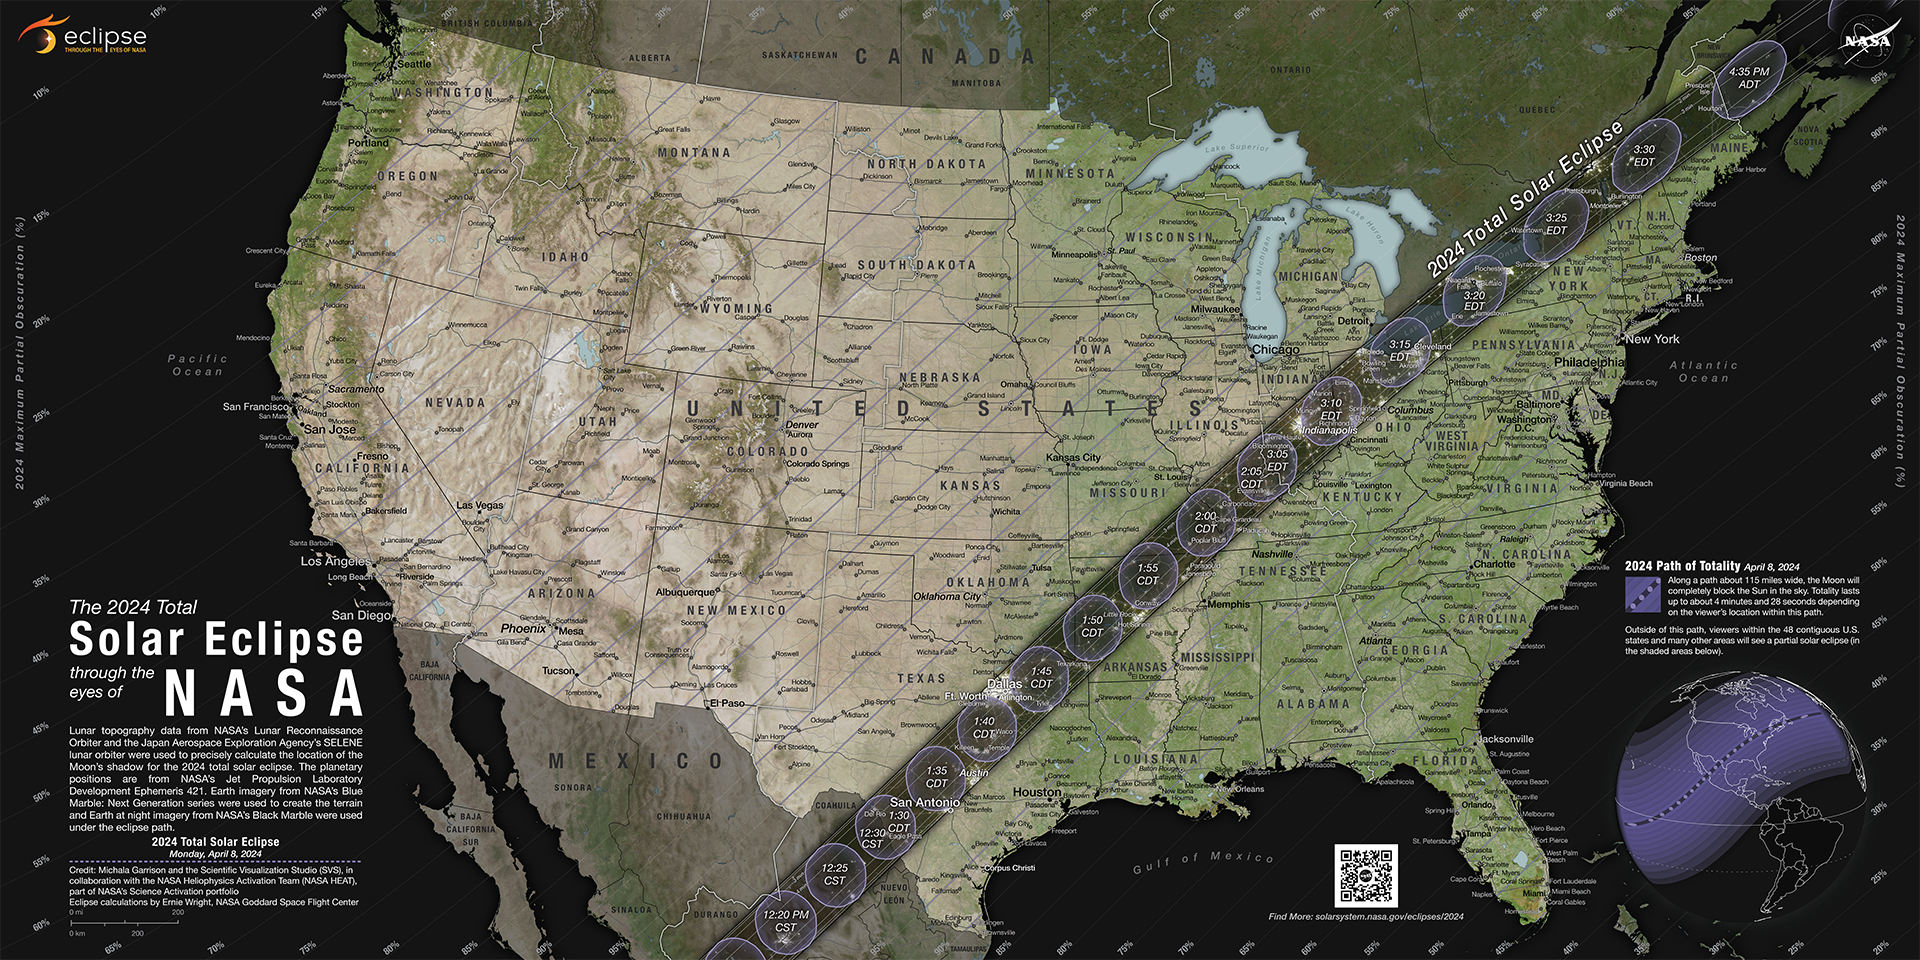
2024 Path of Totality
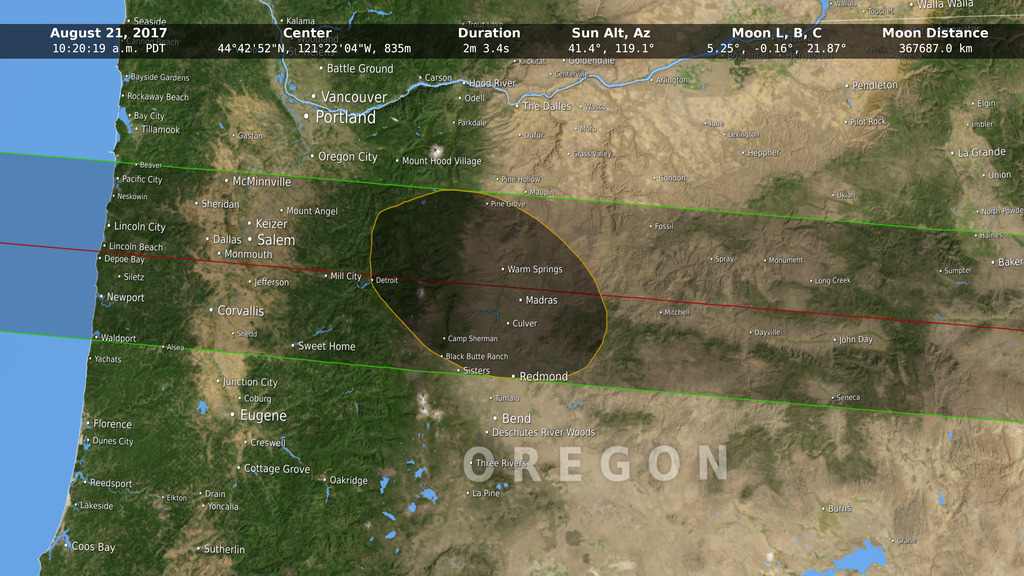
This visualization closely follows the Moon's umbra shadow as it crosses North America during the April 8, 2024 total solar eclipse. It covers the one hour and 50 minutes between 10:57 a.m. Pacific Standard Time and 4:47 p.m. Atlantic Daylight Time. Annotations include a running clock and the location of the center of the shadow. Everyone within the dark oval sees totality.
During the April 8, 2024 total solar eclipse, the Moon's umbral shadow will fly across North America, from Mazatlán on the Pacific coast of Mexico to eastern Canada's island of Newfoundland, in a little less than two hours. The path of this shadow, the path of totality, is where observers will see the Moon completely cover the Sun for up to four and a half minutes.
Within the United States, the path touches 15 states: Texas, Oklahoma, Arkansas, Missouri, the extreme northwest corner of Tennessee, Illinois, far western Kentucky, Indiana, Ohio, the extreme southeast corner of Michigan, Pennsylvania, New York, Vermont, New Hampshire, and Maine.
For this visualization, the umbra and its path were calculated in a way that accounts for both elevations on the Earth's surface and the irregular lunar limb (the shilhouette edge of the Moon's disk). Both can have surprising effects on the shape of the umbra and the location of the path. Go here to read more about these effects.
Versions of the animation are provided both with and without the text annotations. A selection of still images highlight particular locations along the path.
This visualization closely follows the Moon's umbra shadow as it crosses North America during the April 8, 2024 total solar eclipse. It covers the one hour and 50 minutes between 10:57 a.m. Pacific Standard Time and 4:47 p.m. Atlantic Daylight Time. This version omits the annotations.
 Mazatlán")
18:09:36 UTC (11:09:36 a.m. PST) Mazatlán
18:18:56 UTC (12:18:56 p.m. CST) Torreón
18:34:14 UTC (1:34:14 p.m. CDT) Kerrville, San Antonio
18:37:22 UTC (1:37:22 p.m. CDT) Killeen, Austin
18:42:26 UTC (1:42:26 p.m. CDT) Dallas, Fort Worth
18:52:38 UTC (1:52:38 p.m. CDT) Little Rock
19:01:18 UTC (2:01:18 p.m. CDT) Carbondale
19:07:50 UTC (3:07:50 p.m. EDT) Indianapolis
19:15:32 UTC (3:15:32 p.m. EDT) Cleveland
19:21:00 UTC (3:21:00 p.m. EDT) Buffalo, Rochester
19:27:42 UTC (3:27:42 p.m. EDT) Montreal, Burlington
Credits
Please give credit for this item to:
NASA's Scientific Visualization Studio
-
Visualizers
-
Ernie Wright
(USRA)

- Michala Garrison (SSAI)
-
Ernie Wright
(USRA)
-
Technical support
- Laurence Schuler (ADNET Systems, Inc.)
- Ian Jones (ADNET Systems, Inc.)
Datasets used
-
DEM [SRTM: SIR-C]
ID: 481 -
BMNG (Blue Marble: Next Generation) [Terra and Aqua: MODIS]
ID: 508Credit: The Blue Marble data is courtesy of Reto Stockli (NASA/GSFC).
This dataset can be found at: http://earthobservatory.nasa.gov/Newsroom/BlueMarble/
See all pages that use this dataset -
DEM (Digital Elevation Map) [LRO: LOLA]
ID: 653 -
DE421 (JPL DE421)
ID: 752Planetary ephemerides
This dataset can be found at: http://ssd.jpl.nasa.gov/?ephemerides#planets
See all pages that use this dataset -
North America Roads (Natural Earth: North America Roads)
ID: 968The 1:1,000,000 scale roads database for North America from Natural Earth: http://www.naturalearthdata.com/downloads/10m-cultural-vectors/roads/. This data is in the public domain. Terms of use: http://www.naturalearthdata.com/about/terms-of-use/.
See all pages that use this dataset -
Black Marble (Black Marble: Next Generation) [Suomi NPP: VIIRS]
ID: 1176Earth at night imagery
Credit: NASA Earth Observatory images by Joshua Stevens, using Suomi NPP VIIRS data from Miguel Román, NASA GSFC.
This dataset can be found at: https://visibleearth.nasa.gov/images/144898/earth-at-night-black-marble-2016-color-maps/144947l
See all pages that use this dataset
Note: While we identify the data sets used on this page, we do not store any further details, nor the data sets themselves on our site.
Related
- ID: 14551
- ID: 14557
![Music Credit: “Corals Instrumental” by Marc Burh [GEMA], Marek Nichel [GEMA] via Universal Production MusicAdditional photographs and footage: Unsplash, Videvo](/vis/a010000/a014500/a014557/14557_EclipsePhotoTips_Thumbnail.png) Produced Video
Produced Video - ID: 14537
 Produced Video
 - ID: 14530
![Music Credit: “Fly Beyond Instrumental” Magnum Opus [ASCAP] via Universal Production MusicComplete transcript available.](/vis/a010000/a014500/a014530/GAVRT_Thumbnail.png) Produced Video
Produced Video - ID: 5186
 Visualization
 - ID: 5123
 Visualization
 - ID: 4515
 Visualization
Used as a Source In
- ID: 14562
 Produced Video
Release date
This page was originally published on Tuesday, February 13, 2024.
This page was last updated on Monday, January 13, 2025 at 12:17 AM EST.