April 8, 2024 Total Solar Eclipse Path for Spherical Displays
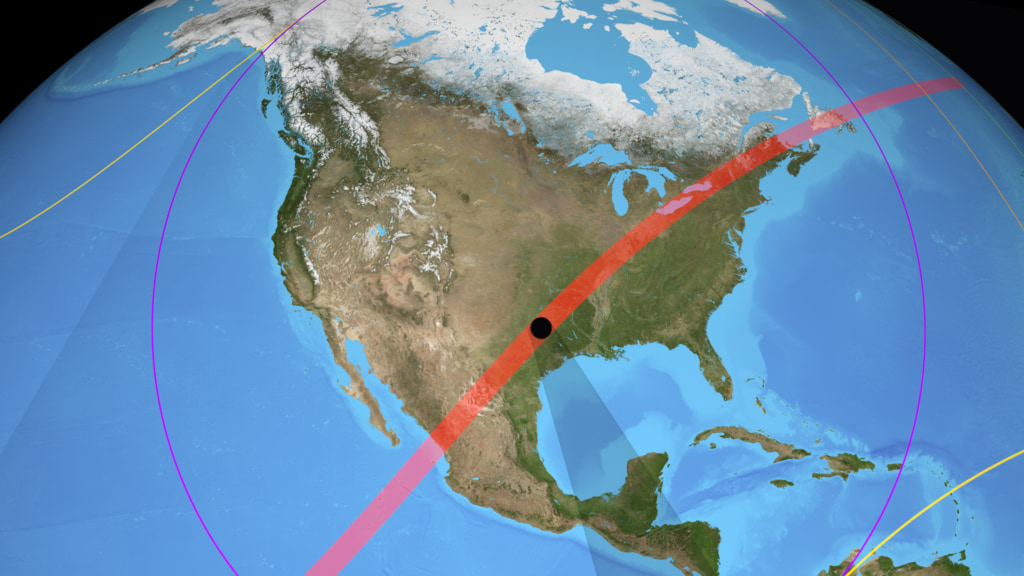
A map-like view of the Earth during the total solar eclipse of April 8, 2024, showing the umbra (small black oval), penumbra (purple outline), and the path of totality (red). This equirectangular projection is suitable for spherical displays and for spherical mapping in 3D animation software.
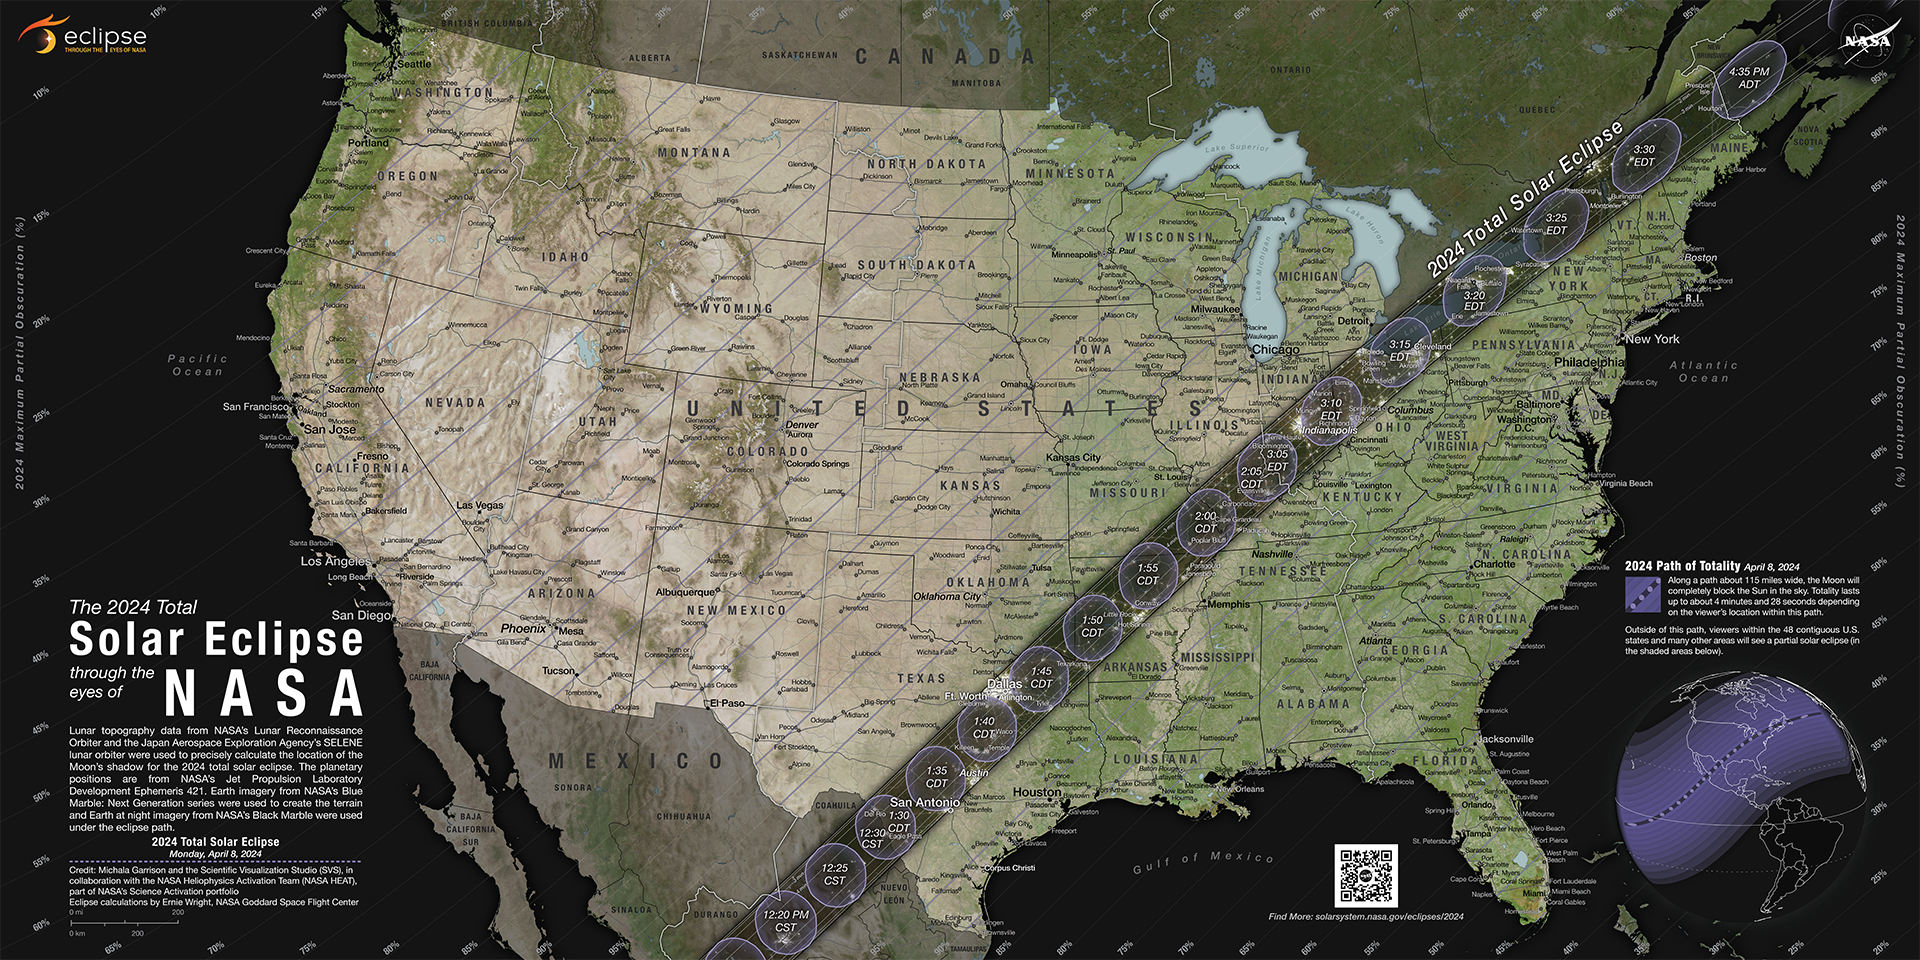
On Monday, April 8, 2024, the Moon will pass in front of the Sun, casting its shadow across North America along a path from Mexico and Texas to Maine and New Brunswick. The next total solar eclipses visible in this part of the world occur on March 30, 2033 (northwestern Alaska), August 23, 2044 (Canada, Montana, North Dakota), and August 12, 2045 (from Northern California to Florida).
The Moon's shadow can be divided into areas called the umbra and the penumbra. Within the penumbra, the Sun is only partially blocked, and observers experience a partial eclipse. The much smaller umbra lies at the very center of the shadow cone, and anyone there sees the Moon entirely cover the Sun in a total solar eclipse.
In this visualization, the umbra is the small black oval, and the path it sweeps out is drawn in red. The penumbra is outlined in purple, and the northern and southern edges of its path are yellow. Orange loops at either end of the eclipse path are sunrise and sunset lines, points on the Earth where the eclipse either begins or ends at sunrise or sunset. The green lines within these loops show the points where maximum eclipse occurs at sunrise (the western line) or sunset (the eastern line).
The visualization covers the entire time span of the eclipse from 15:42:10 to 20:52:20 UTC with steps of 10 seconds between frames.
Credits
Please give credit for this item to:
NASA's Scientific Visualization Studio
-
Visualizer
-
Ernie Wright
(USRA)

-
Ernie Wright
(USRA)
-
Technical support
- Laurence Schuler (ADNET Systems, Inc.)
- Ian Jones (ADNET Systems, Inc.)
Datasets used
-
BMNG (Blue Marble: Next Generation) [Terra and Aqua: MODIS]
ID: 508Credit: The Blue Marble data is courtesy of Reto Stockli (NASA/GSFC).
This dataset can be found at: http://earthobservatory.nasa.gov/Newsroom/BlueMarble/
See all pages that use this dataset -
DE421 (JPL DE421)
ID: 752Planetary ephemerides
This dataset can be found at: http://ssd.jpl.nasa.gov/?ephemerides#planets
See all pages that use this dataset
Note: While we identify the data sets used on this page, we do not store any further details, nor the data sets themselves on our site.
Related
- ID: 14551
- ID: 5186
 Visualization
 - ID: 5123
 Visualization
Release date
This page was originally published on Saturday, January 20, 2024.
This page was last updated on Saturday, January 20, 2024 at 5:10 PM EST.