Earth
ID: 4566
These visualizations show data from the Helheim Glacier in Greenland collected by Pre-Icebridge in 1998 and Operation Icebridge in 2013. Data from both the Airborne Topographic Mapper (ATM) and the Digital Mapping System (DMS) are included.
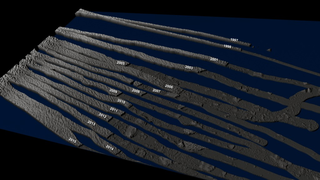
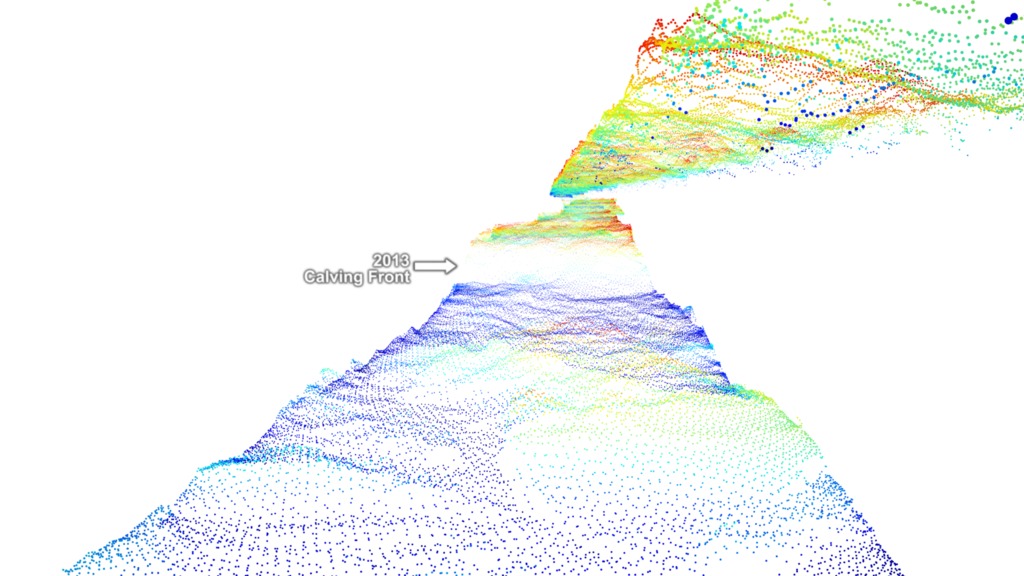
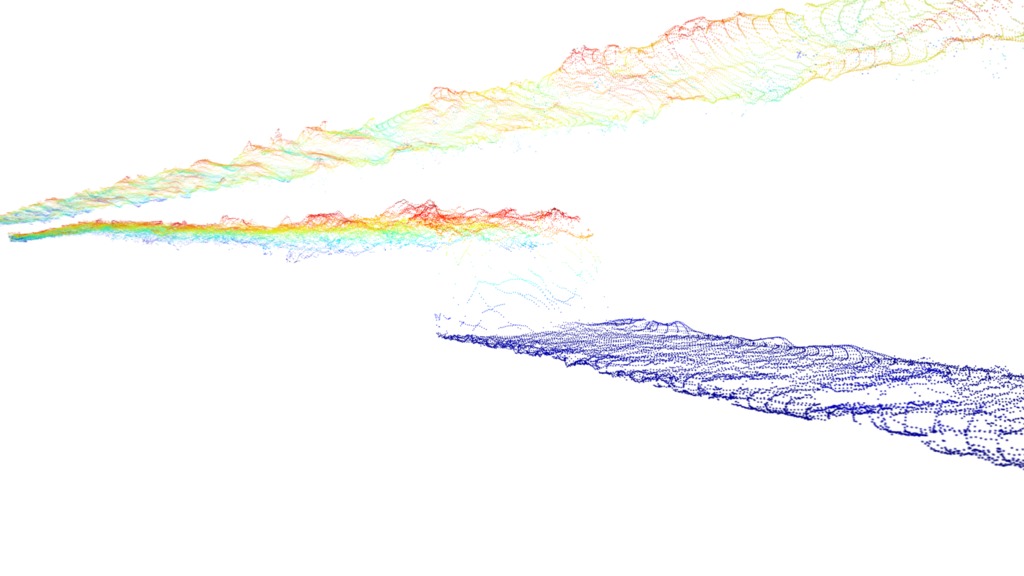
The first visualization shows how the scanner on the aircraft acquired the data, building up a representation of the 3d laser scanned points as we go. Once the calving front from 1998 is revealed, the 2013 data is faded in showing the differences between the years. The dots are colored initially by absolute height with reds higher and blues lower; after the 2013 data is added, the dot colors change to a localized scheme with reds higher than nearby points and blues lower than nearby points. ATM data is added at the end for some context.
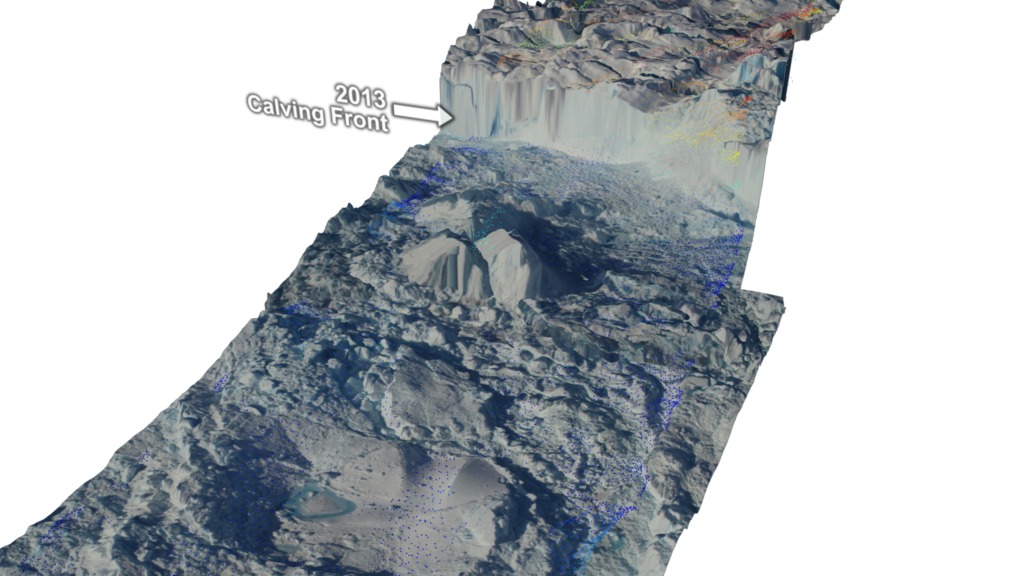
The second visualization shows the DMS data with ATM data at the 2013 calving front. The DMS data is overlayed onto photogrametrically determined altitudes which don't precisely correspond to the ATM data. The heights of the ATM data are the 'true' heights.
Operation Icebridge Studies Changes in Greenland's Helheim Glacier
The first visualization shows how the scanner on the aircraft acquired the data, building up a representation of the 3d laser scanned points as we go. Once the calving front from 1998 is revealed, the 2013 data is faded in showing the differences between the years. The dots are colored initially by absolute height with reds higher and blues lower; after the 2013 data is added, the dot colors change to a localized scheme with reds higher than nearby points and blues lower than nearby points. ATM data is added at the end for some context.
The second visualization shows the DMS data with ATM data at the 2013 calving front. The DMS data is overlayed onto photogrametrically determined altitudes which don't precisely correspond to the ATM data. The heights of the ATM data are the 'true' heights.
Used Elsewhere In

Related
Visualization Credits
Greg Shirah (NASA/GSFC): Lead Visualizer
Laurence Schuler (ADNET Systems, Inc.): Technical Support
Ian Jones (ADNET Systems, Inc.): Technical Support
Jefferson Beck (USRA): Producer
Michael Studinger (NASA/GSFC): Scientist
Laurence Schuler (ADNET Systems, Inc.): Technical Support
Ian Jones (ADNET Systems, Inc.): Technical Support
Jefferson Beck (USRA): Producer
Michael Studinger (NASA/GSFC): Scientist
Please give credit for this item to:
NASA's Scientific Visualization Studio
NASA's Scientific Visualization Studio
Short URL to share this page:
https://svs.gsfc.nasa.gov/4566
Mission:
Operation IceBridge
Data Used:
Note: While we identify the data sets used in these visualizations, we do not store any further details nor the data sets themselves on our site.
This item is part of this series:
Operation IceBridge
Keywords:
GCMD >> Earth Science >> Cryosphere >> Glaciers/Ice Sheets
GCMD >> Earth Science >> Cryosphere >> Glaciers/Ice Sheets >> Glacier Thickness/Ice Sheet Thickness
SVS >> Hyperwall
NASA Science >> Earth
GCMD keywords can be found on the Internet with the following citation: Olsen, L.M., G. Major, K. Shein, J. Scialdone, S. Ritz, T. Stevens, M. Morahan, A. Aleman, R. Vogel, S. Leicester, H. Weir, M. Meaux, S. Grebas, C.Solomon, M. Holland, T. Northcutt, R. A. Restrepo, R. Bilodeau, 2013. NASA/Global Change Master Directory (GCMD) Earth Science Keywords. Version 8.0.0.0.0
https://svs.gsfc.nasa.gov/4566
Mission:
Operation IceBridge
Data Used:
Digital Mapping System also referred to as: DMS Photogrammetry
NASA Ames Airborne Sensor Facility (DMS), Fireball International Services Corp., Cirrus Digital Systems - 1998, 2013Icebridge/ATM/L1B Elevation and Return Strength, Version 2 (2013 data)
Observed Data - 2013Pre-Icebridge/ATM/L1B Qfit Elevation and Return Strength, Version 1 (1998 data)
Observed Data - 1998This item is part of this series:
Operation IceBridge
Keywords:
GCMD >> Earth Science >> Cryosphere >> Glaciers/Ice Sheets
GCMD >> Earth Science >> Cryosphere >> Glaciers/Ice Sheets >> Glacier Thickness/Ice Sheet Thickness
SVS >> Hyperwall
NASA Science >> Earth
GCMD keywords can be found on the Internet with the following citation: Olsen, L.M., G. Major, K. Shein, J. Scialdone, S. Ritz, T. Stevens, M. Morahan, A. Aleman, R. Vogel, S. Leicester, H. Weir, M. Meaux, S. Grebas, C.Solomon, M. Holland, T. Northcutt, R. A. Restrepo, R. Bilodeau, 2013. NASA/Global Change Master Directory (GCMD) Earth Science Keywords. Version 8.0.0.0.0


