Operation IceBridge Tracks over the Helheim Glacier in Greenland
Composited version of Helheim OIB tracks visualization
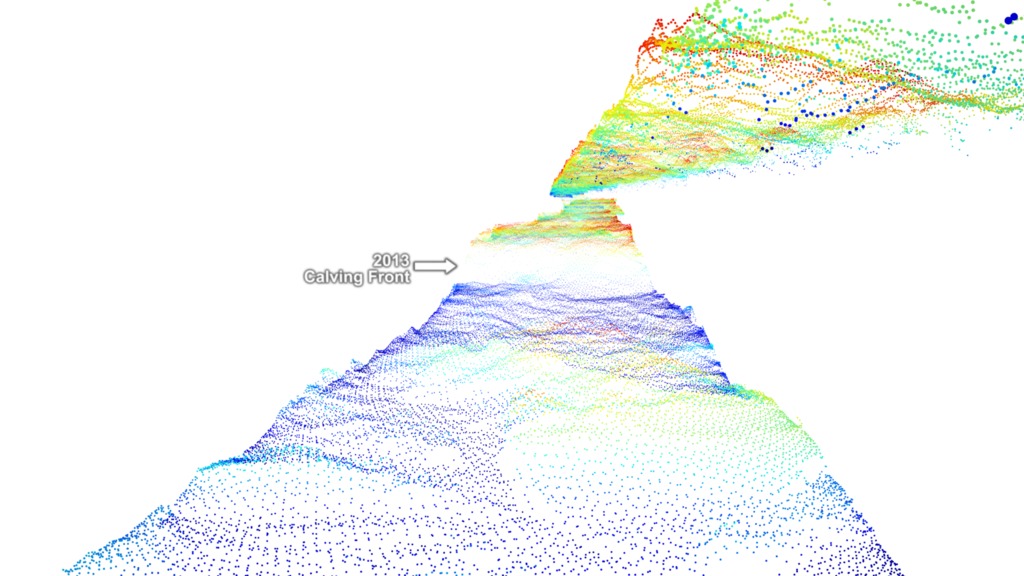
Operation Ice Bridge (OIB) has been flying annual airborne missions over the Helheim Glacier in Greenland since 1997. These missions record the elevation of the glacier along a long, thin track near the middle of the glacier. This record of heights helps scientists see how the glacier has changed over the years.
This visualization shows OIB tracks from each year in sequence. The camera then moves to the side to compare the ice profiles on a graph. The track profiles are shown to scale (i.e., no exaggeration) until they are compared on the graph where they are exaggerated 10 times to help see the changes.
The initial camera for this animation matches the end of the Helheim visualization (#4348).
Image layers are included for each track and the graph for those wishing to create different composites.

OIB track layers from 1997 to 2015 arranged next to each other

1997 OIB track layer

1998 OIB track layer

2001 OIB track layer

2003 OIB track layer

2005 OIB track layer

2006 OIB track layer

2007 OIB track layer

2008 OIB track layer

2009 OIB track layer

2010 OIB track layer

2011 OIB track layer

2012 OIB track layer

2013 OIB track layer

2016 OIB track layer

2015 OIB track layer

Helheim Radarsat background layer

x-axis layer

graph layer

y-axis layer

graph mask layer
Credits
Please give credit for this item to:
NASA's Scientific Visualization Studio
-
Visualizers
-
Greg Shirah
(NASA/GSFC)

-
Cindy Starr
(Global Science and Technology, Inc.)
-
Greg Shirah
(NASA/GSFC)
-
Scientist
- Kyle Krabill (Sigma Space Corporation)
-
Producer
- Jefferson Beck (USRA)
Missions
This page is related to the following missions:Series
This page can be found in the following series:Datasets used
-
[RADARSAT-1: SAR]
ID: 87Credit: Additional credit goes to Canadian Space Agency, RADARSAT International Inc.
See all pages that use this dataset -
Operation Ice Bridge Flight Paths
ID: 657NASA DC-8 Flight Path
See all pages that use this dataset -
GIMP Greenland DEM (Greenland Mapping Project (GIMP) Digital Elevation Model)
ID: 746
Note: While we identify the data sets used on this page, we do not store any further details, nor the data sets themselves on our site.
Related
- ID: 4566
- ID: 11976
 Produced Video
Release date
This page was originally published on Wednesday, August 31, 2016.
This page was last updated on Sunday, January 5, 2025 at 10:47 PM EST.