NASA Views Laser Landscapes of Helheim Glacier
Complete transcript available.
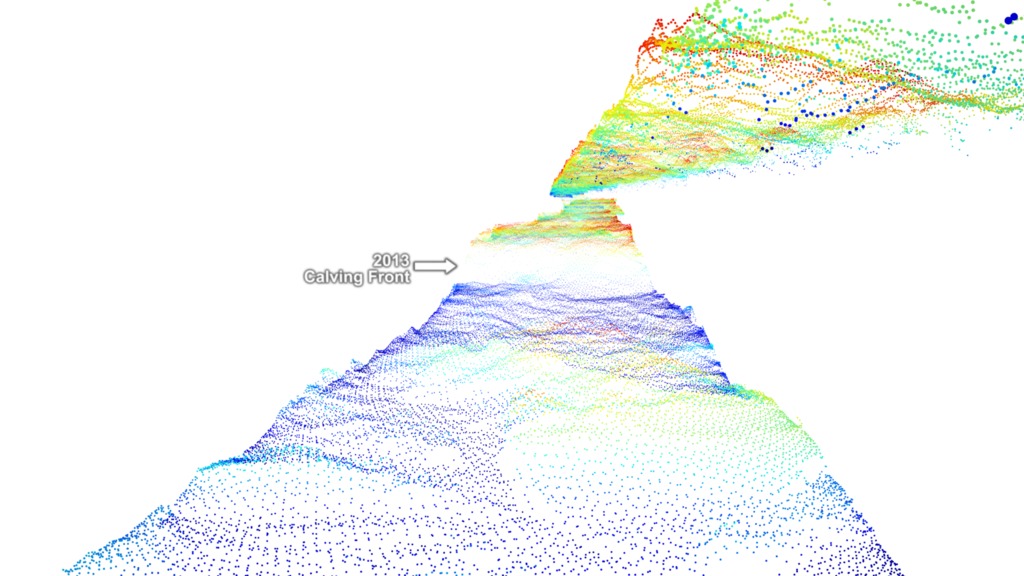
What if you could measure a glacier in such detail that you could visualize its surface in 3D? And what if you could compare that view with data from one, two, even 20 years ago? NASA airborne campaigns like Operation IceBridge have been measuring Greenland and Antarctica’s glaciers and ice sheets with a range of instruments for years, including radar, lasers, and high resolution cameras, in order to understand just how our planet’s ice is changing. This video shows in unprecedented detail how Greenland’s massive Helheim Glacier has changed over 20 years, using data from instruments like the Airborne Topographic Mapper laser altimeter and the Digital Mapping System cameras, which fly every year on IceBridge missions, and satellite data form the Canadian Space Agency’s Radarsat Satellite. IceBridge plans to return to Helheim again in 2018 to carry on its annual survey.
Credits
Please give credit for this item to:
NASA's Goddard Space Flight Center
-
Producer
- Jefferson Beck (USRA)
-
Visualizers
-
Greg Shirah
(NASA/GSFC)

-
Cindy Starr
(Global Science and Technology, Inc.)
-
Greg Shirah
(NASA/GSFC)
-
Scientists
- Joe MacGregor (NASA/GSFC)
- Kristin Poinar (USRA)
- Michael Studinger (NASA/GSFC)
- Ian Howat (Ohio State University)
- Ian Joughin (Polar Science Center, University of Washington)
- Twila Moon (University of Bristol)
-
Science writers
- Maria-Jose Vinas Garcia (Telophase)
- Patrick Lynch (NASA/GSFC)
-
Videographer
- Nasreen Alkhateeb (Advocates in Manpower Management, Inc.)
Missions
This page is related to the following missions:Series
This page can be found in the following series:Datasets used
-
[RADARSAT-1: SAR]
ID: 87Credit: Additional credit goes to Canadian Space Agency, RADARSAT International Inc.
See all pages that use this dataset -
[Airborne Topographic Mapper]
ID: 139 -
DMS Photogrammetry [Digital Mapping System]
ID: 729
Note: While we identify the data sets used on this page, we do not store any further details, nor the data sets themselves on our site.
Sources
- ID: 4566
Release date
This page was originally published on Friday, July 28, 2017.
This page was last updated on Thursday, October 10, 2024 at 12:16 AM EDT.