SOHO – Solar and Heliospheric Observatory
Overview
Launched in December 1995, the Solar and Heliospheric Observatory (SOHO) is a joint mission between NASA and ESA (European Space Agency) designed to study the Sun inside out. Though its mission was originally scheduled to last until 1998, SOHO continues to collect observations about the Sun’s interior, the solar atmosphere, and the constant stream of solar particles known as the solar wind, adding to scientists' understanding of our closest star and making many new discoveries, including finding more than 5,000 comets.
Learn more: https://science.nasa.gov/mission/soho/
SOHO Animations
- ID: 20230 Animation

Solar and Heliospheric Observatory (SOHO)
Go to this pageSOHO Beauty Pass || SOHO_00050_print.jpg (1024x576) [102.8 KB] || SOHO_00050_searchweb.png (320x180) [63.8 KB] || SOHO_00050_thm.png (80x40) [4.7 KB] || SOHO_prores.mov (1920x1080) [676.8 MB] || SOHO_h264.mov (1920x1080) [462.6 MB] || 1920x1080_16x9_60p (1920x1080) [64.0 KB] || SOHO_1080p60.mp4 (1920x1080) [15.9 MB] || SOHO_prores.webm (1920x1080) [2.2 MB] ||
- ID: 4805 Visualization
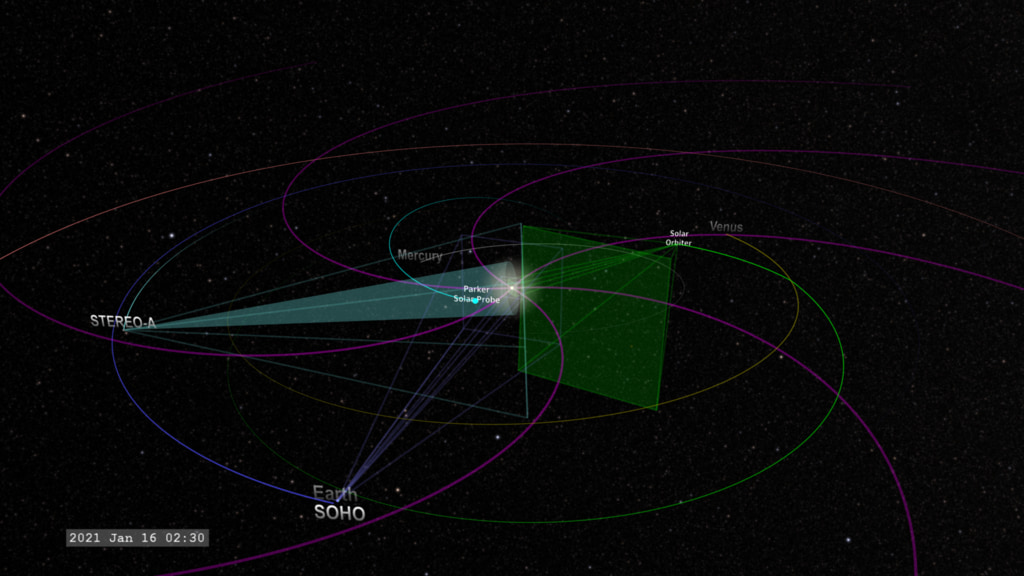
Coordinated Heliosphere - How Solar Missions Work Together
Go to this pageUsing Solar Orbiter, Parker Solar Probe, and other sun-observing missions, in coordinated observations, we can learn far more about the solar atmosphere which surrounds and impacts Earth and other missions in space, crewed and uncrewed. ||
SOHO Produced Content
- ID: 13775 Produced Video
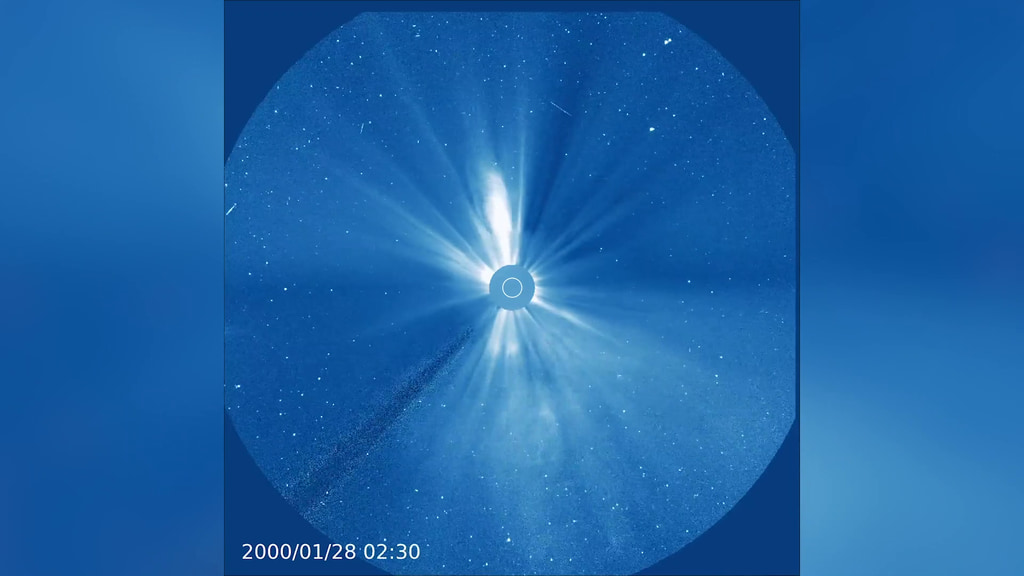
25 Years of Sun from ESA/NASA's SOHO
Go to this pageDecember 2, 1995 marks the 25th anniversary of the Solar and Heliospheric Observatory, or SOHO — a joint mission of the European Space Agency and NASA. Since its launch on that date, the mission has kept watch on the Sun. ||
- ID: 13011 Produced Video
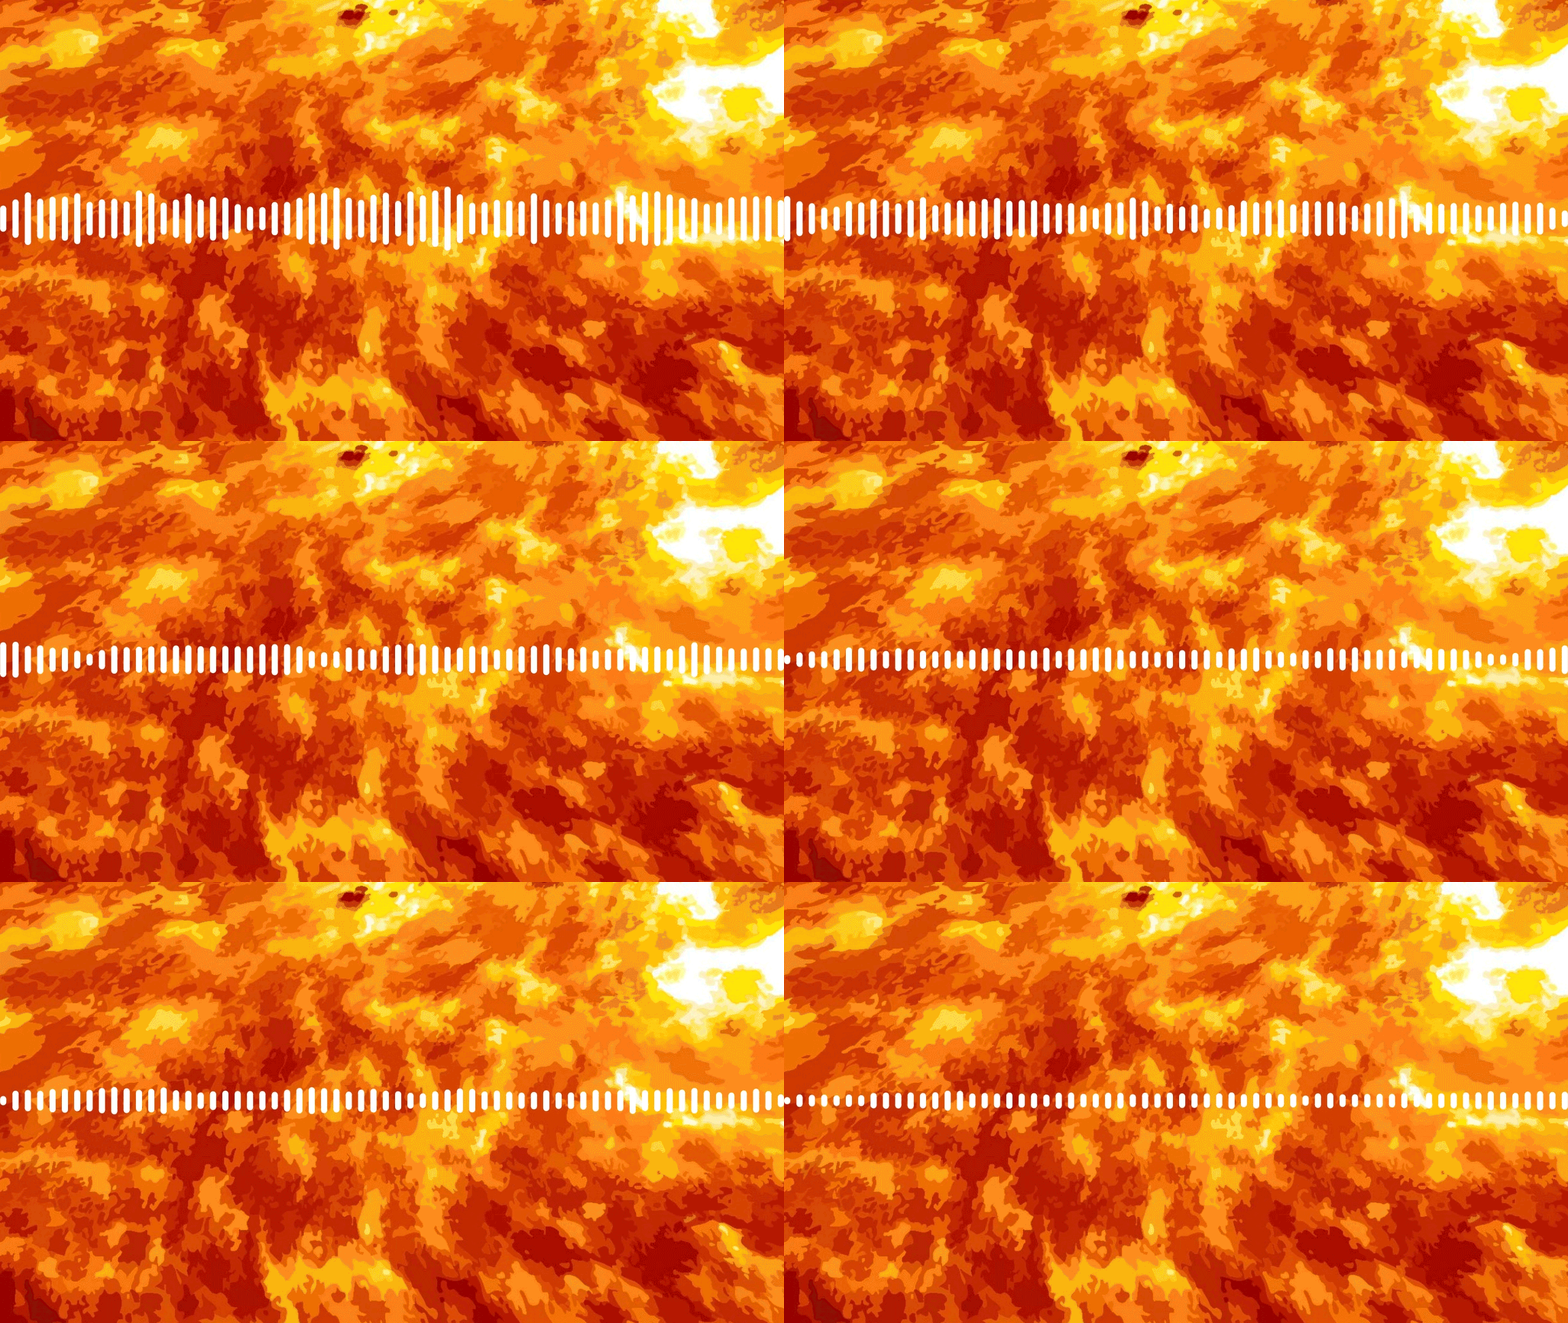
Sounds of the Sun
Go to this pageAn illustration of a sunspot inspired by imagery from NASA's Solar Dynamics Observatory (SDO). || sunspot.gif (1280x720) [1.5 MB] || sunspot_searchweb.png (320x180) [95.7 KB] ||
- ID: 12687 Produced Video
NASA and ESA Spacecraft Track a Solar Storm Through Space
Go to this pageThis animation follows the October 14, 2014 CME as it moves through the solar system and identifies a few of the NASA and ESA missions that observed it.Music: “Comely" from FelicityWritten and produced by Lars LeonhardWatch this video on the NASA.gov Video YouTube channel.Complete transcript available. || CME_Solar_System_Still.jpg (3840x2160) [555.5 KB] || CME_Solar_System_Still_searchweb.png (320x180) [38.4 KB] || CME_Solar_System_Still_thm.png (80x40) [4.0 KB] || 12687_CME_Solar_System_1080p.mov (1920x1080) [90.8 MB] || 12687_CME_Solar_System_FINAL_appletv.m4v (1280x720) [71.7 MB] || 12687_CME_Solar_System_1080p.webm (1920x1080) [10.4 MB] || 12687_CME_Solar_System_FINAL_appletv_subtitles.m4v (1280x720) [71.7 MB] || FACEBOOK_720_12687_CME_Solar_System_FINAL_facebook_720.mp4 (1280x720) [158.9 MB] || 12687_CME_Solar_System_SRT_Captions.en_US.srt [1.2 KB] || 12687_CME_Solar_System_SRT_Captions.en_US.vtt [1.2 KB] || 12687_CME_Solar_System_-4K.mov (3840x2160) [287.7 MB] || 12687_CME_Solar_System_Apple_Devices_4K.m4v (3840x2160) [340.2 MB] || YOUTUBE_4K_12687_CME_Solar_System_FINAL_youtube_4k.mp4 (3840x2160) [627.2 MB] || 12687_CME_Solar_System_ProRes_3840x2160_2997.mov (3840x2160) [2.5 GB] ||
- ID: 12379 Produced Video
![NASA’s Van Allen Probes Spot Electron Rainfall in the AtmosphereIn addition to the original video, a still image is also available for download within the download list section.Our planet is nestled in the center of two doughnut-shaped regions of powerful, dynamic radiation: the Van Allen belts, where high-energy particles are trapped by Earth’s magnetic field. Depending on incoming radiation from the sun, they can gain energetic particles. On the other hand, the belts can lose energized particles too.
We are familiar with rapid changes in weather, and the radiation belts can experience these too – particles can be depleted by a thousand-fold in mere hours. These dramatic loss events are called drop-outs, and they can happen when intense bouts of solar radiation disturb Earth’s magnetic environment. There have been many theories on how this happens, but scientists have not had the data to pinpoint which one is correct.
However, on Jan. 17, 2013, NASA's Van Allen Probes were in just the right position to watch a drop-out in progress and resolve a long-standing question as to how the lower region of the belts close to Earth loses high-energy electrons – known as ultra-relativistic electrons for their near-light speeds. During a drop-out, a certain class of powerful electromagnetic waves in the radiation belts can scatter ultra-relativistic electrons. The electrons stream down along these waves, as if they are raining into the atmosphere. A team led by Yuri Shprits of University of California in Los Angeles published a paper summarizing these findings in Nature Communications on Sept. 28, 2016.
Such information helps illustrate the complexity of Earth's magnetic surroundings. Understanding changes within the belts is crucial for protecting the satellites and astronauts travelling through this sometimes harsh space environment.Credit: NASA/Joy Ng/Martin Rother/GFZ-PotsdamMusic Credits: Translucent Nature by Anthony Phillips [PRS], Samuel Karl Bohn [PRS] from the KillerTracks catalog. Watch this video on the NASA Goddard YouTube channel.Find this image feature on NASA.gov.](/vis/a010000/a012300/a012379/LARGE_MP4-12379_Radiation_Belts_YuriPaper_large.00001_print.jpg)
Space Radiation Highlights
Go to this pageA collection of space radiation highlights featuring:NASA's Van Allen ProbesNASA's CubeSats ||
- ID: 12074 Produced Video
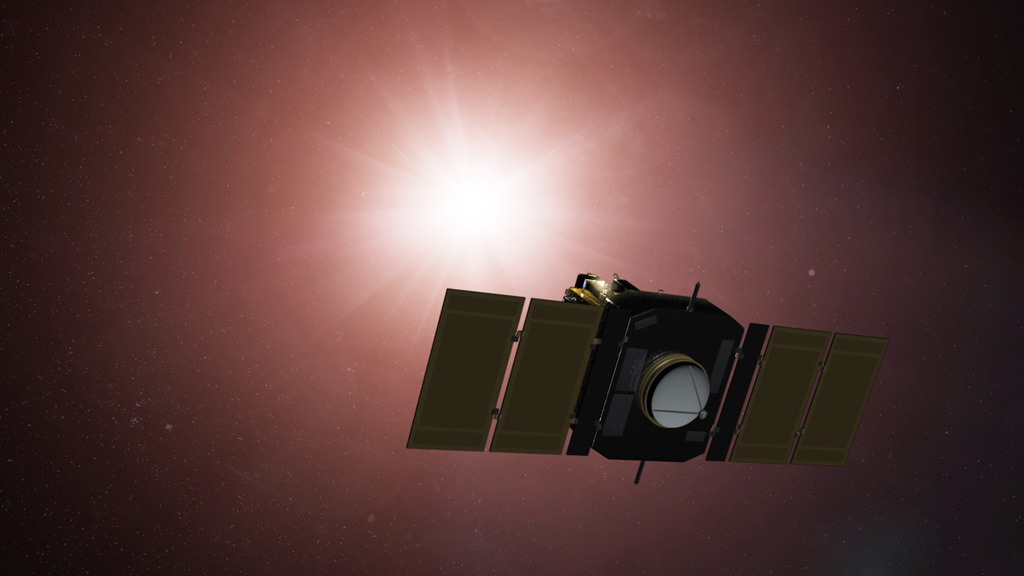
20 Years In Space
Go to this pageThe sun-observing SOHO spacecraft celebrates two decades of space-based science. || cf-1024.jpg (1024x576) [113.9 KB] || cf-1024_print.jpg (1024x576) [119.4 KB] || cf-1024_searchweb.png (320x180) [70.6 KB] || cf-1024_web.png (320x180) [70.6 KB] || cf-1024_thm.png (80x40) [16.1 KB] ||
- ID: 12052 Produced Video
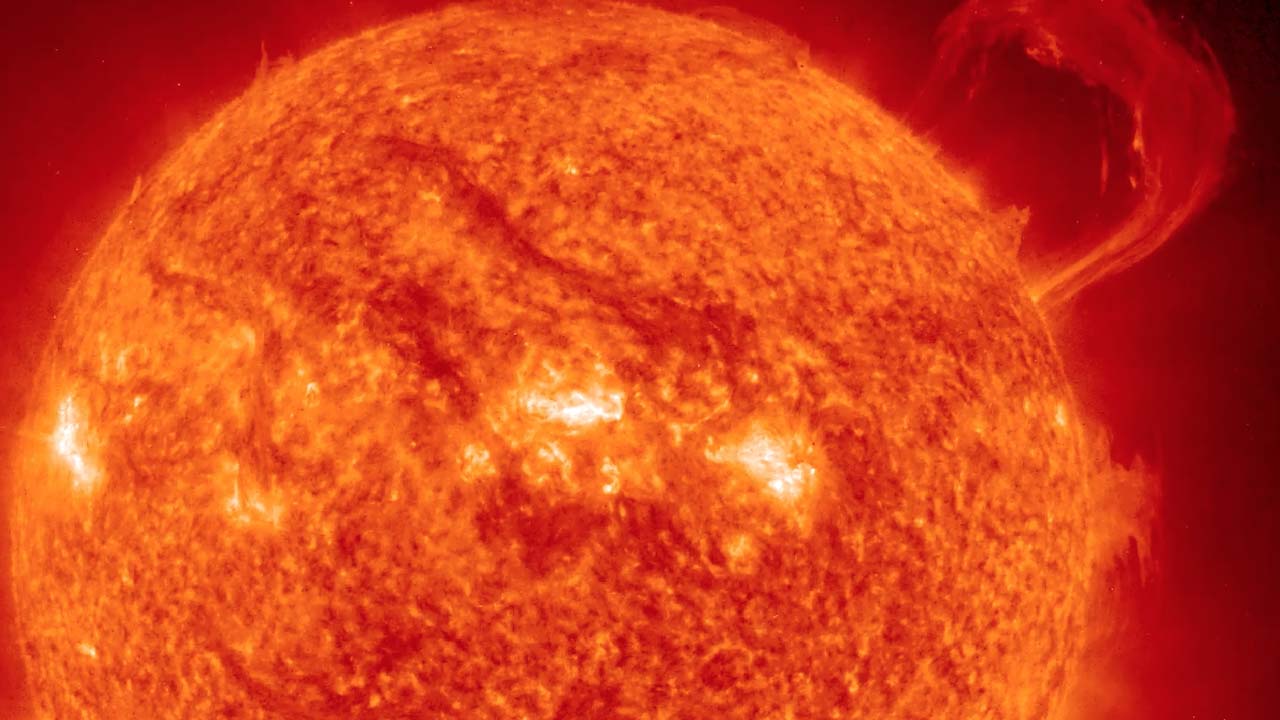
SOHO Celebrates 20 Years of Space-based Science
Go to this pageDr. Joe Gurman of NASA's Goddard Space Flight Center provides commentary on selected shots from SOHO's 20 years in space.Watch this video on YouTube || SOHO20thumb.jpg (1280x720) [108.1 KB] || SOHO20thumb_searchweb.png (320x180) [119.7 KB] || SOHO20thumb_thm.png (80x40) [19.1 KB] || APPLE_TV_12952_SOHO_20th_anniversary_ws_appletv.m4v (1280x720) [199.6 MB] || YOUTUBE_HQ_12952_SOHO_20th_anniversary_ws_youtube_hq.mov (1920x1080) [2.5 GB] || 12952_SOHO_20th_anniversary_ws-H264_Best_1920x1080_59.94.mov (1920x1080) [4.0 GB] || YOUTUBE_HQ_12952_SOHO_20th_anniversary_ws_youtube_hq.webm (1920x1080) [45.1 MB] || SOHO20.en_US.srt [7.6 KB] || 12952_SOHO_20th_anniversary_ws.key [200.0 MB] || 12952_SOHO_20th_anniversary_ws.pptx [199.8 MB] || 12952_SOHO_20th_anniversary_ws_lowres.mp4 (480x272) [52.9 MB] || NASA_PODCAST_12952_SOHO_20th_anniversary_ws_ipod_sm.mp4 (320x240) [67.5 MB] ||
- ID: 10785 Produced Video
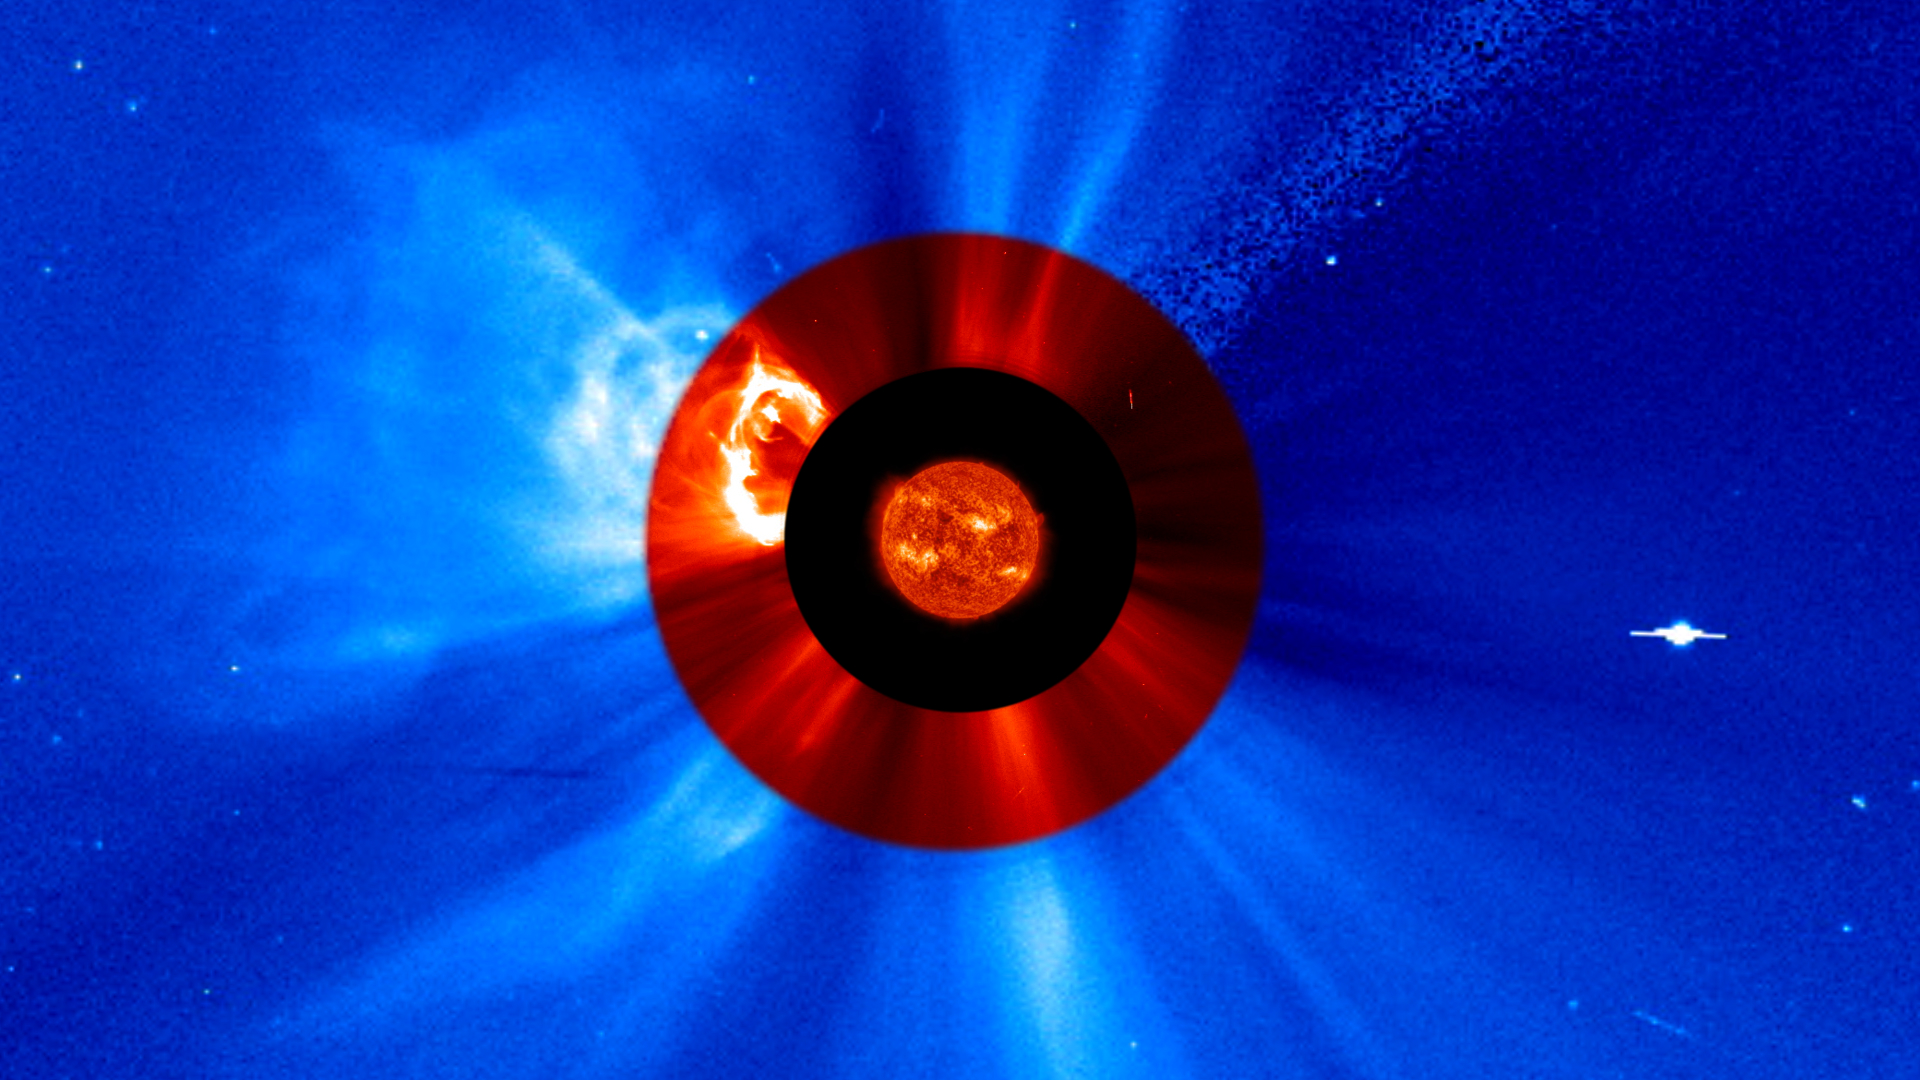
NASA's Heliophysics Fleet Captures May 1, 2013 Prominence Eruption and CME
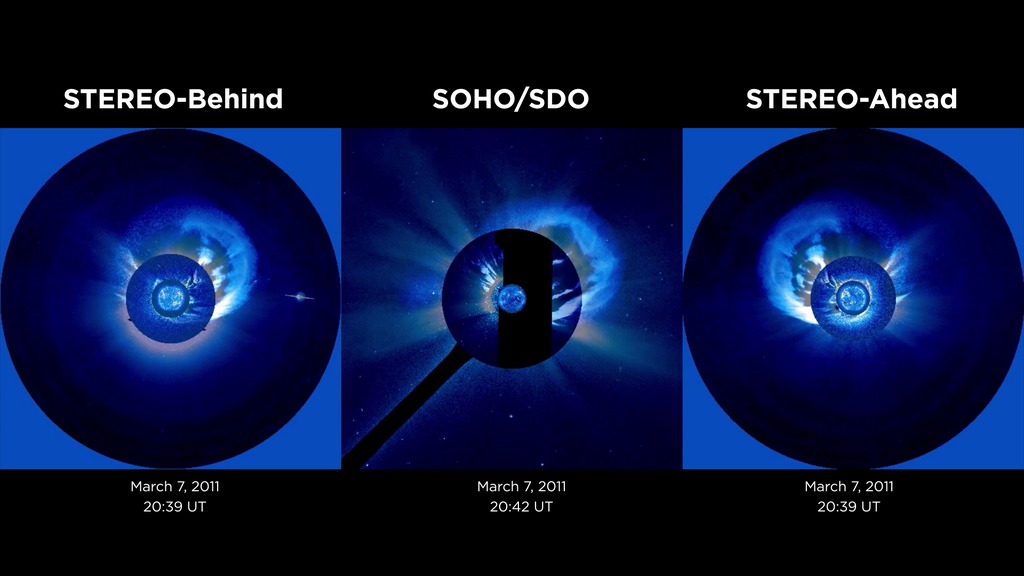
Go to this pageOn May 1, 2013, NASA's Solar Dynamics Observatory (SDO) watched as an active region just around the East limb (left edge) of the sun erupted with a huge cloud of solar material—a heated, charged gas called plasma. This eruption, called a coronal mass ejection, or CME, sent the plasma streaming out through the solar system. Viewing the sun in the extreme ultraviolet wavelength of 304 angstroms, SDO provided a beautiful view of the initial arc as it left the solar surface. Such eruptions soon leave SDO's field of view, but other satellites in NASA's Heliophysics fleet can pick them up, tracking such space weather to determine if they are headed toward Earth or spacecraft near other planets. With advance warning, many space assets can be put into safe mode and protect themselves from the effects of such particle radiation.In addition to the images captured by SDO, the May 1, 2013 CME was also observed by the ESA/NASA Solar and Heliospheric Observatory (SOHO). SOHO houses two overlapping coronagraphs—telescopes where the bright sun is blocked by a disk so it doesn't overpower the fainter solar atmosphere—and they both saw the CME continue outward. The LASCO C2 coronagraph shows the region out to about 2.5 million miles. The LASCO C3 coronagraph expands even farther out to around 13.5 million miles. Both of these instruments show the CME as it expands and becomes fainter on its trip away from the sun.NASA's Solar Terrestrial Relations Observatory (STEREO) Ahead satellite saw the eruption from a very different angle. It, along with its twin STEREO Behind, is orbiting at a similar distance as Earth. STEREO-A orbits slightly faster than Earth and STEREO-B orbits slightly slower. Currently, STEREO-A is more than two-thirds of the way to being directly behind the sun, and has a view of the far side of the sun. From this perspective, the CME came off the right side of the sun. STEREO has an extreme ultraviolet camera similar to SDO's, but it also has coronagraphs like SOHO. As a result, using its two inner coronagraphs, it was able to track the CME from the solar surface out to 6.3 million miles.Working together, such missions provide excellent coverage of a wide variety of solar events, a wealth of scientific data—and lots of beautiful imagery.Watch this video on YouTube. ||
- ID: 10421 Produced Video
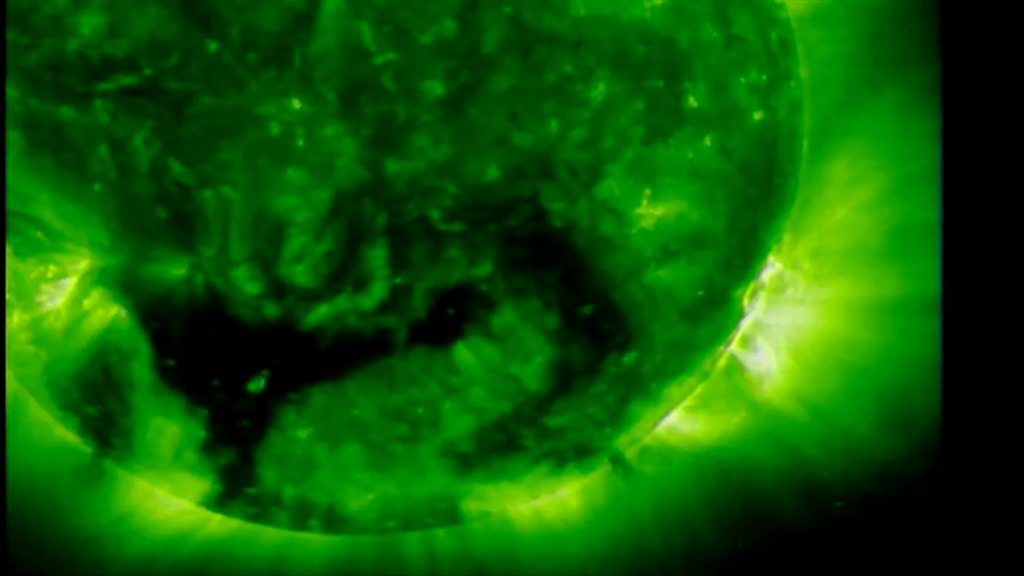
SOHO/TRACE Intro
Go to this pageOn April 3, 2009, countries from around the world participated in the '100 Hours of Astronomy' webcast to celebrate the International Year of Astronomy. This movie was used to introduce the SOHO/TRACE segment. Alex Young and Dawn Meyers, NASA scientists, describe how both SOHO and TRACE view the sun in their own unique way. ||
- ID: 13195 Produced Video
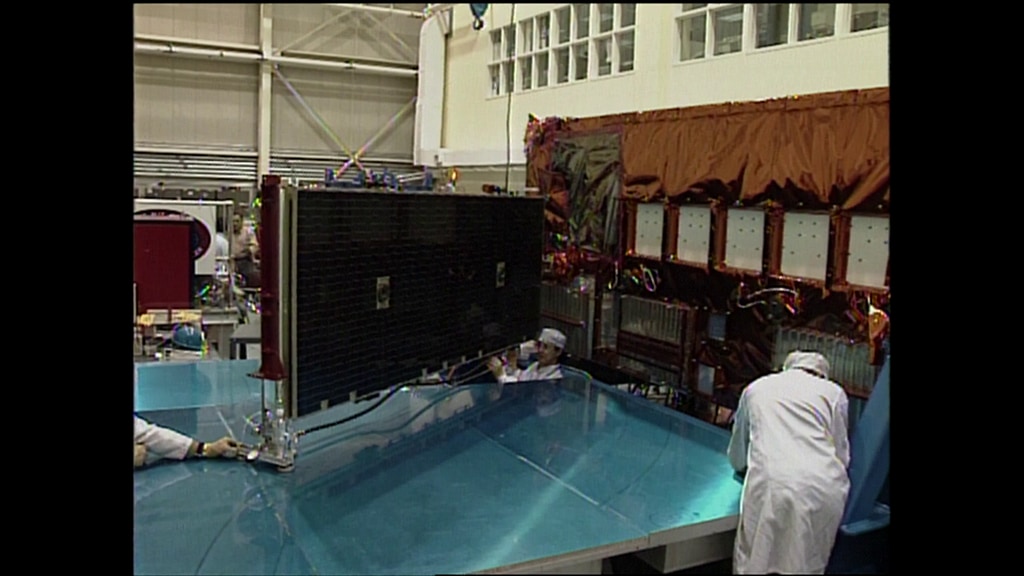
Goddard Space Flight Center Archival Footage
Go to this pageFootage of cleanroom work, scientists on SOHO, XTE and the STOCC || YOUTUBE_720_GSFC_40_anniversary_b-roll_youtube_720.00361_print.jpg (1024x576) [96.5 KB] || YOUTUBE_720_GSFC_40_anniversary_b-roll_youtube_720.00361_searchweb.png (320x180) [82.5 KB] || YOUTUBE_720_GSFC_40_anniversary_b-roll_youtube_720.00361_thm.png (80x40) [5.8 KB] || GSFC_40_anniversary_b-roll.mov (1280x720) [7.6 GB] || YOUTUBE_720_GSFC_40_anniversary_b-roll_youtube_720.mp4 (1280x720) [1.0 GB] || GSFC_40_anniversary_b-roll.webm [0 bytes] ||
SOHO Comet Hunter
- ID: 14552
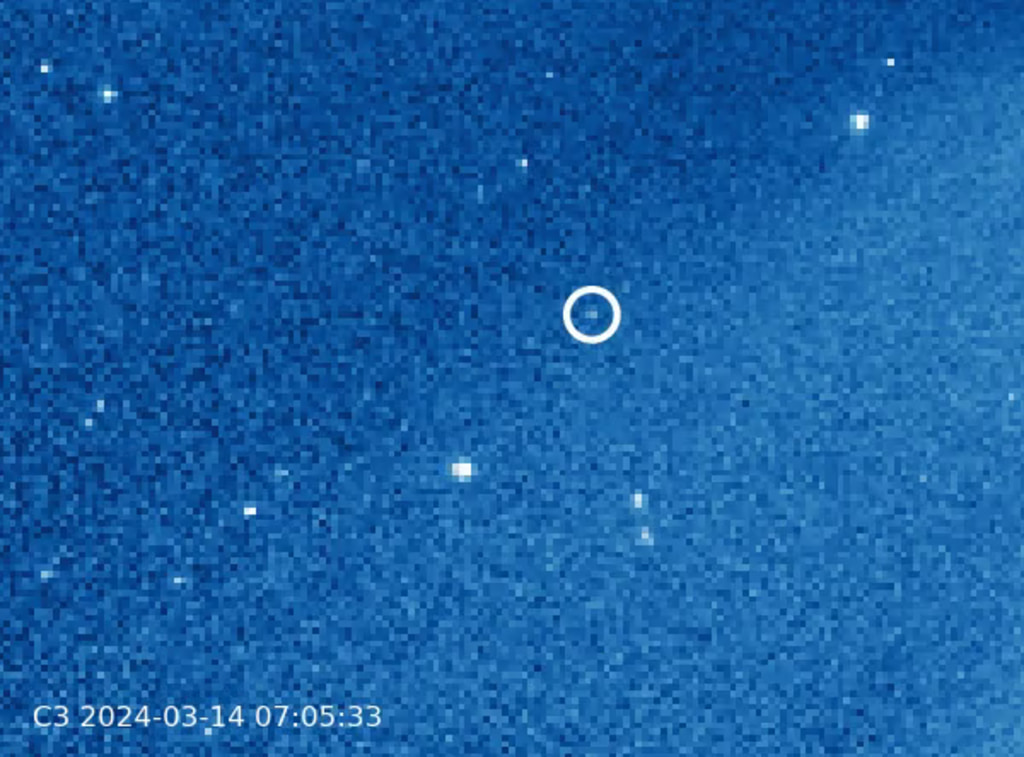 Produced Video
 - ID: 13661
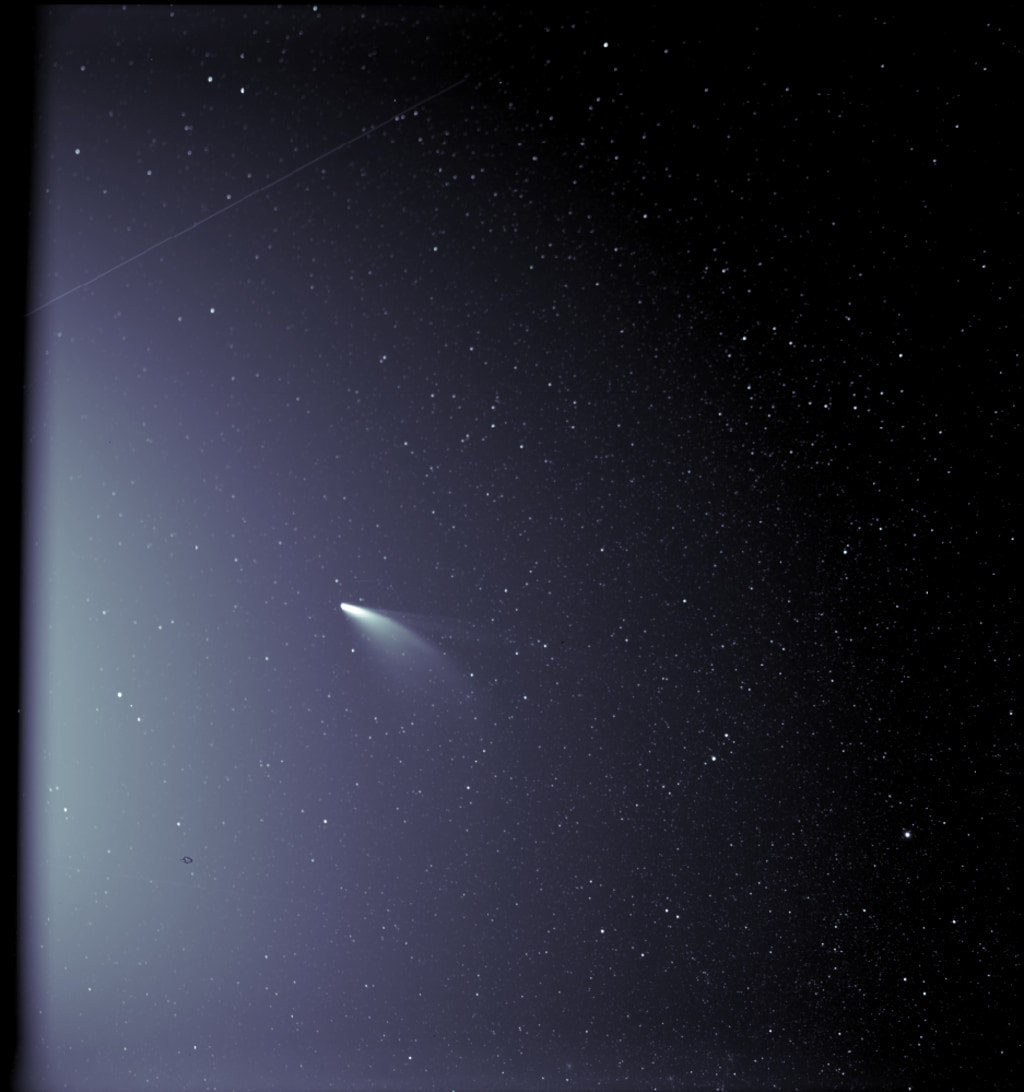 Produced Video
 - ID: 13623
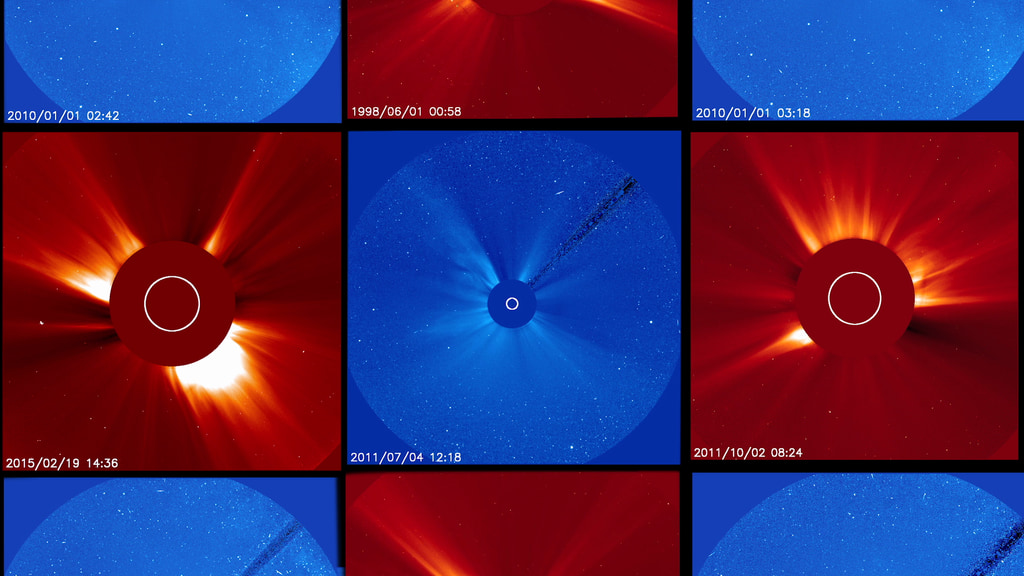 Produced Video
 - ID: 13622
 Produced Video
 - ID: 12900
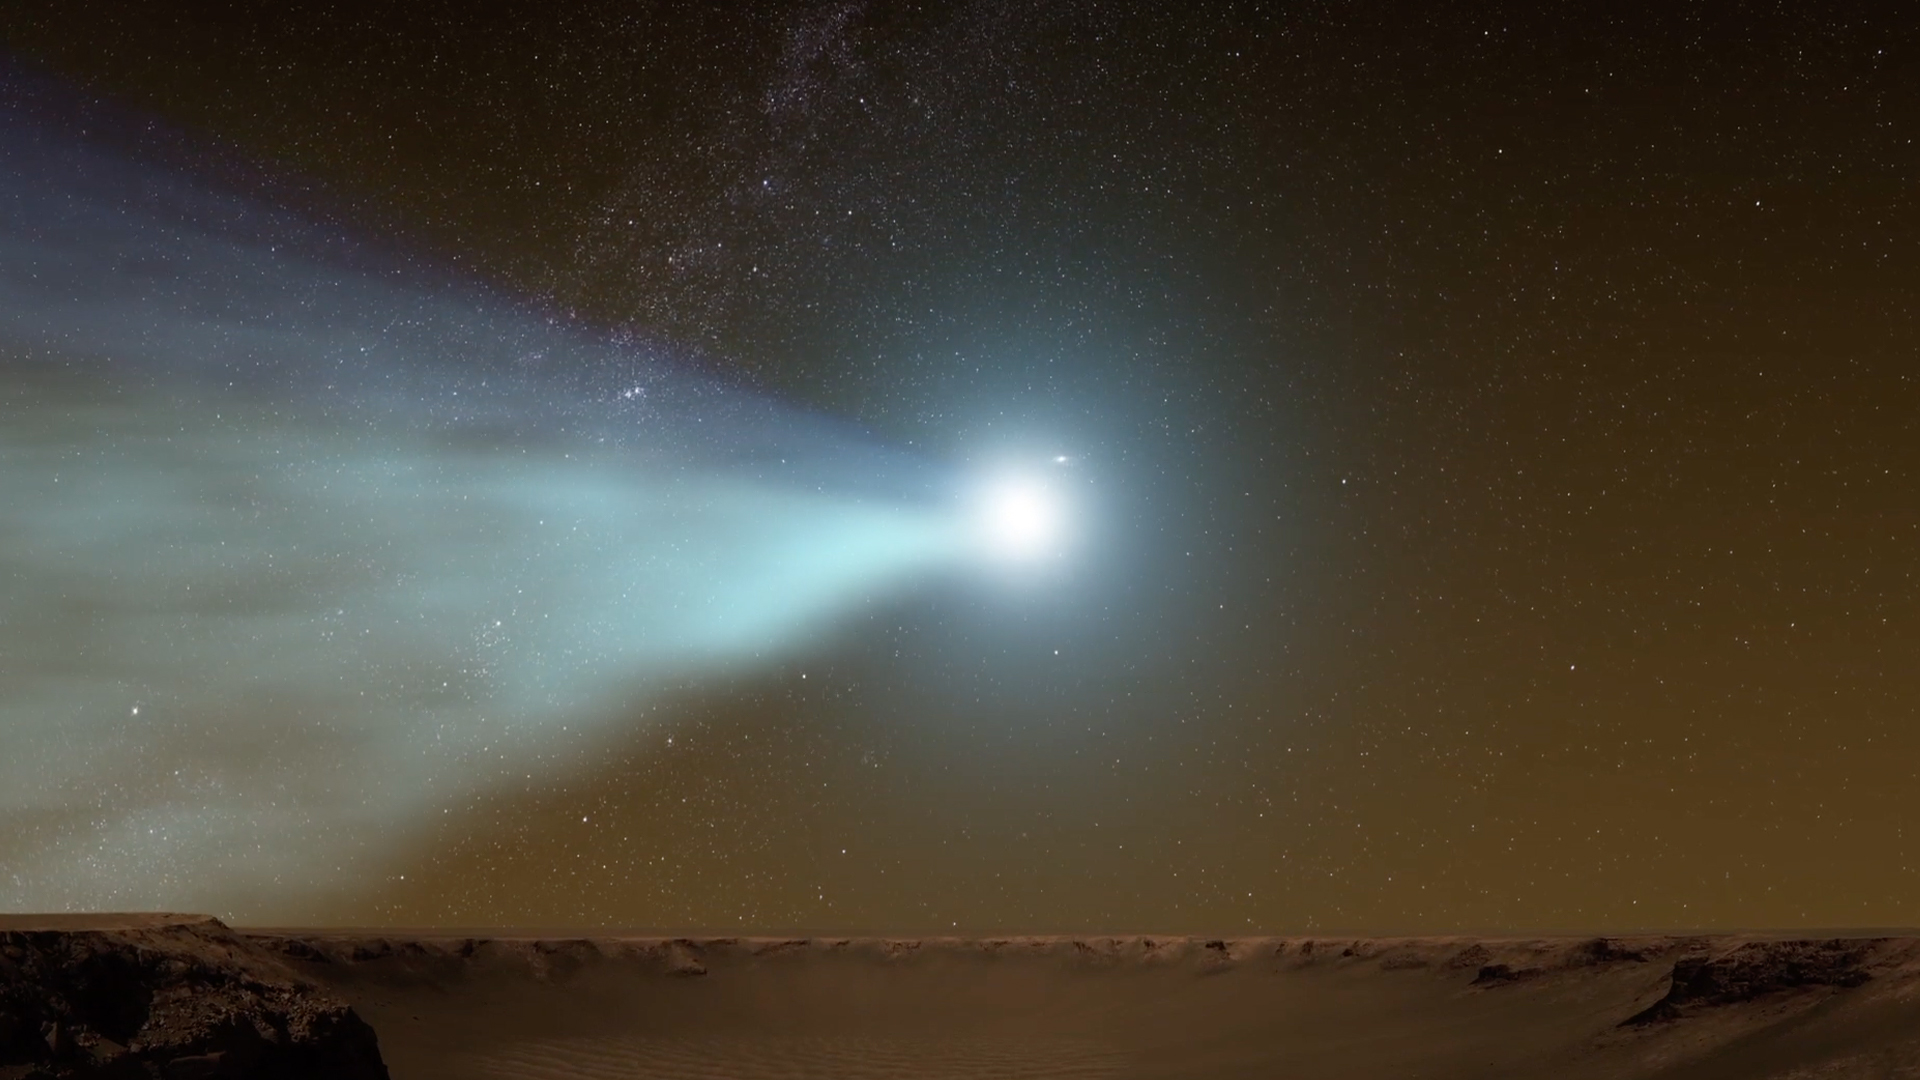 Produced Video
 - ID: 11935
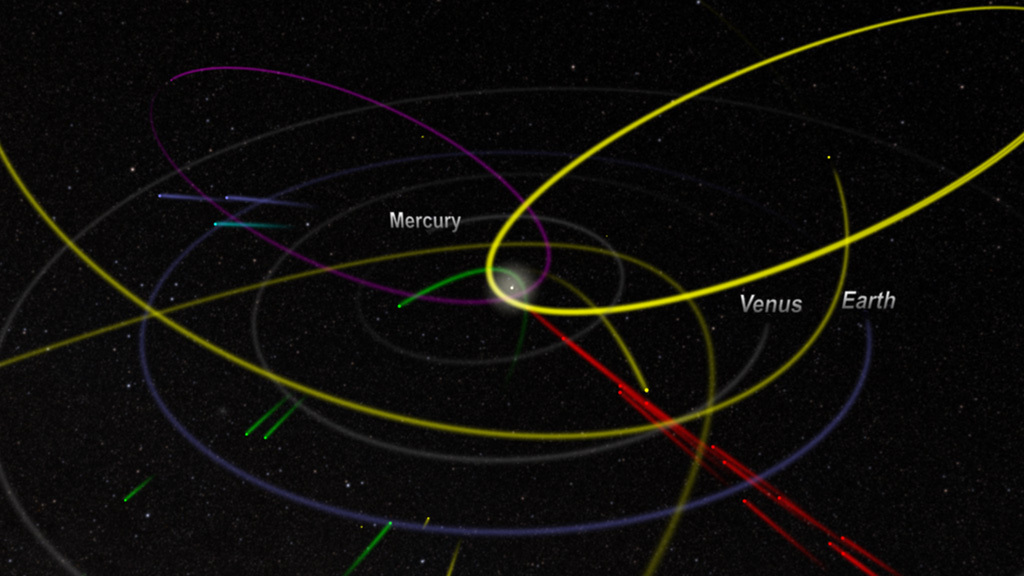 Produced Video
 - ID: 12006
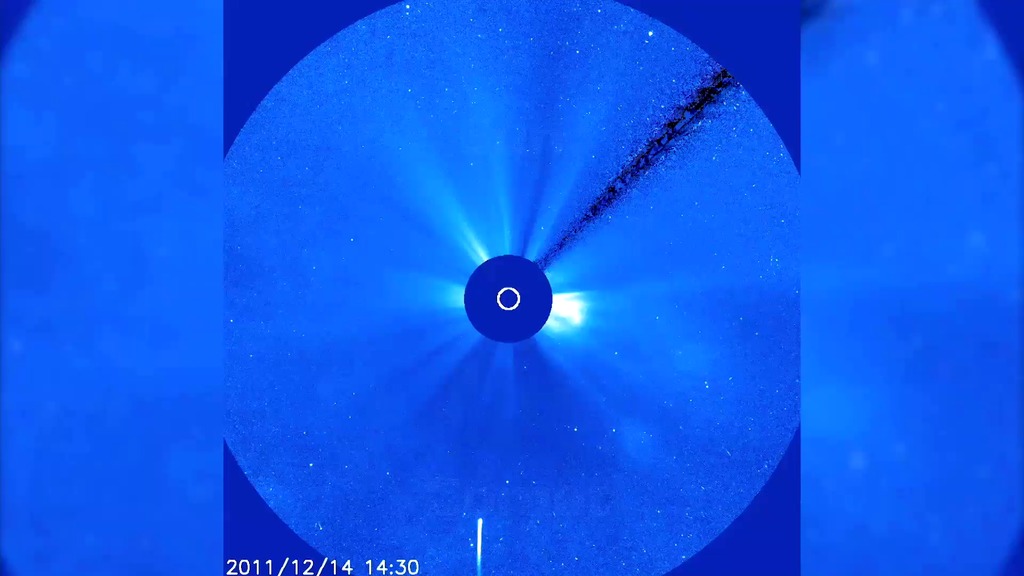
- ID: 11975
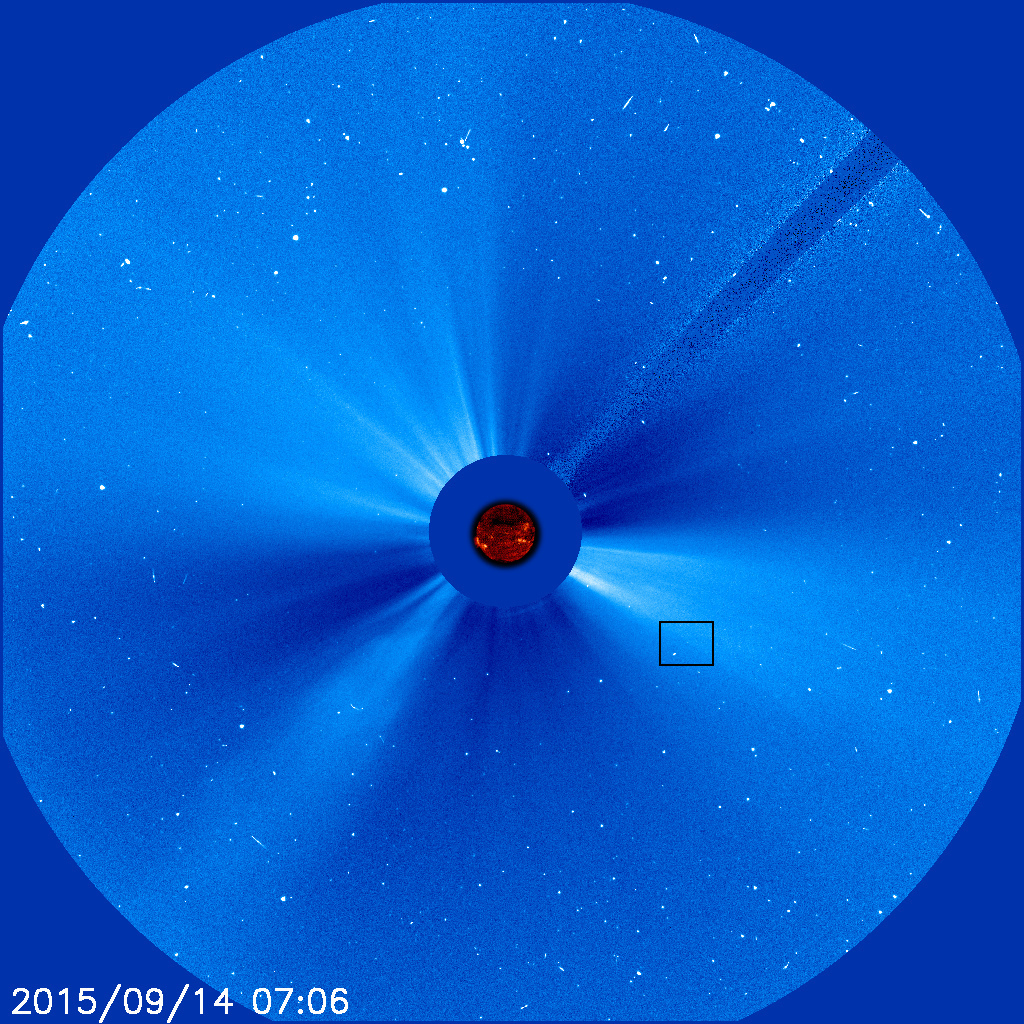 Produced Video
 - ID: 4342
 Visualization
 - ID: 4343
 Visualization
 - ID: 4344
 Visualization
 - ID: 11416
 Produced Video
 - ID: 11434
 Produced Video
 - ID: 11422
 Section
- ID: 11156
 Produced Video
 - ID: 11145
 Produced Video
 - ID: 3929
 Visualization
SOHO CME Imagery
- ID: 11811
 Produced Video
 - ID: 11558
 Produced Video
 - ID: 30072
 Hyperwall Visual
 - ID: 11387
 Produced Video
 - ID: 11298
 Produced Video
 - ID: 11257
 Produced Video
 - ID: 11246
 Produced Video
 - ID: 11225
 Produced Video
 - ID: 11207
 Produced Video
 - ID: 11201
 Produced Video
 - ID: 11078
 Produced Video
 - ID: 11095
 Produced Video
 - ID: 10899
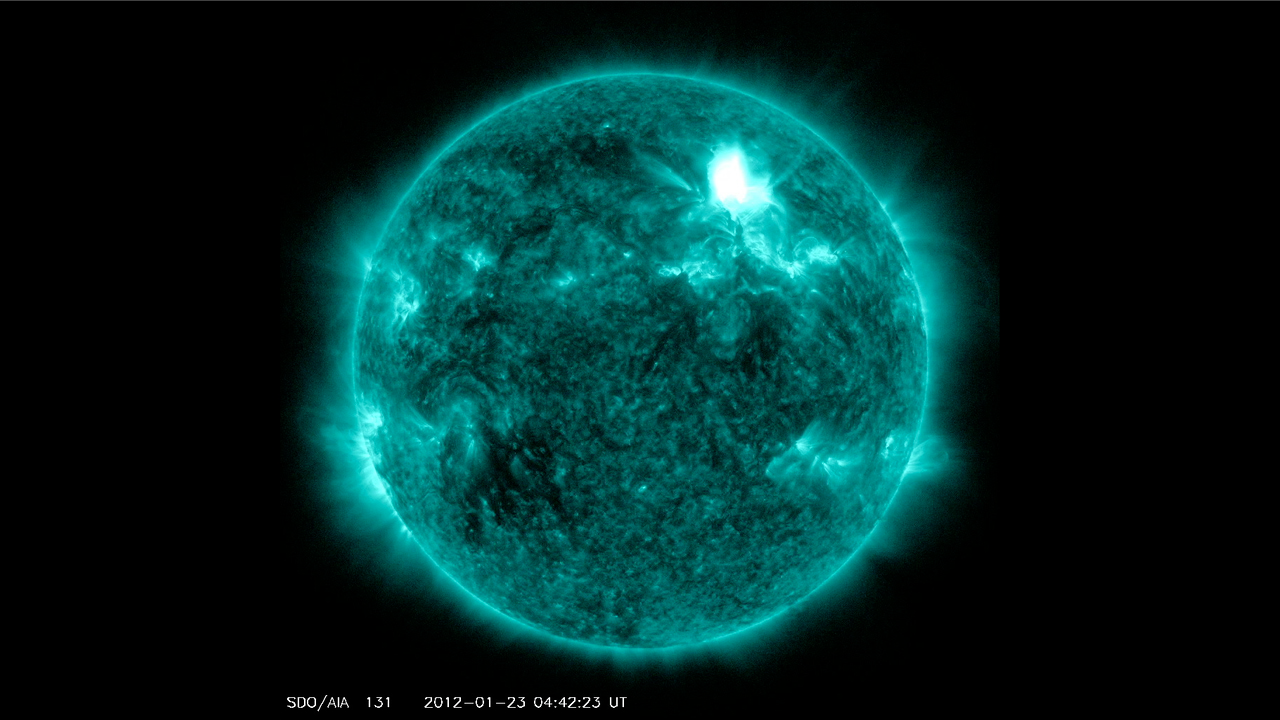 Produced Video
 - ID: 3740
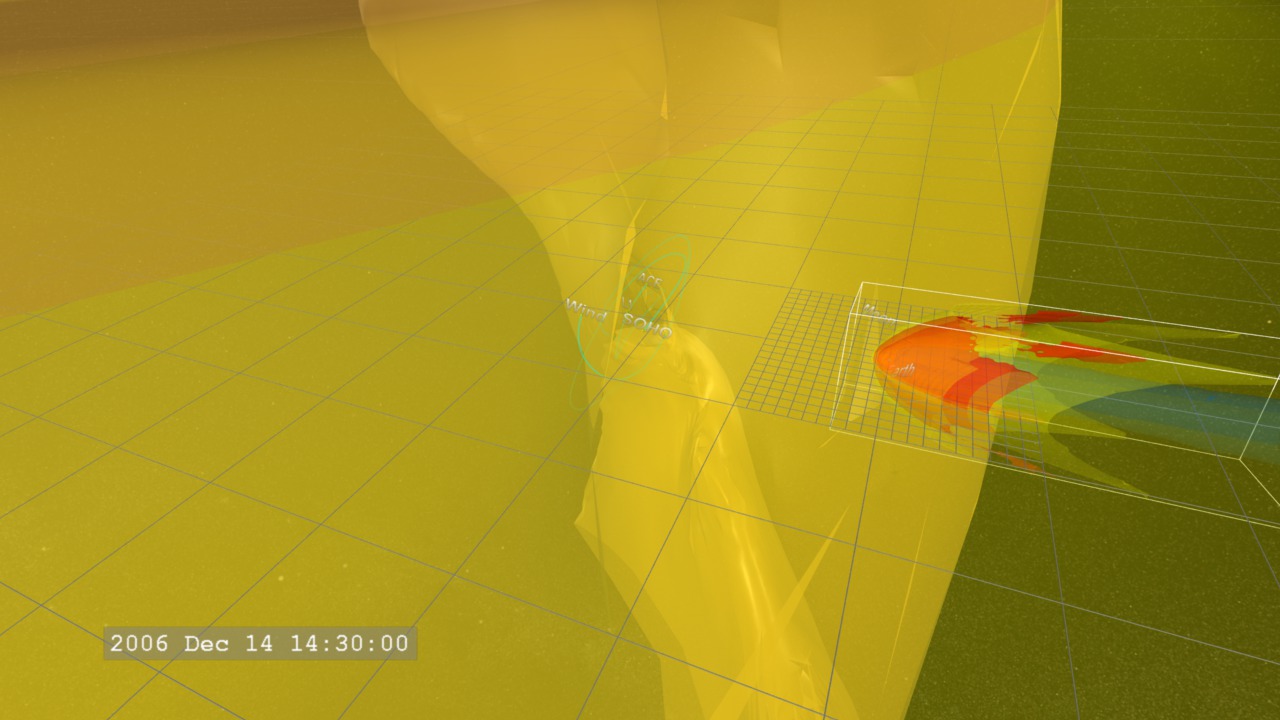 Visualization
 - ID: 3431
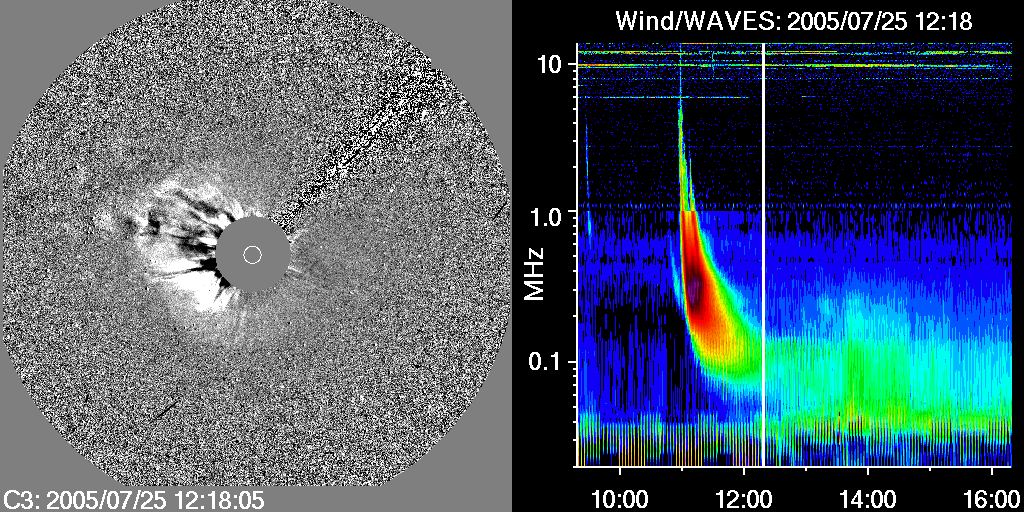 Visualization
 - ID: 3432
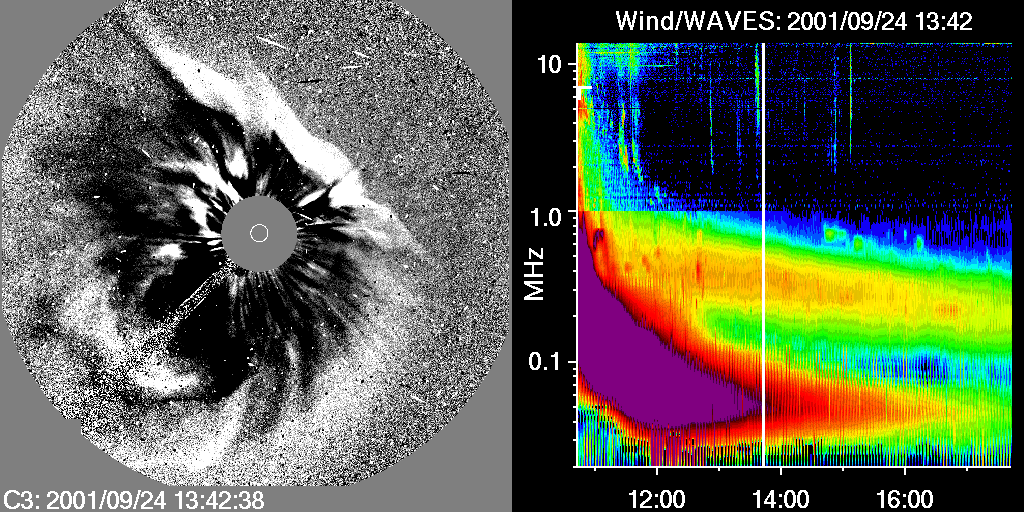 Visualization
 - ID: 3159
 Visualization
 - ID: 2950
 Visualization
 - ID: 2958
 Visualization
 - ID: 2936
 Visualization
SOHO Solar Flare Imagery
- ID: 12451
 Produced Video
 - ID: 11868
 Produced Video
 - ID: 11651
 Produced Video
 - ID: 11493
 Produced Video
 - ID: 11285
 Produced Video
 - ID: 11262
 Produced Video
 - ID: 11043
 Produced Video
 - ID: 10925
 Produced Video
 - ID: 10109
 Produced Video
 - ID: 3755
 Visualization
 - ID: 3691
- ID: 3694
- ID: 3160
 Visualization
 - ID: 2921
 Visualization
 - ID: 2922
 Visualization
 - ID: 2917
- ID: 2918
- ID: 2750
 Visualization
 - ID: 2509
- ID: 2511
- ID: 2553
- ID: 2495
 Visualization
 - ID: 2496
 Visualization
 - ID: 2460
 Visualization
 - ID: 2461
- ID: 2462
- ID: 2463
- ID: 2402

- ID: 2403
- ID: 2404
SOHO Sunspot Imagery
- ID: 3505 Visualization
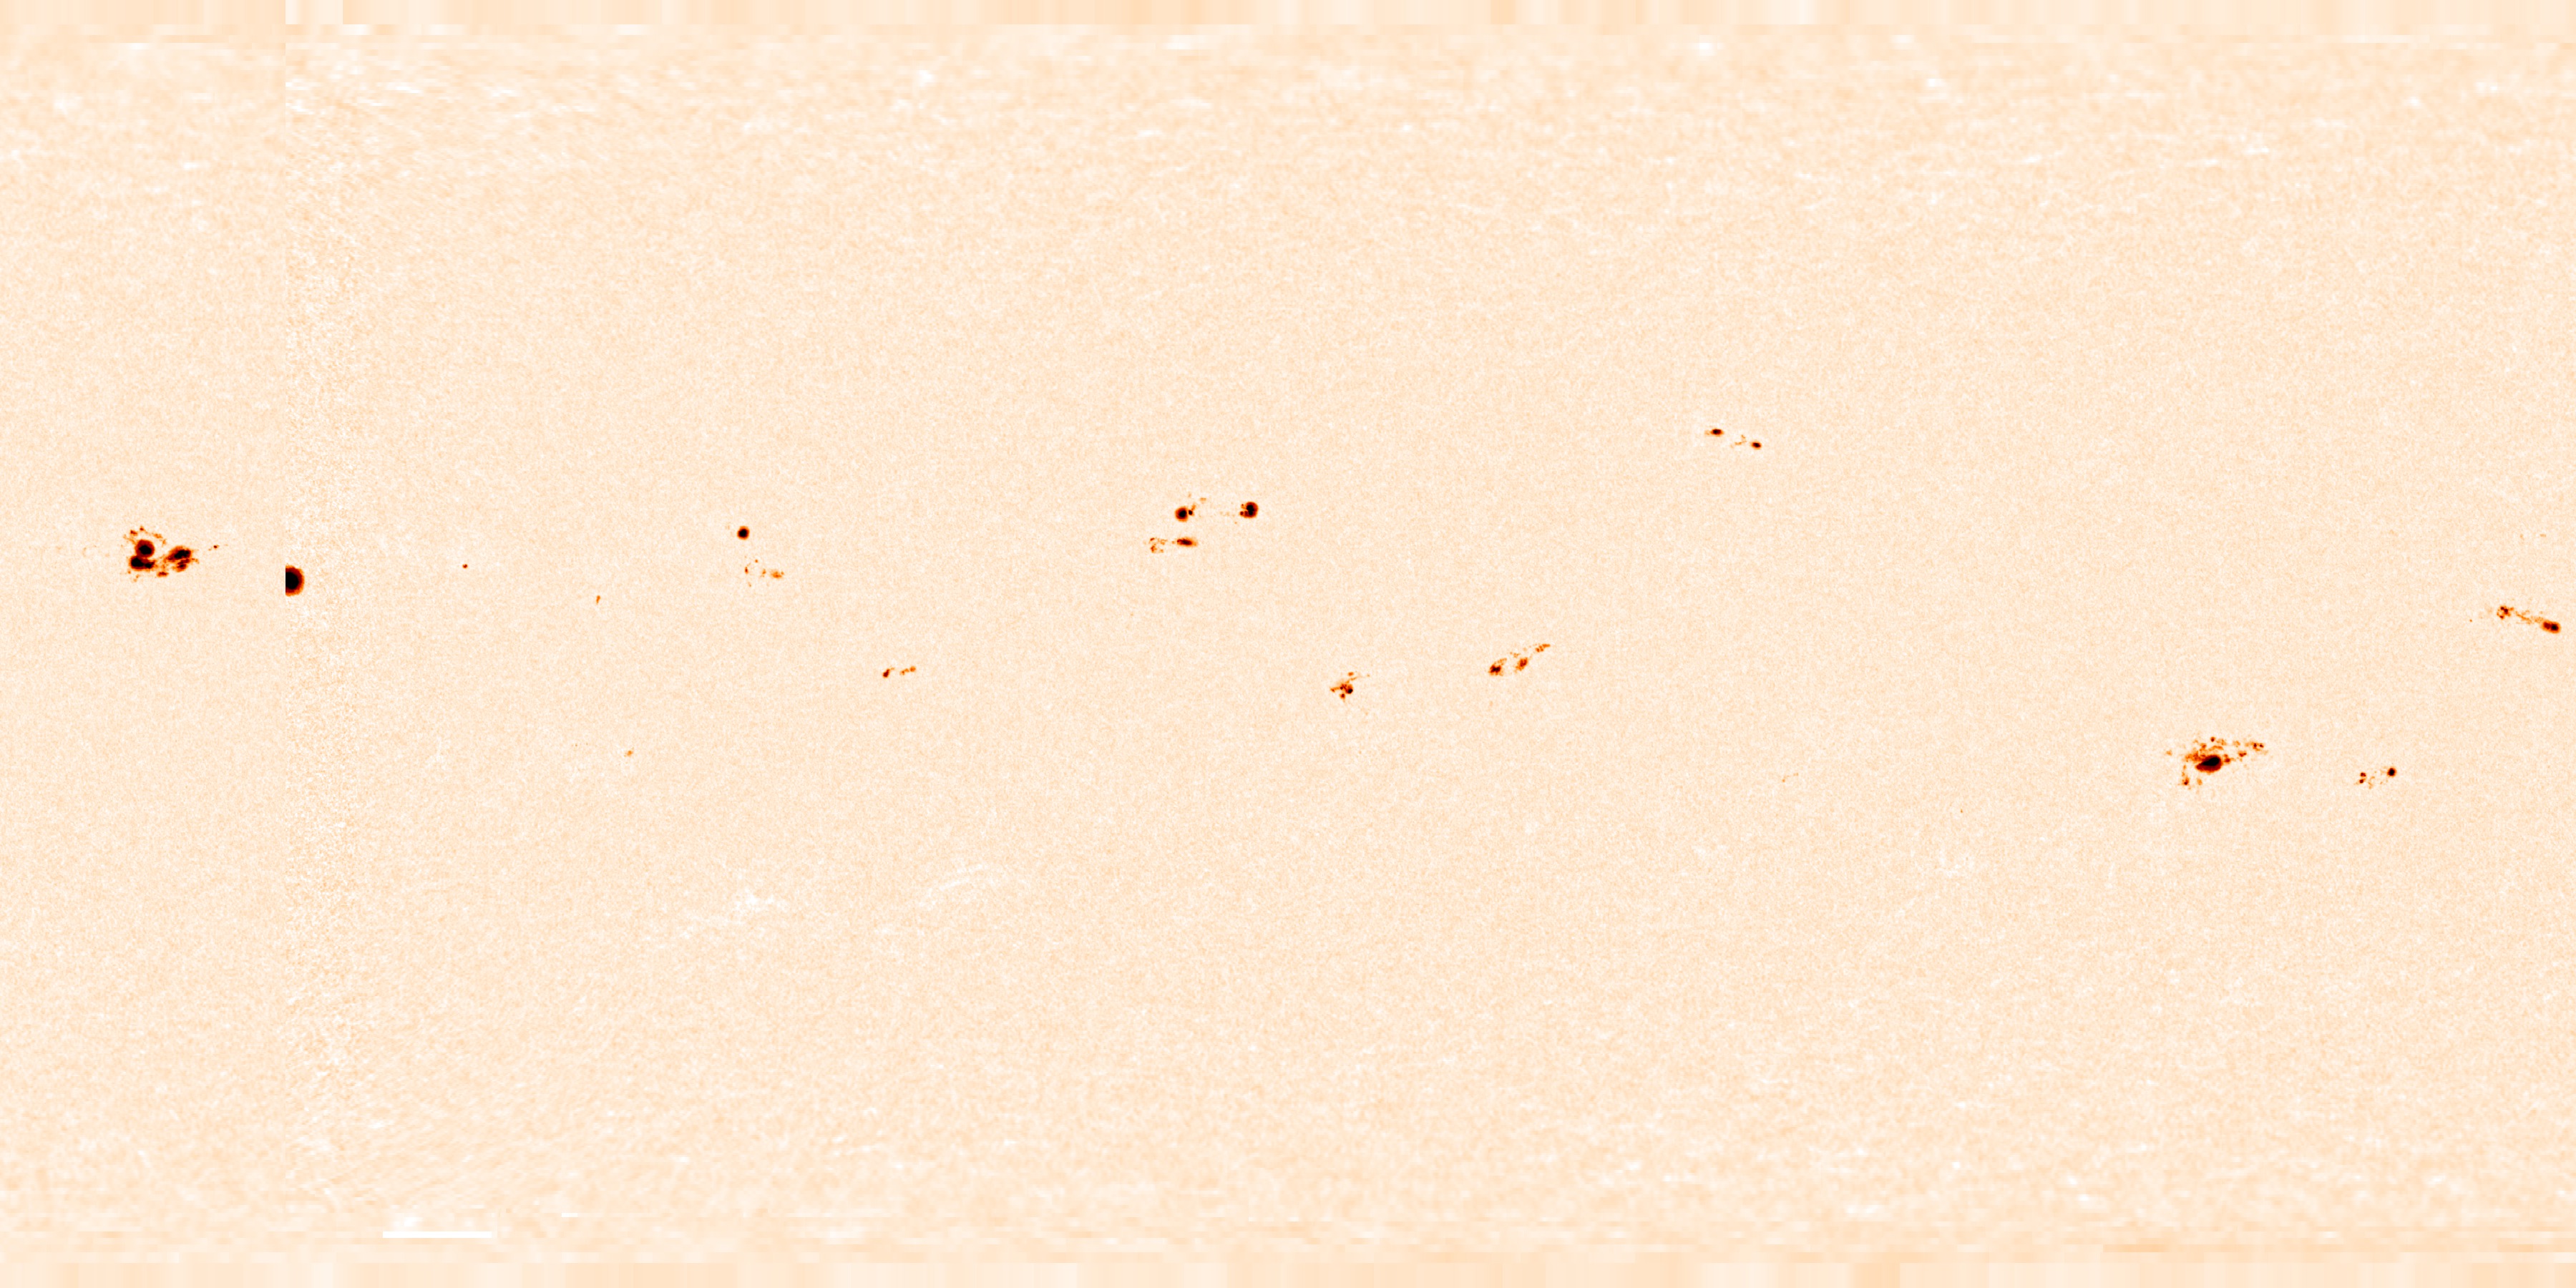
Solar Cycle 23: Minimum-Maximum-Minimum Synoptic Sequence
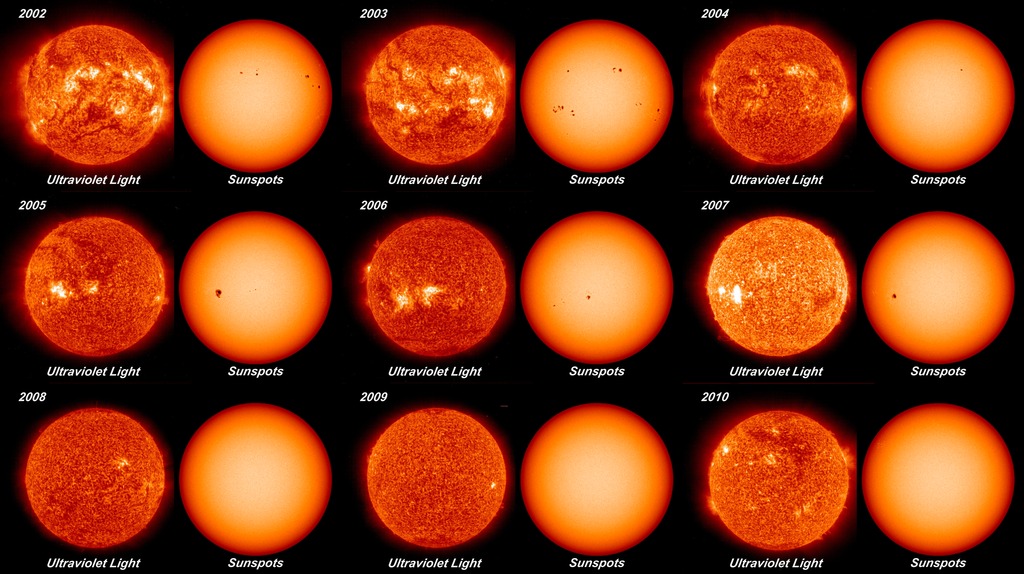
Go to this pageThis is a sequence of solar synoptic maps covering Solar Cycle 23.The SOHO spacecraft began collecting this data in May of 1996, near the beginning (minimum) of the sunspot cycle. The sequence is projected in cylindrical-equidistant (CED) coordinates suitable for reprojection on spheres for animation or visualization purposes. These images are not suitable for scientific analysis.The original data were collected in FITS format from the SOHO/MDI archive, one image for each Carrington Rotation, which are 27.2753 days long.Solar minimum for Cycle 23 was in May 1996 (Carrington Rotation #1909), solar maximum around March 2000 (Carrington Rotation #1960), with a return to minimum about October 2008 (Carrington Rotation #2075). There are two gaps in the sequence, totalling four rotations, at Carrington rotations #1938, 1939, 1940, 1941, and 1998. These images are missing from the sequence due to SOHO being offline. Gaps in the data coverage for individual maps (occasional day outages or poor coverage near the poles of the Sun) were filled using data accumulated from previous maps.IMPORTANT NOTE: These images are for visualization purposes only. They are not suitable for scientific analysis. ||
- ID: 20070 Animation
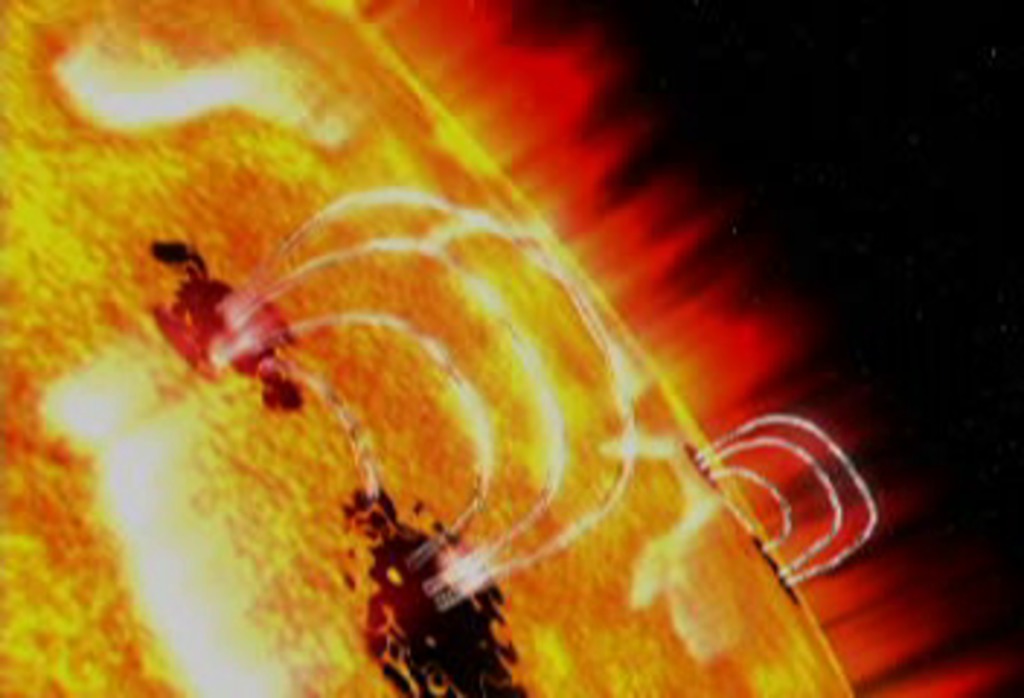
Under the Sunspots
Go to this pageNew studies show that the Sun's active regions — areas of intense eruptions — are formed from many small magnetic structures (white loops) that rise from deep within the interior, then pierce the surface to form sunspots (dark areas). These structures appear as giant arches when electrified gas (plasma) passes through their magnetic fields. ||
- ID: 10073 Produced Video
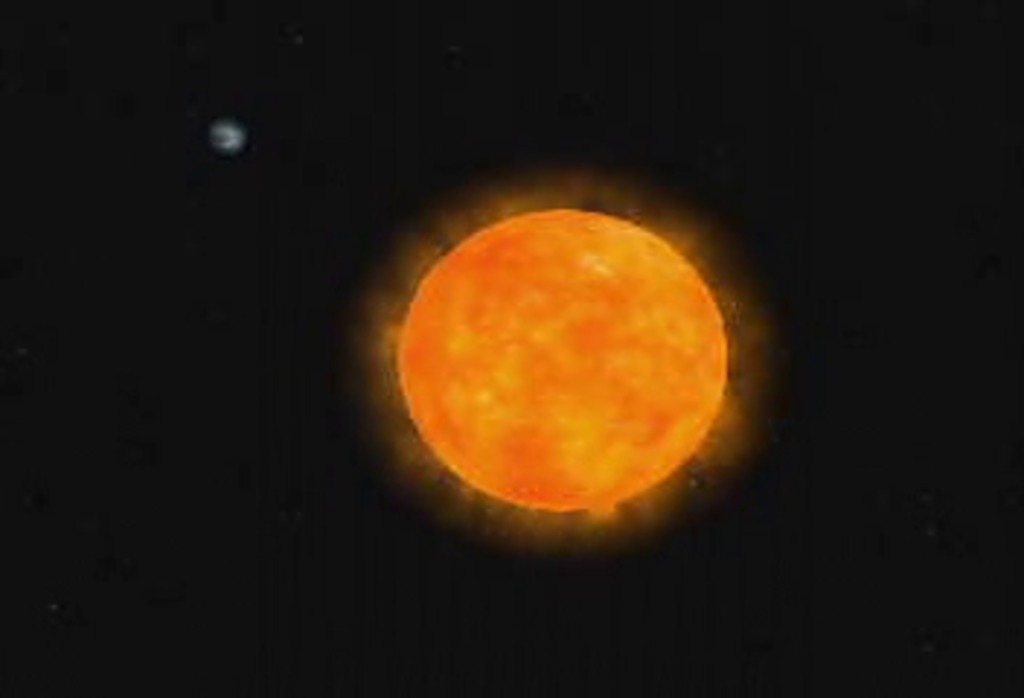
MDI Sunspots
Go to this pageAnimation of an active region on far side rotating to near side, where a coronal mass ejection occurs. || Sunspots are associated with active regions which can launch coronal mass ejections. || MDI_print.jpg (1024x698) [37.6 KB] || MDI_pre.00002_print.jpg (1024x698) [31.4 KB] || MDI_thm.png (80x40) [3.4 KB] || MDI_pre.jpg (320x238) [4.3 KB] || MDI_pre_searchweb.jpg (320x180) [29.9 KB] || MDI.webmhd.webm (960x540) [909.3 KB] || MDI.mpeg (352x240) [5.9 MB] ||
- ID: 2287 Visualization
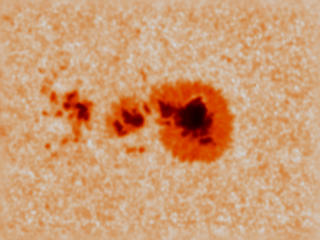
The Spinning Sunspot
Go to this pageZoom-in to the sunspot group and watch it rotate || a002287.00005_print.png (720x480) [413.4 KB] || spinspot2_pre.jpg (320x240) [5.6 KB] || a002287.webmhd.webm (960x540) [4.9 MB] || a002287.dv (720x480) [60.1 MB] || spinspot2.mpg (320x240) [2.4 MB] || Full sun view with SOHO-MDI data || spinningspot0001.jpg (2560x1920) [351.5 KB] || spinningspot0001_web.jpg (320x240) [7.3 KB] || spinningspot0001.tif (2560x1920) [2.1 MB] ||
- ID: 2304 Visualization
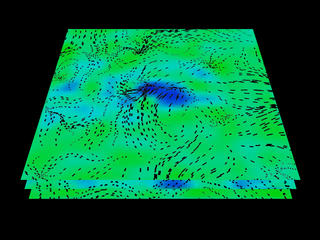
Under the Rotating Sunspot (Layers 0, 1, 2)
Go to this pageUsing the SOHO Michelson Doppler Interferometer (MDI), scientists can use a process called Time-Distance helioseismology to determine temperatures and fluid flows under the surface of the Sun. ||
- ID: 2314 Visualization
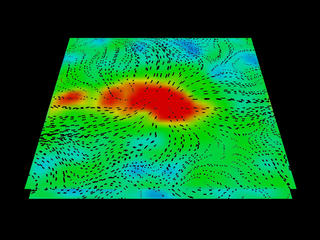
Temperature and Flows under a Sunspot (Layers 0, 2, 4)
Go to this pageUsing the SOHO Michelson Doppler Interferometer (MDI), scientists can use a process called Time-Distance helioseismology to determine temperatures and fluid flows under the surface of the Sun. ||
- ID: 2232 Visualization
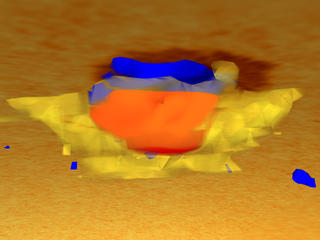
SOHO/MDI Investigates Solar Flows Under Sunspots
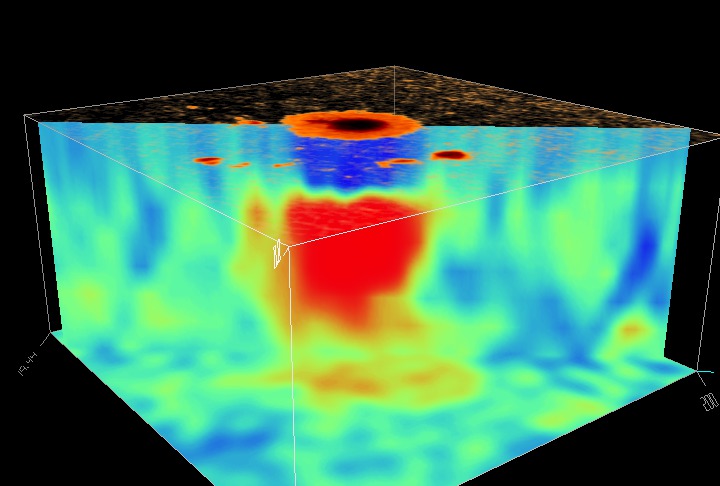
Go to this pageSOHO/MDI performs a 'sonogram' of the sun, revealing the subsurface temperature profile around a sunspot. Red isosurfaces denote regions where the sound speed (and temperature) are higher than average while blue isosurfaces directly under the spot illustrate where the sound speed (and temperature) are lower than average. ||
SOHO Views A Solar Eclipse
- ID: 12704 Produced Video
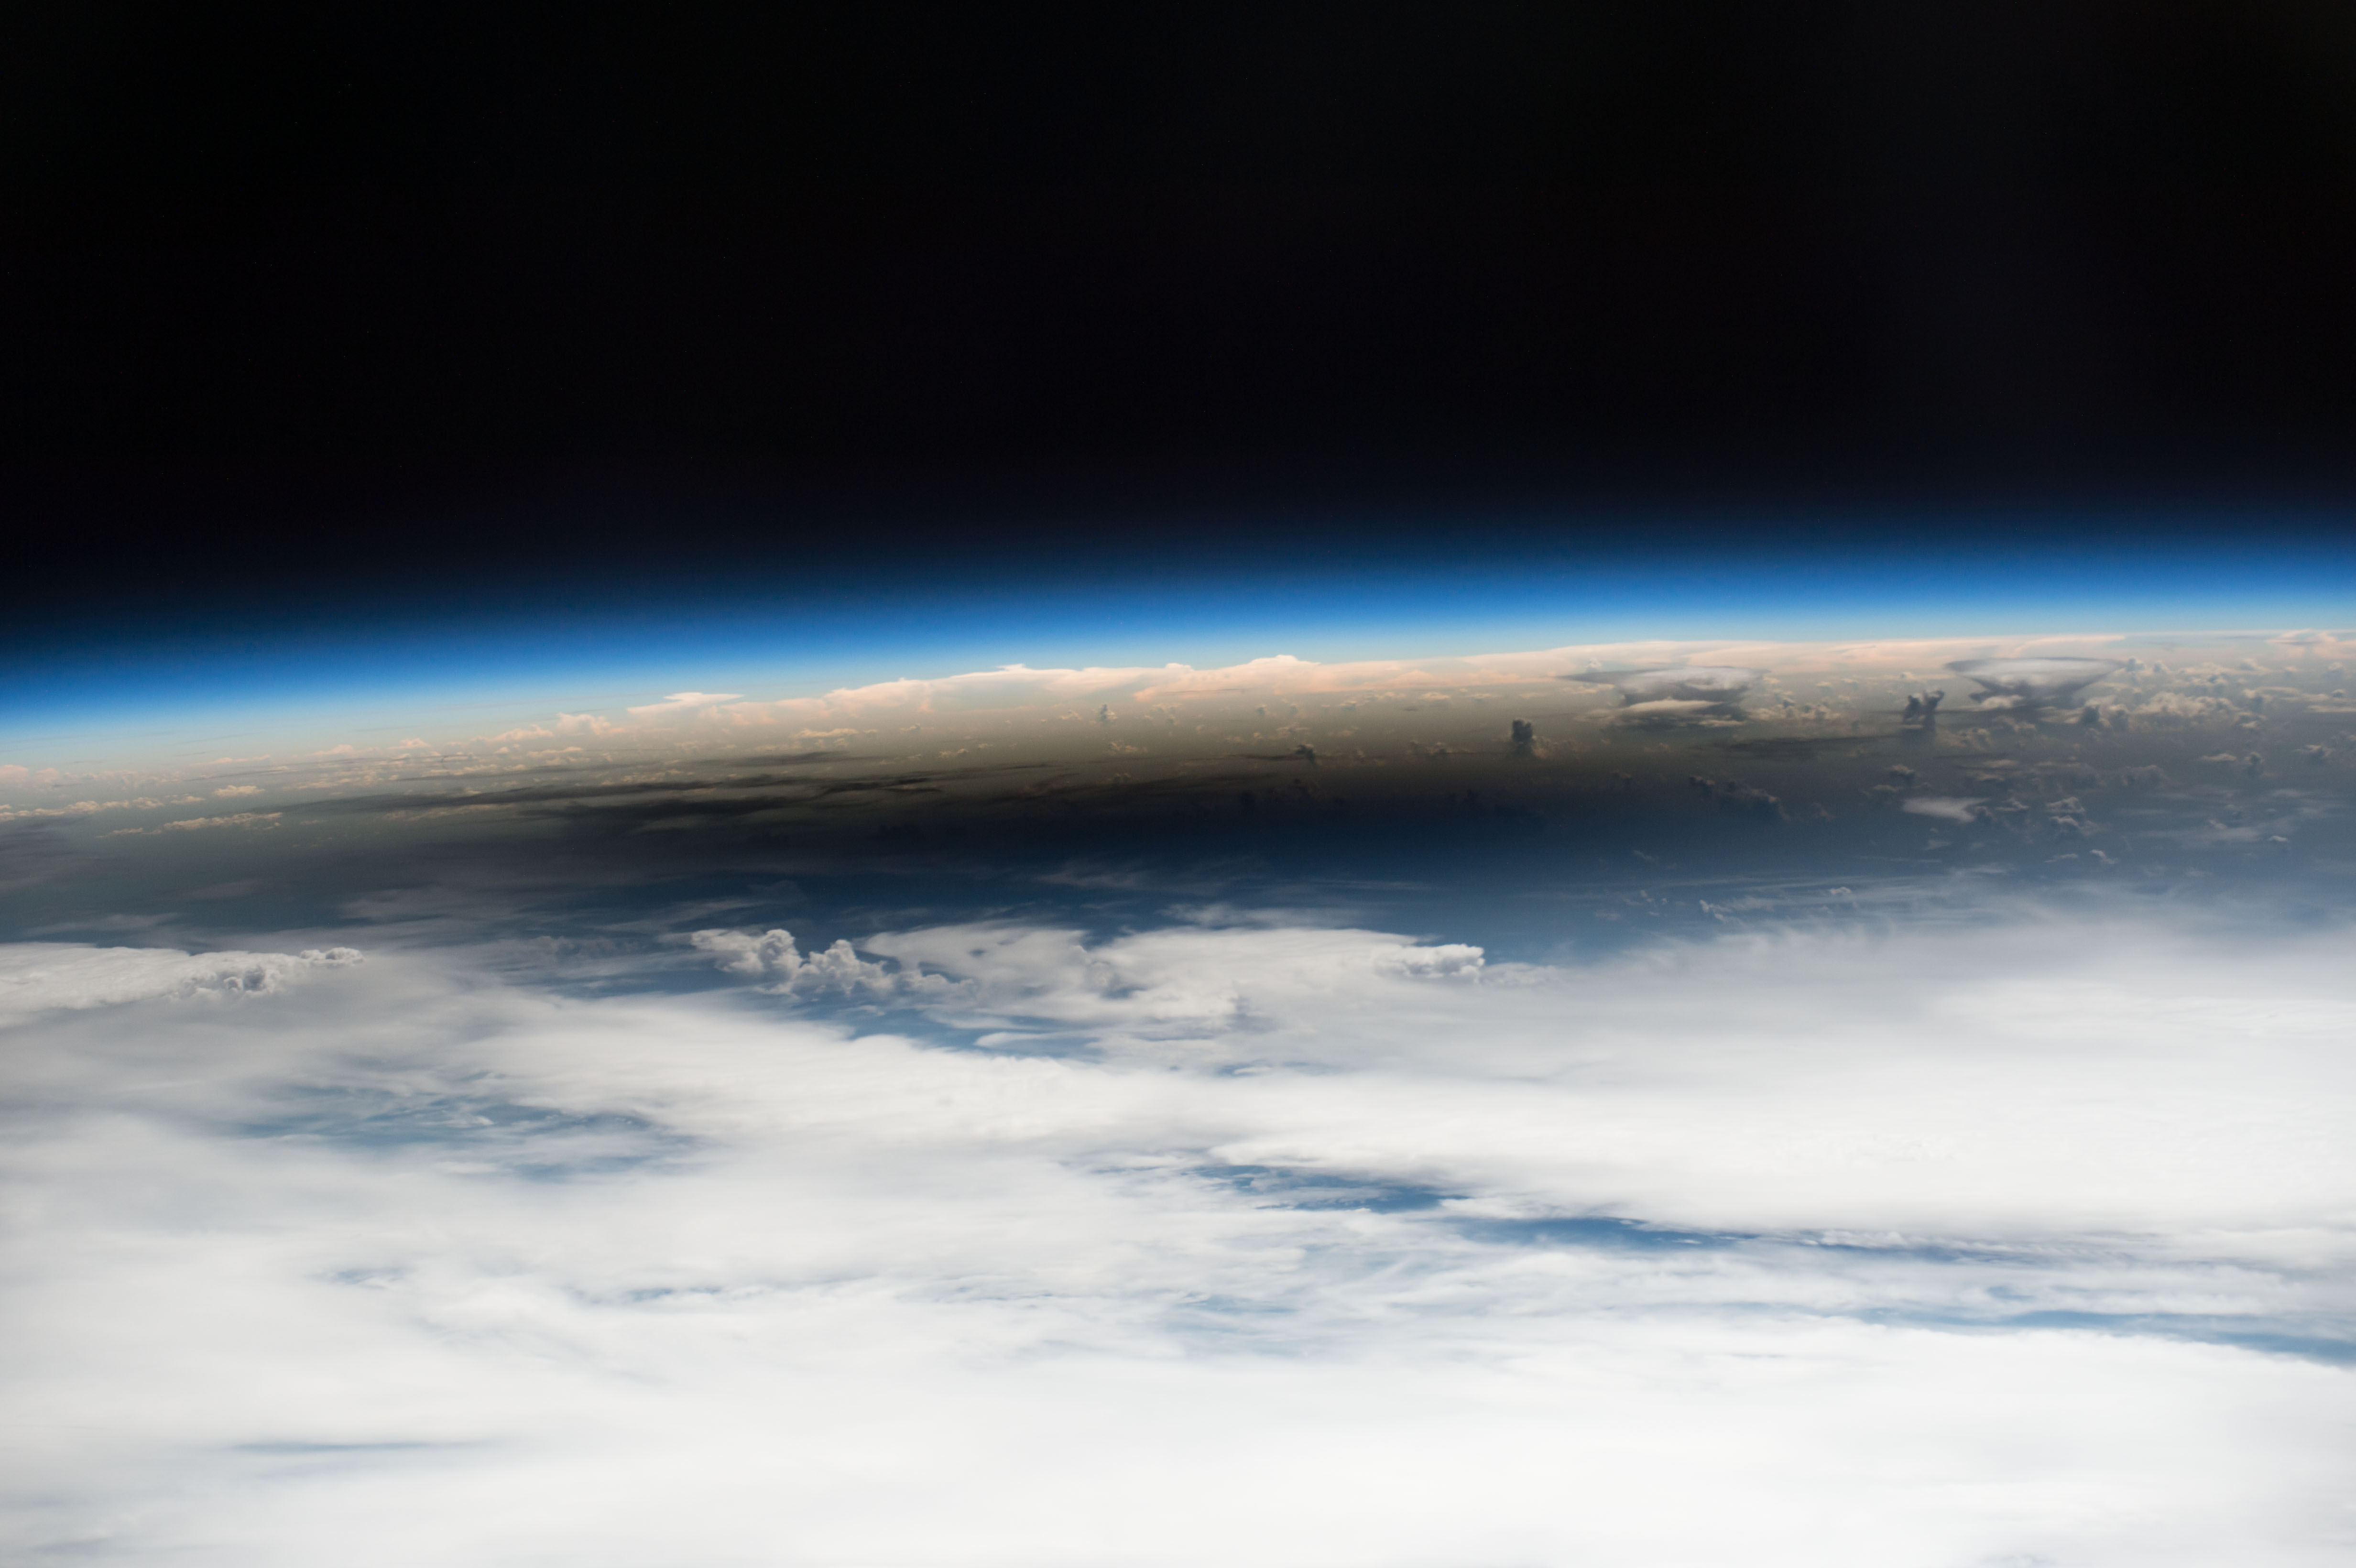
NASA Eclipse Imagery
Go to this pageAs millions of people across the United States experienced a total eclipse as the umbra, or Moon’s shadow passed over them, only six people witnessed the umbra from space. Viewing the eclipse from orbit were NASA’s Randy Bresnik, Jack Fischer and Peggy Whitson, ESA (European Space Agency’s) Paolo Nespoli, and Roscosmos’ Commander Fyodor Yurchikhin and Sergey Ryazanskiy. The space station crossed the path of the eclipse three times as it orbited above the continental United States at an altitude of 250 miles. Credit: NASA || iss052e056122.jpg (4928x3280) [844.0 KB] ||
- ID: 30893 Hyperwall Visual
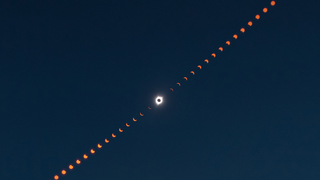
2017 Eclipse Image Collection
Go to this pageThis image is a composite photograph that shows the progression of the total solar eclipse over Madras, Oregon.http://earthobservatory.nasa.gov/NaturalHazards/view.php?id=90796 || eclipsecomposite_pho_lrg.jpg (2231x1487) [541.4 KB] || eclipsecomposite_pho_lrg_searchweb.png (320x180) [47.2 KB] || eclipsecomposite_pho_lrg_thm.png (80x40) [3.3 KB] || 2017-eclipse-images-7.hwshow [293 bytes] ||
- ID: 12698 Produced Video
What Spacecraft Saw During the 2017 Solar Eclipse
Go to this pageOn Aug. 21, 2017, a solar eclipse passed over North America. People throughout the continent experienced a partial solar eclipse, and a total solar eclipse passed over a narrow swath of land stretching from Oregon to South Carolina, called the path of totality. NASA and its partner’s satellites had a unique vantage point to watch the eclipse. Several Sun-watching satellites were in a position to see the Moon cross in front of the Sun, while many Earth-observing satellites – and NASA’s Lunar Reconnaissance Orbiter, which typically images the Moon’s landscape – captured images of the Moon’s shadow on Earth’s surface. See more and download content at https://go.nasa.gov/2x7b8kf ||
- ID: 12693 Produced Video
![Complete transcript available.Music credits: ‘Electricity Wave’ by Jean-François Berger [SACEM] and ‘Solar Winds’ by Ben Niblett [PRS], Jon Cotton [PRS]Watch this video on the NASA Goddard YouTube channel.](/vis/a010000/a012600/a012693/LARGE_MP4-12693_FirstCMEDuringEclipse_large.00139_print.jpg)
A Total Solar Eclipse Revealed Solar Storms 100 Years Before Satellites
Go to this pageEclipses set the stage for historic science. NASA is taking advantage of the Aug. 21, 2017 eclipse by funding 11 ground-based scientific studies. As our scientists prepare their experiments for next week, we're looking back to an historic 1860 total solar eclipse, which many think gave humanity our first glimpse of solar storms — called coronal mass ejections — 100 years before scientists first understood what they were.Scientists observed these eruptions in the 1970s during the beginning of the modern satellite era, when satellites in space were able to capture thousands of images of solar activity that had never been seen before. But in hindsight, scientists realized their satellite images might not be the first record of these solar storms. Hand-drawn records of an 1860 total solar eclipse bore surprising resemblance to these groundbreaking satellite images.Eclipse archive imagery from: http://mlso.hao.ucar.edu/hao-eclipse-archive.php ||
- ID: 2655 Visualization
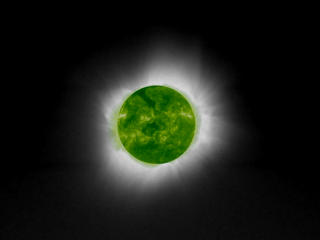
Solar Eclipse: December 4, 2002
Go to this pageA composite of red continuum with SOHO/EIT near totality. The red image was taken in Ceduna, South Australia. The images are co-registered so one can install smooth dissolves between them. || Solar eclipse in red continuum || eclipse0002.jpg (1280x960) [46.6 KB] || eclipse0002_web.jpg (320x240) [3.9 KB] || eclipse0002.tif (1280x960) [208.4 KB] ||
SOHO Other Sun Imagery
- ID: 12890
 Produced Video
 - ID: 12292
 Produced Video
 - ID: 40300
 Gallery
 - ID: 11905
 Produced Video
 - ID: 11642
 Produced Video
 - ID: 30315
 Hyperwall Visual
 - ID: 10998
 Produced Video
 - ID: 40120
 Gallery
 - ID: 10583
 Produced Video
 - ID: 3566
 Visualization
 - ID: 3548
 Visualization
 - ID: 3549
 Visualization
 - ID: 3435
- ID: 3386
 Visualization
 - ID: 3336
 Visualization
 - ID: 2923
 Visualization
 - ID: 2764
 Visualization
 - ID: 2765
 Visualization
 - ID: 2766
 Visualization
 - ID: 2735
 Visualization
 - ID: 20075
 Animation
 - ID: 2425
 Visualization
 - ID: 2426
 Visualization
 - ID: 2243
 Visualization
 - ID: 2244
 Visualization
 - ID: 2268
 Visualization
 - ID: 2269
 Visualization
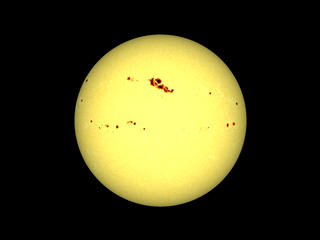
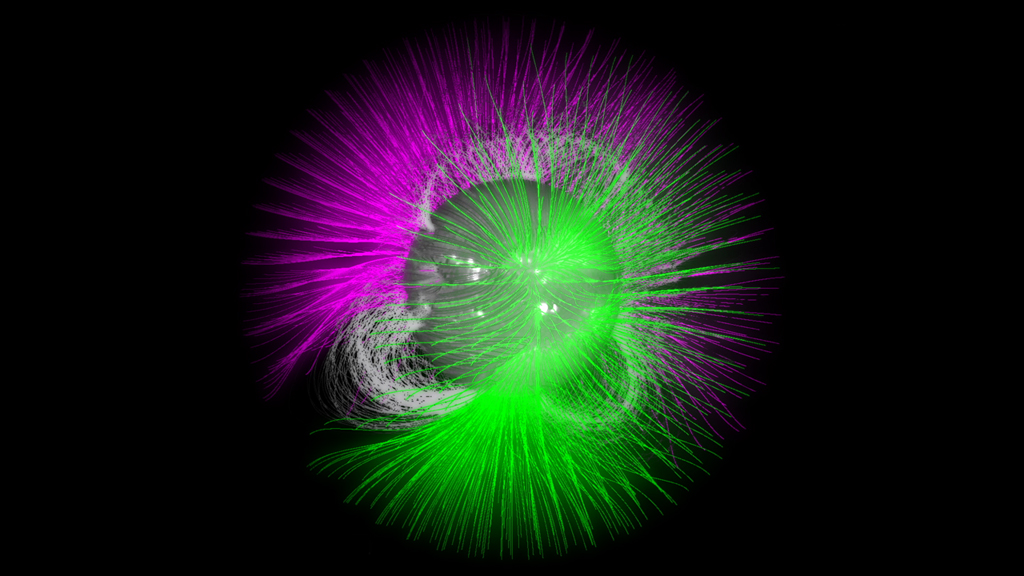
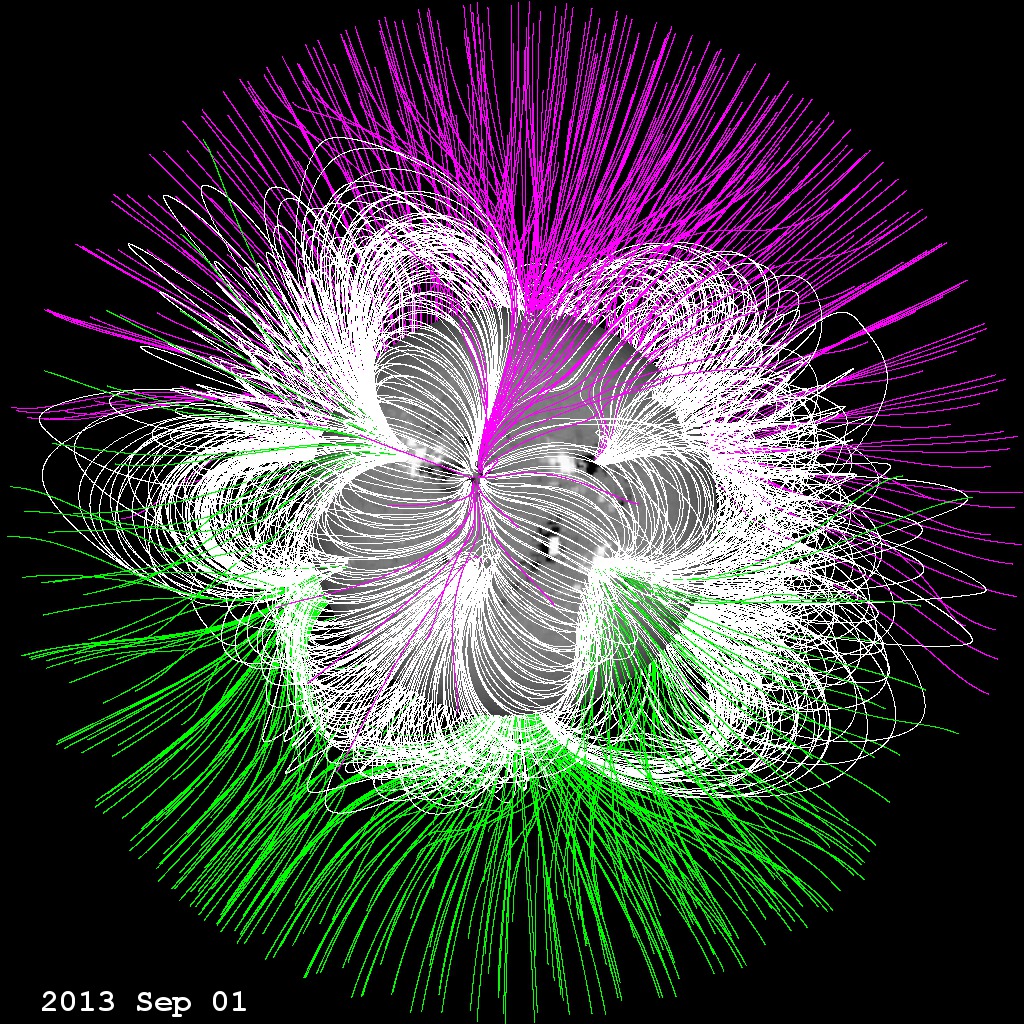
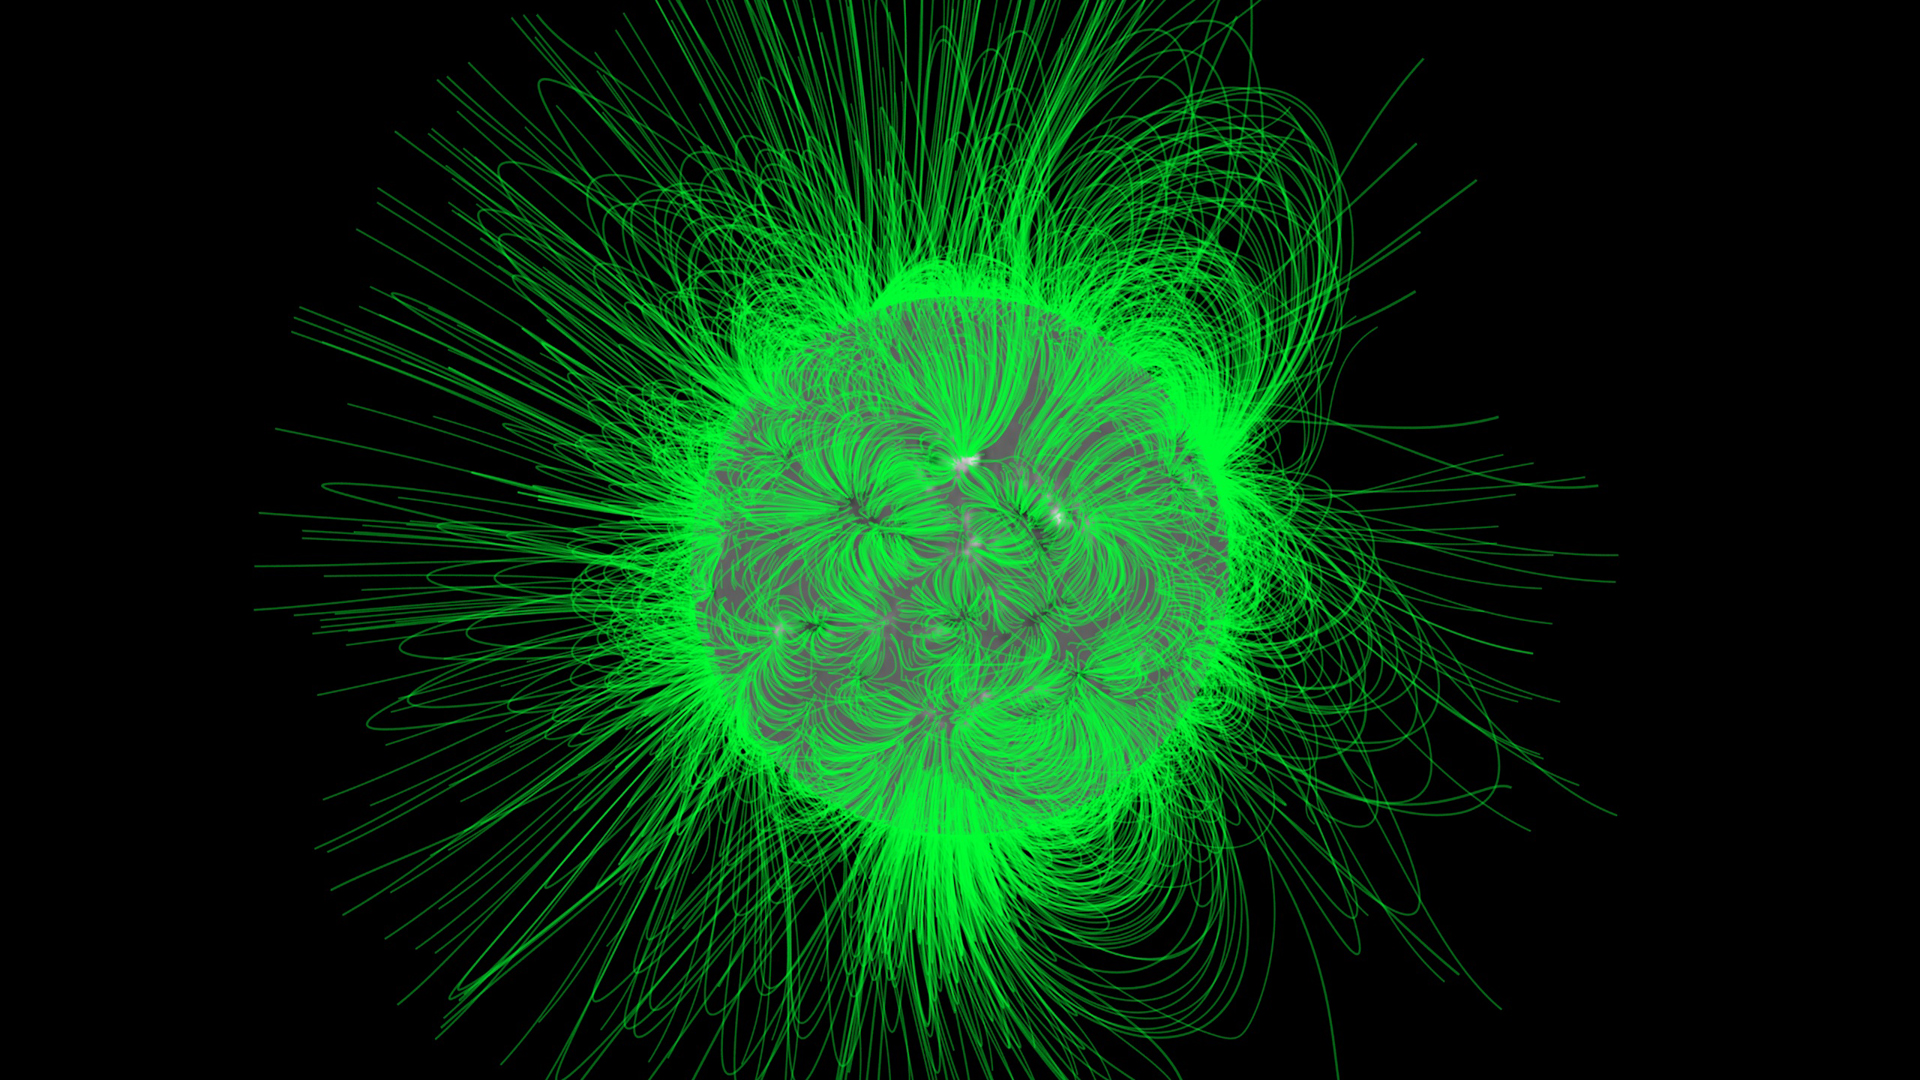
The Sun's Magnetism
- ID: 11419
 Produced Video
 - ID: 4124
 Visualization
 - ID: 11277
 Produced Video
 - ID: 3496
 Visualization
 - ID: 3521
 Visualization
 - ID: 3583
 Visualization
 - ID: 3346
 Visualization
 - ID: 3286
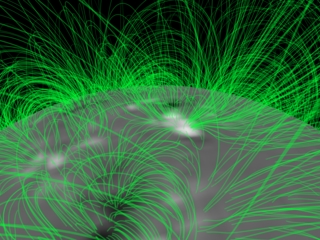 Visualization
 - ID: 3287
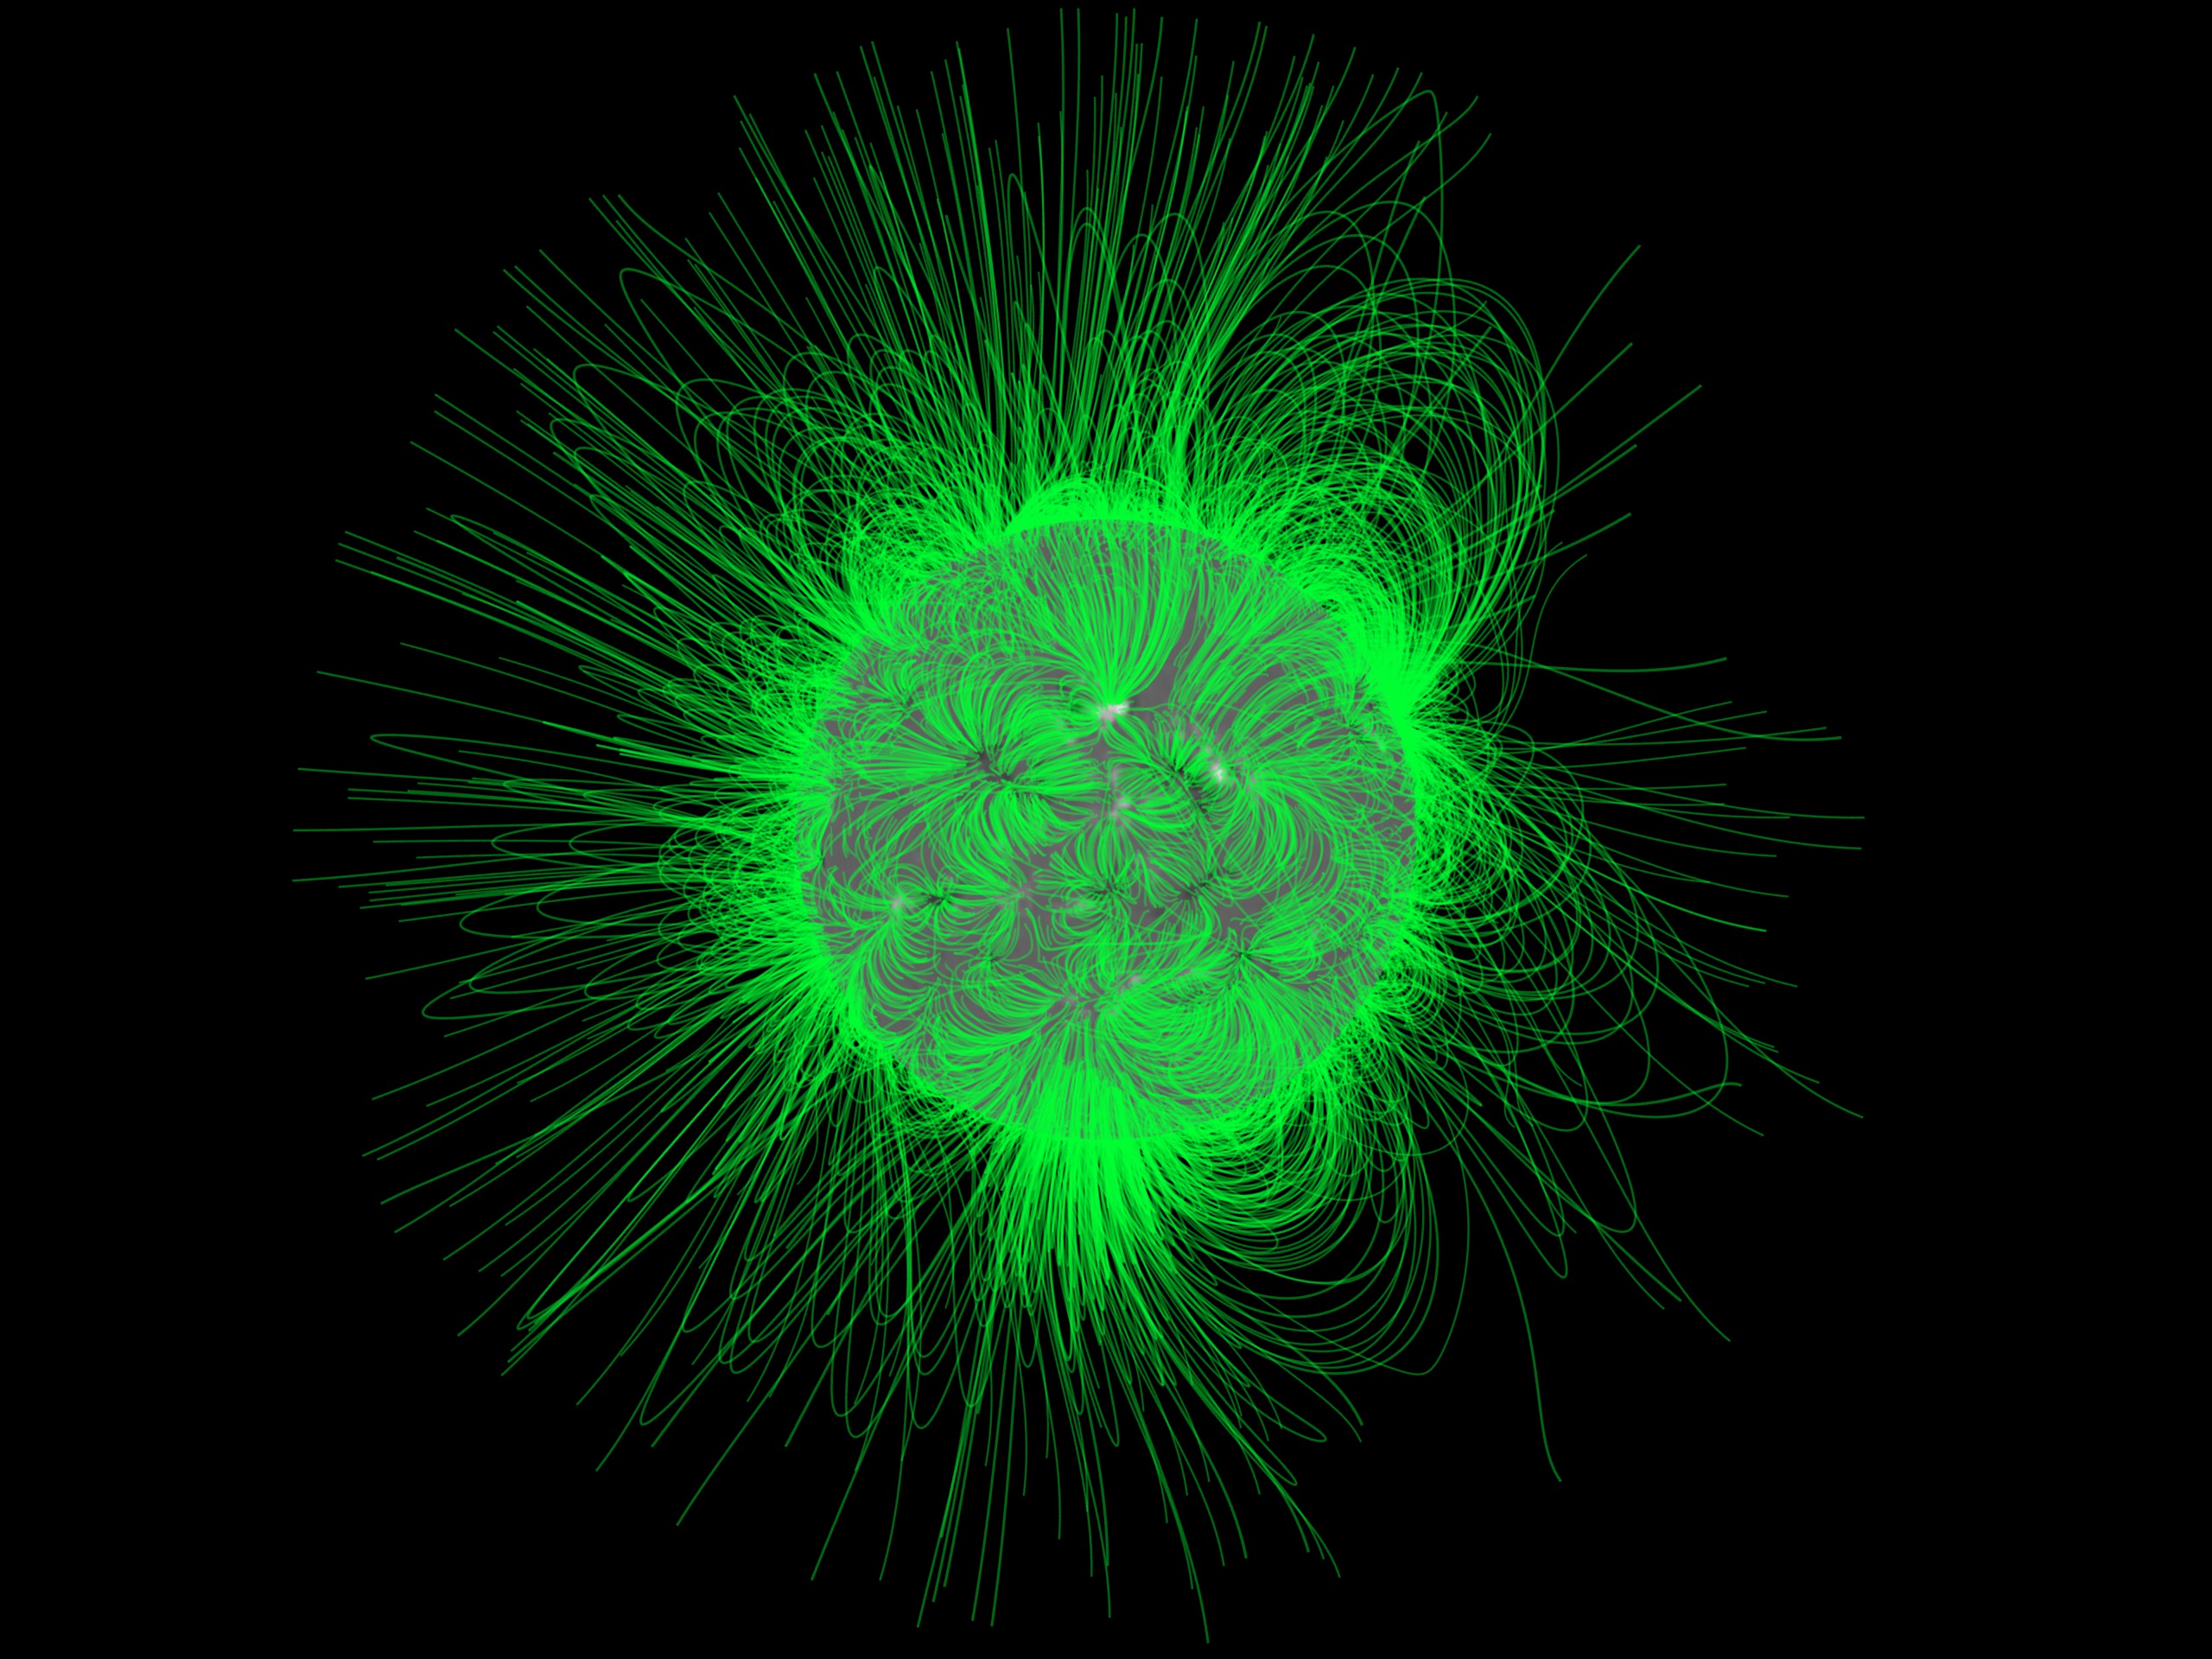 Visualization
 - ID: 3211
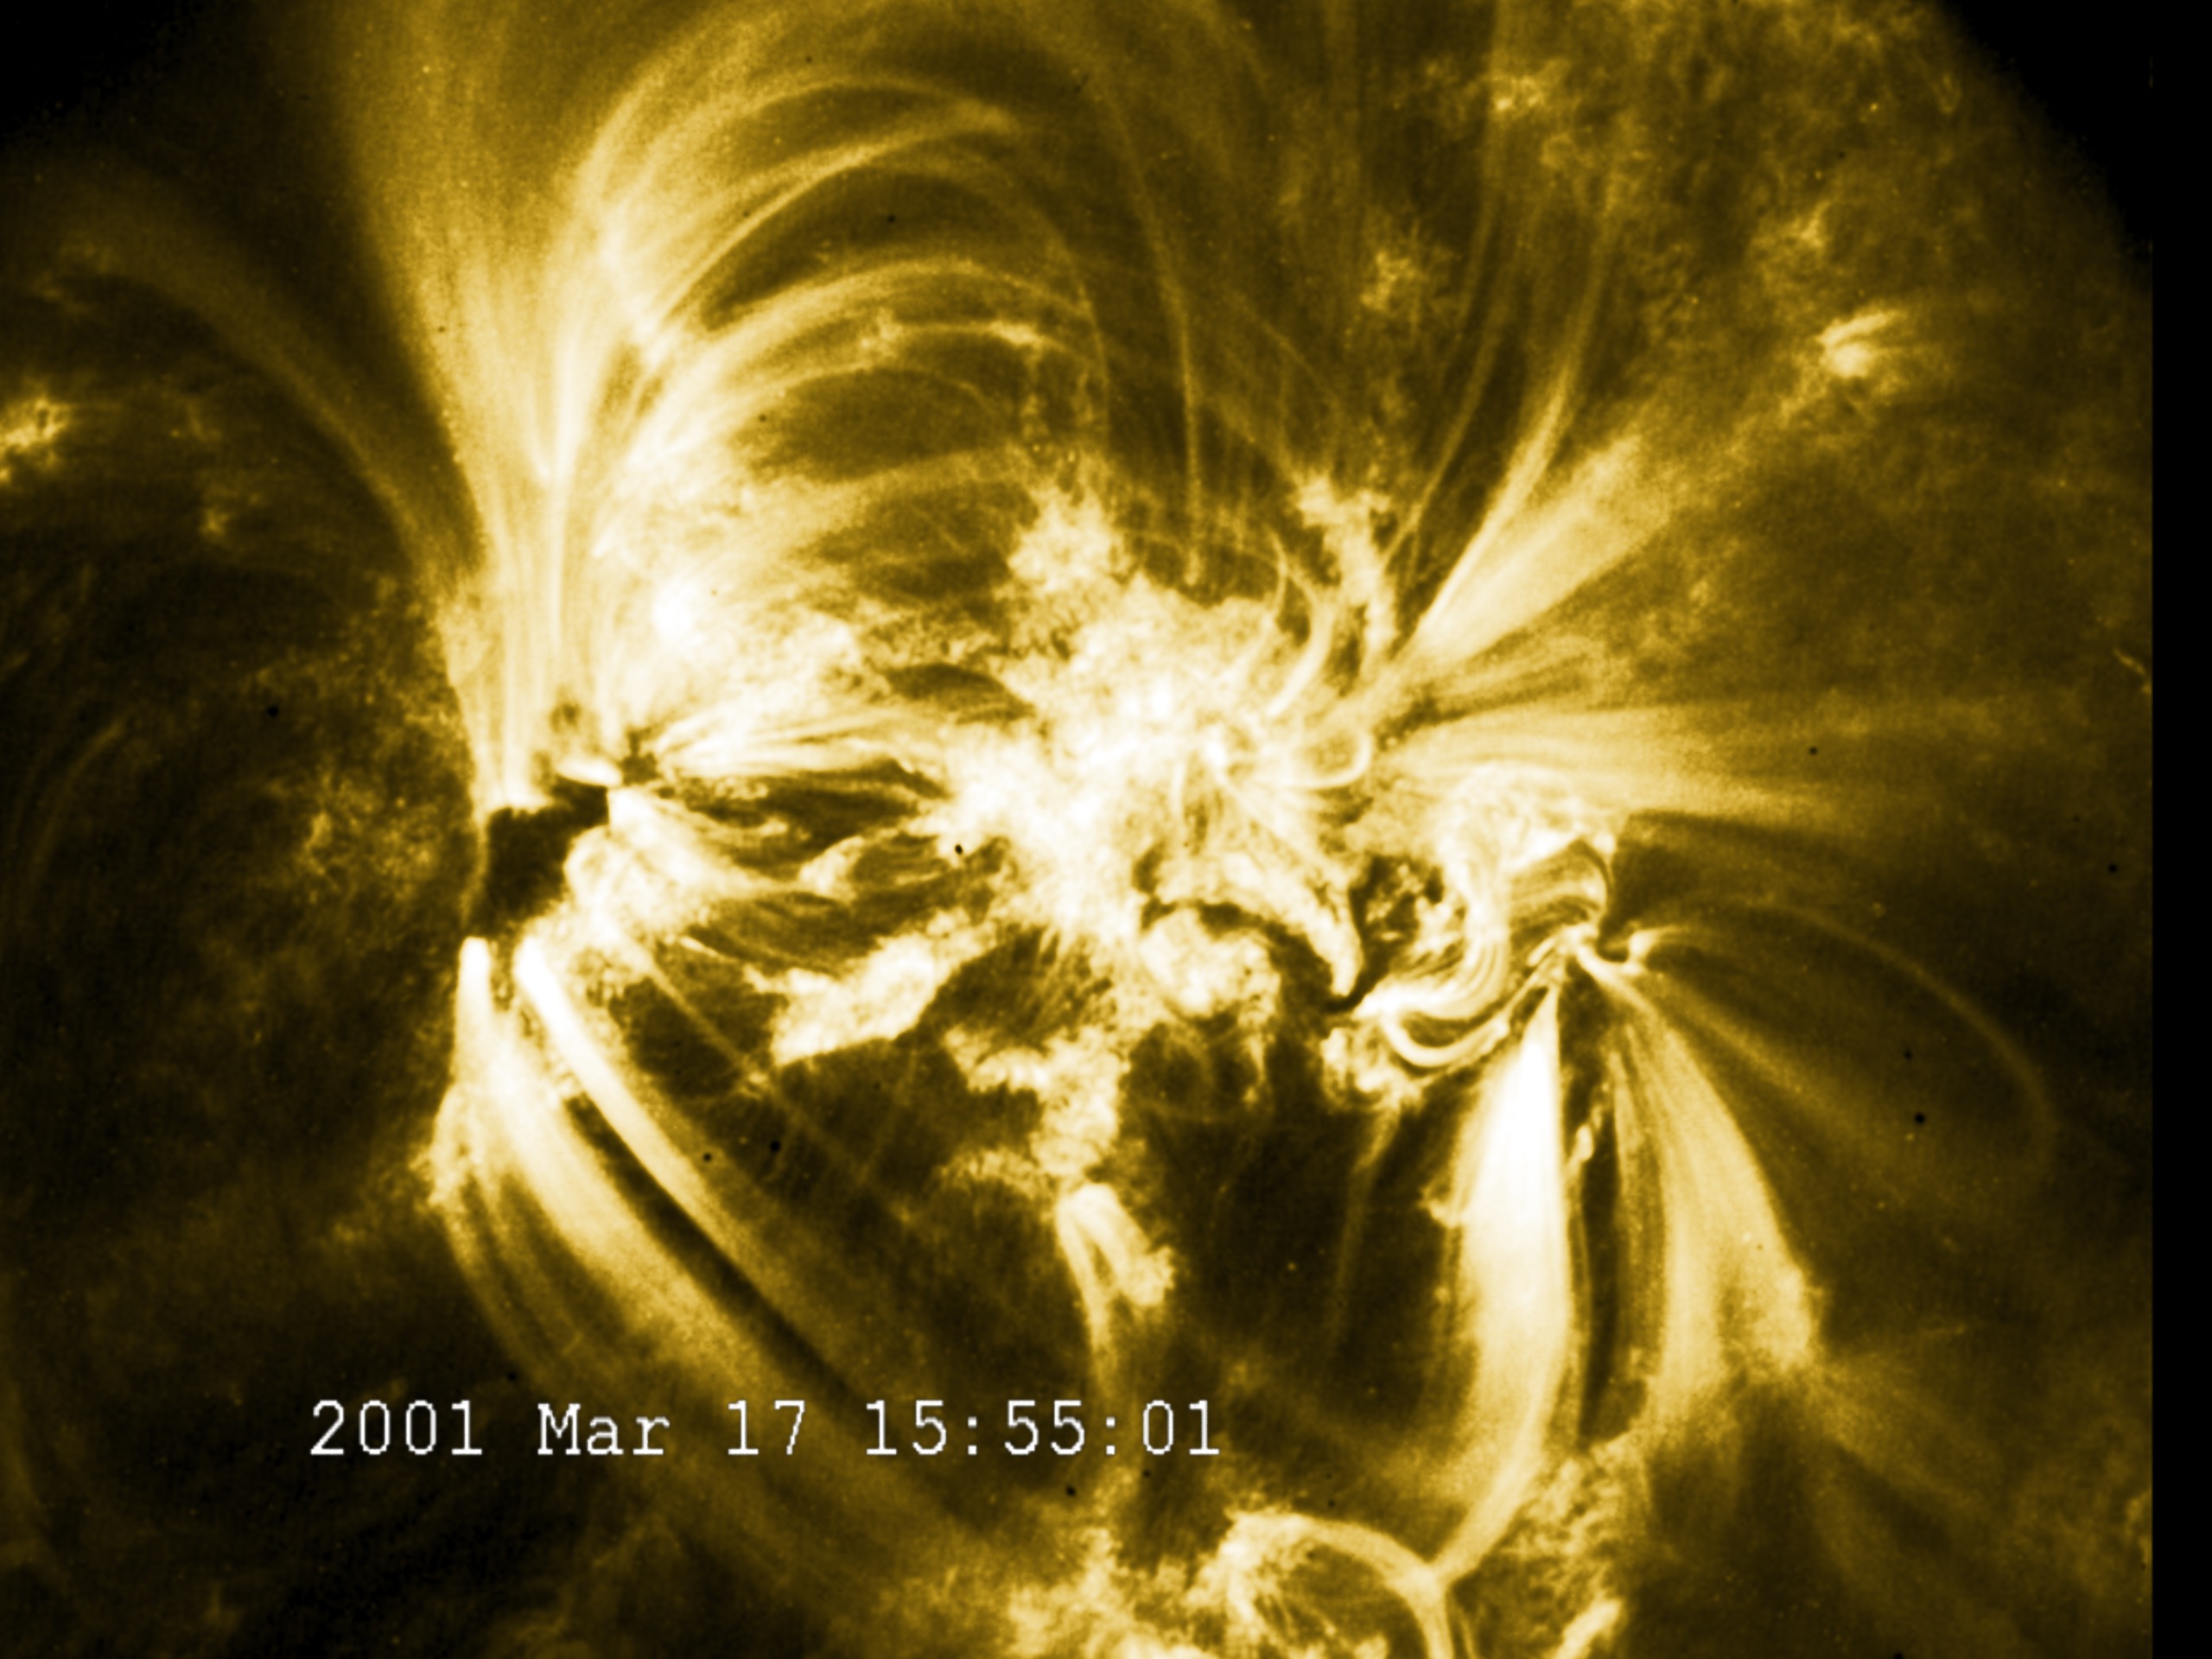 Visualization
 - ID: 3212
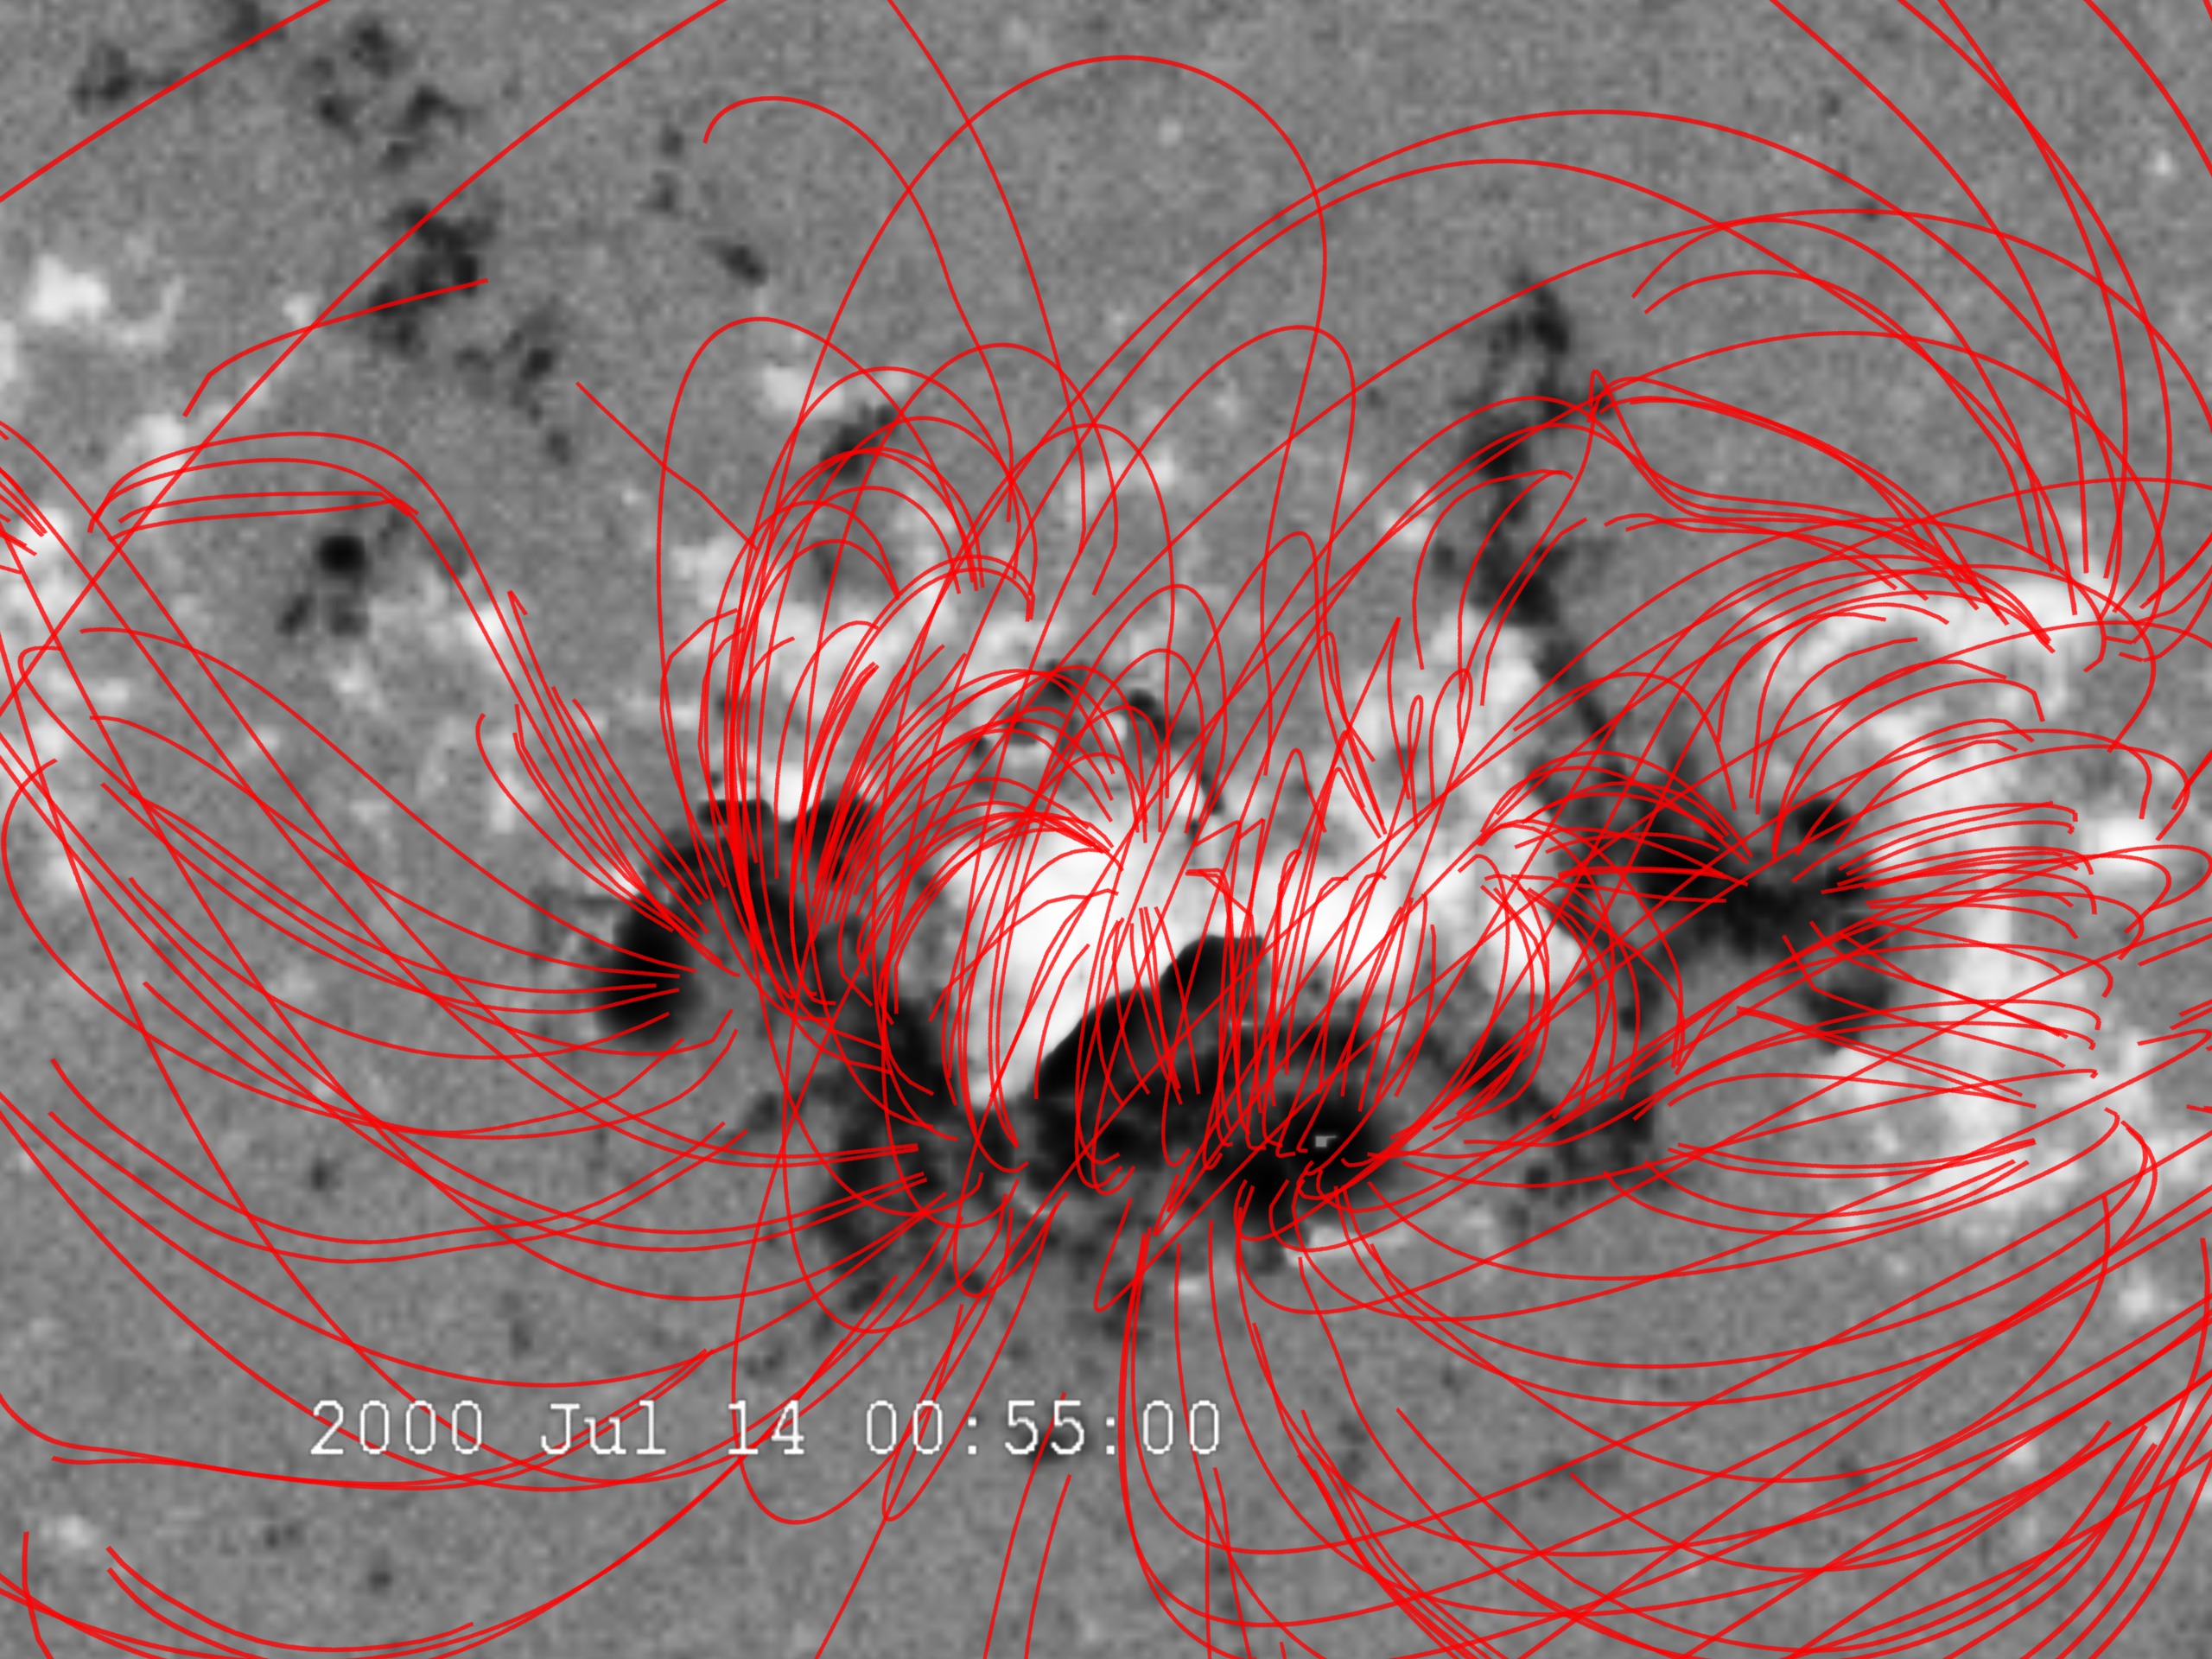 Visualization
Halloween 2003 Solar Storms
- ID: 3956 Visualization
Halloween Solar Storms - 2003
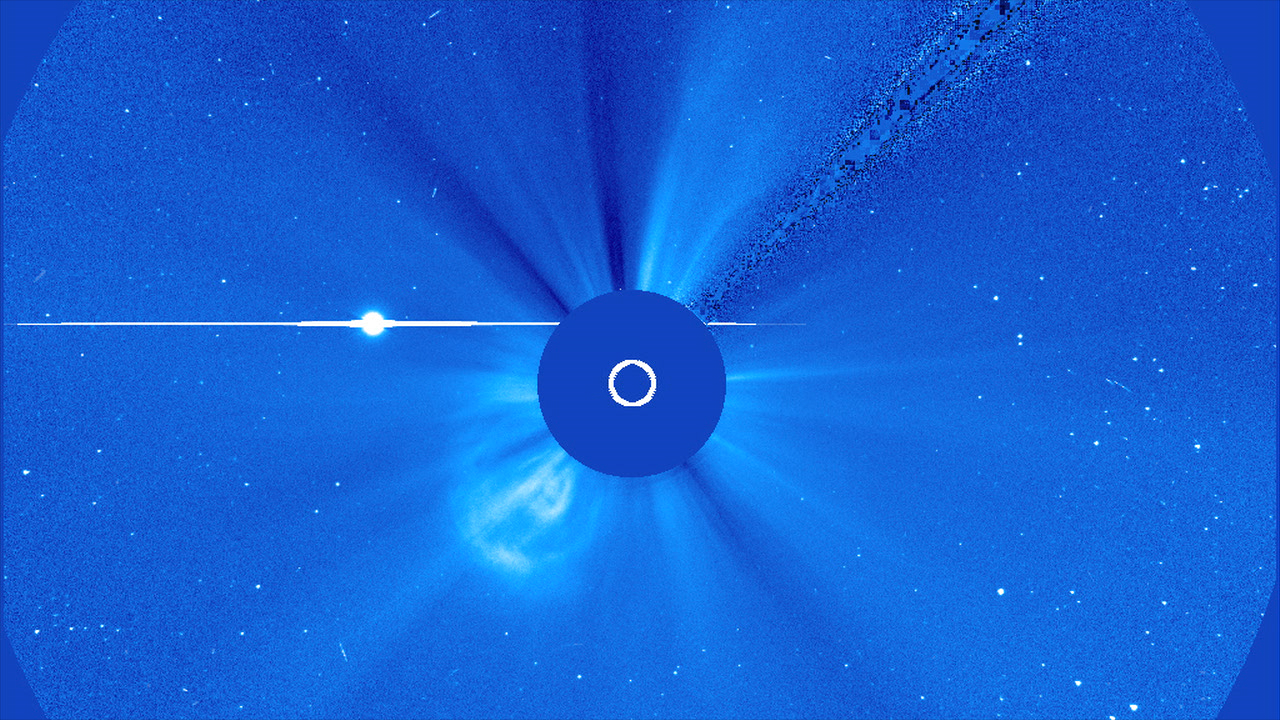
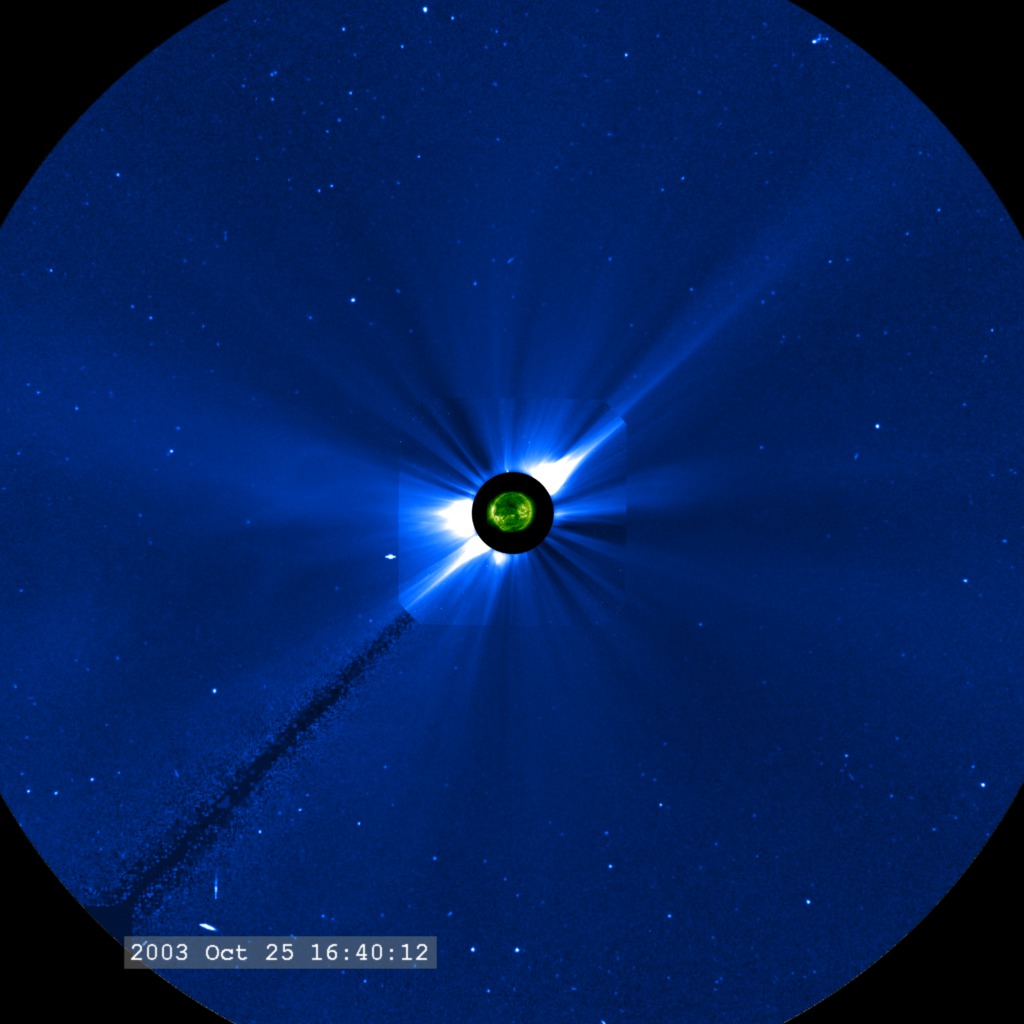
Go to this pageThis is a 1024x1024 pixel version of solar storms providing a more complete view of the SOHO/LASCO/C3 field-of-view.Here is a view of the solar disk in 195 Å ultraviolet light (colored green in this movie) and the Sun's extended atmosphere, or corona, (blue and white in this movie). The corona is visible to the SOHO/LASCO coronagraph instruments, which block the bright disk of the Sun so the significantly fainter corona can be seen. In this movie, the inner coronagraph (designated C2) is combined with the outer coronagraph (C3). This movie covers a two week period in October and November 2003 which exhibited some of the largest solar activity events since the advent of space-based solar observing.As the movie plays, we can observe a number of features of the active Sun. Long streamers radiate outward from the Sun and wave gently due to their interaction with the solar wind. The bright white regions are visible due to their high density of free electrons which scatter the light from the photosphere towards the observer. Protons and other ionized atoms are there as well, but are not as visible since they do not interact with photons as strongly as electrons. Coronal Mass Ejections (CMEs) are occasionally observed launching from the Sun. Some of these launch particle events which can saturate the cameras with snow-like artifacts.Also visible in the coronagraphs are stars and planets. Stars are seen to drift slowly to the right, carried by the relative motion of the Sun and the Earth. The planet Mercury is visible as the bright point moving left of the Sun. The horizontal 'extension' in the image is called 'blooming' and is due to a charge leakage along the readout wires in the CCD imager in the camera. ||
- ID: 3535 Visualization
Halloween Storms 2003: SOHO/EIT and TRACE at 195 Angstroms
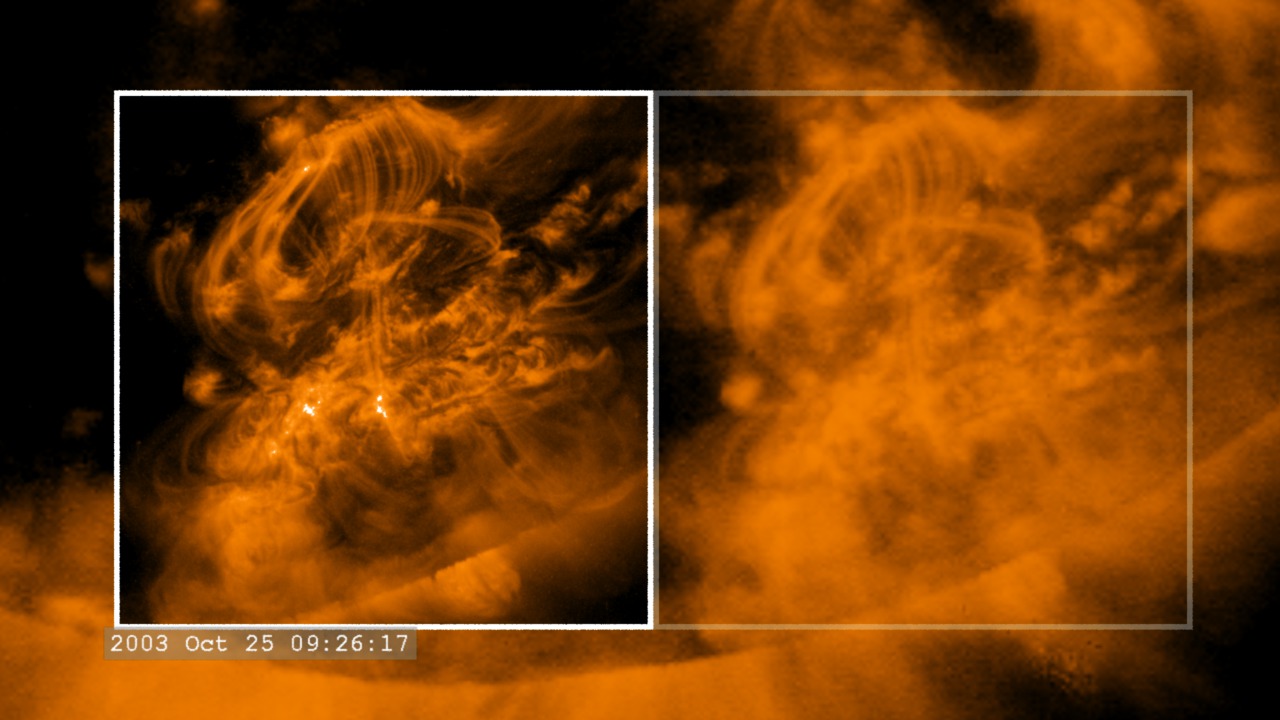
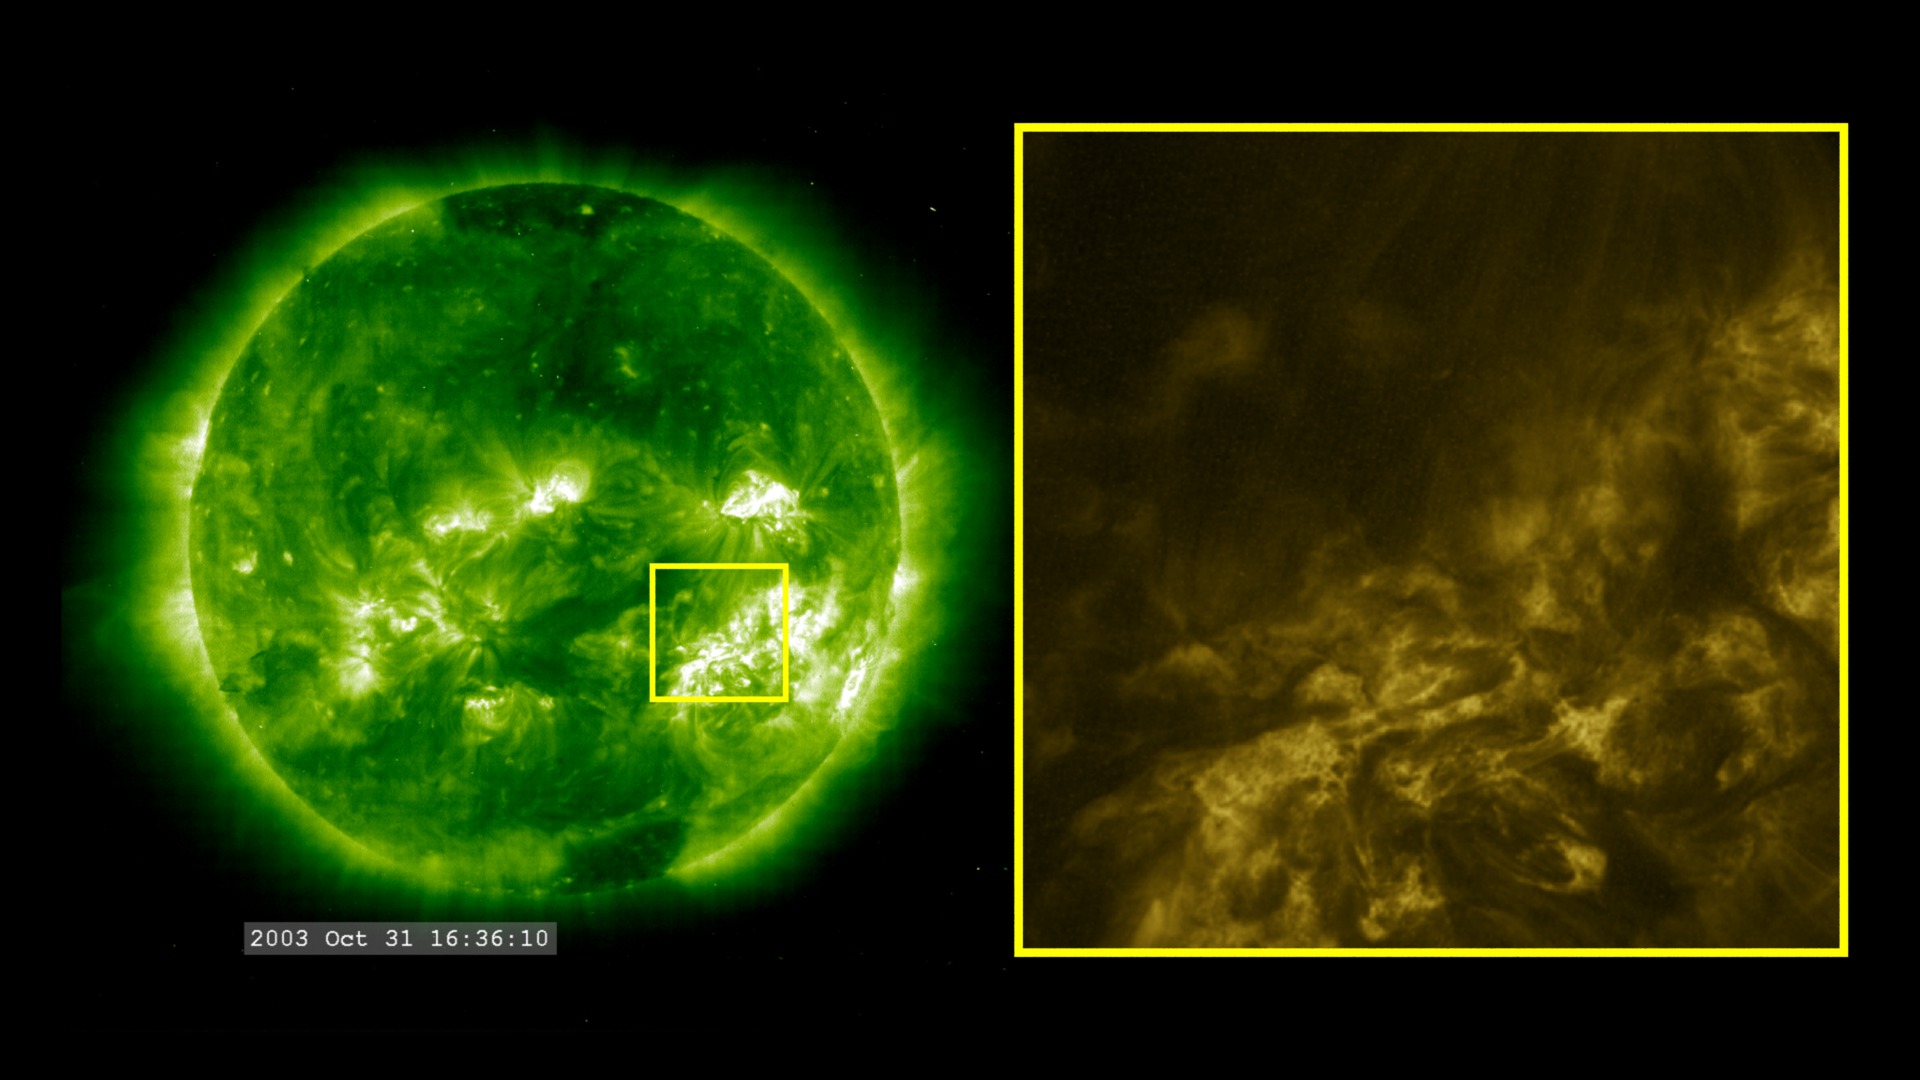
Go to this pageThis visualization compares the full-disk solar view of SOHO/EIT (green, on the left) with the small field of view of the TRACE ultraviolet telescope (gold, on the right). The yellow border of the TRACE imagery is projected on the appropriate location on the green EIT imagery. Notice that TRACE can track features as they move across the solar disk. The instrument pointing is adjusted on a regular basis, which can produce a considerable amount of jittering in the image. This is a variation on the treatment of the same data as Solar Dynamics Observatory (SDO): Data Collection Comparison.Note that this movie does not play synchronous with the other animations that are part of the SDO Prelaunch package. ||
- ID: 3500 Visualization
Halloween 2003 Solar Storms: SOHO/EIT Ultraviolet, 195 Angstroms
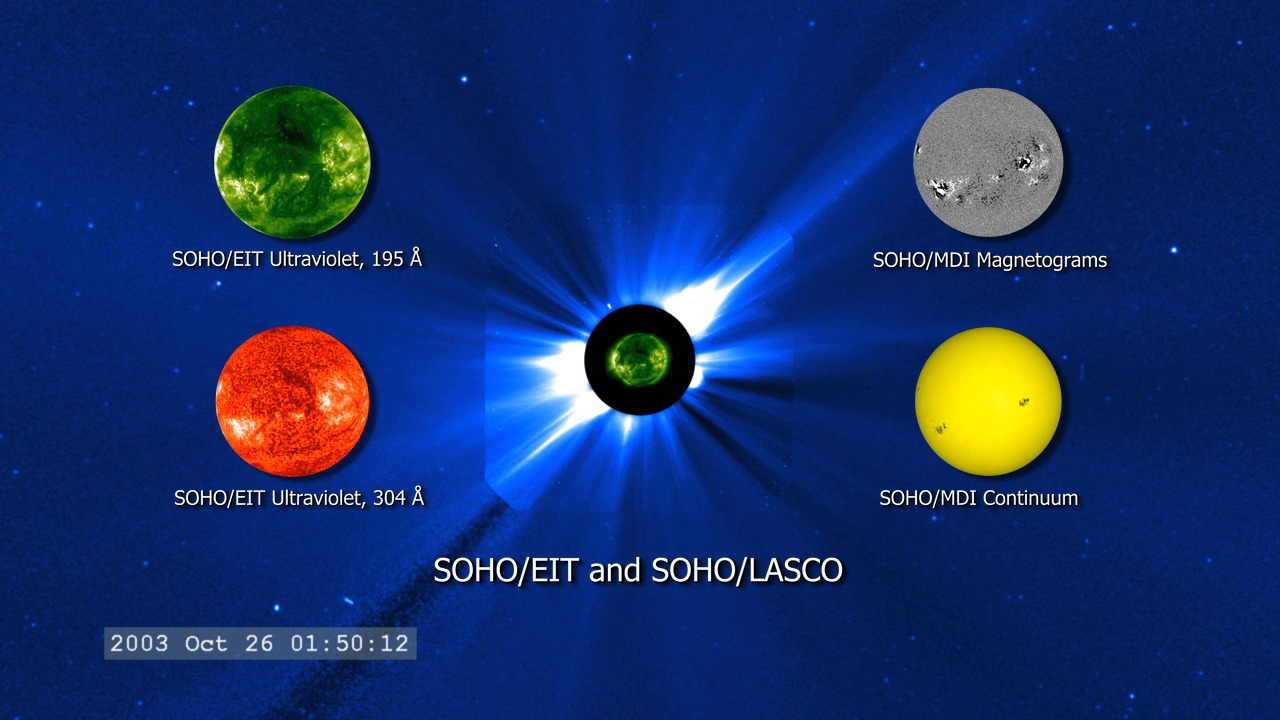
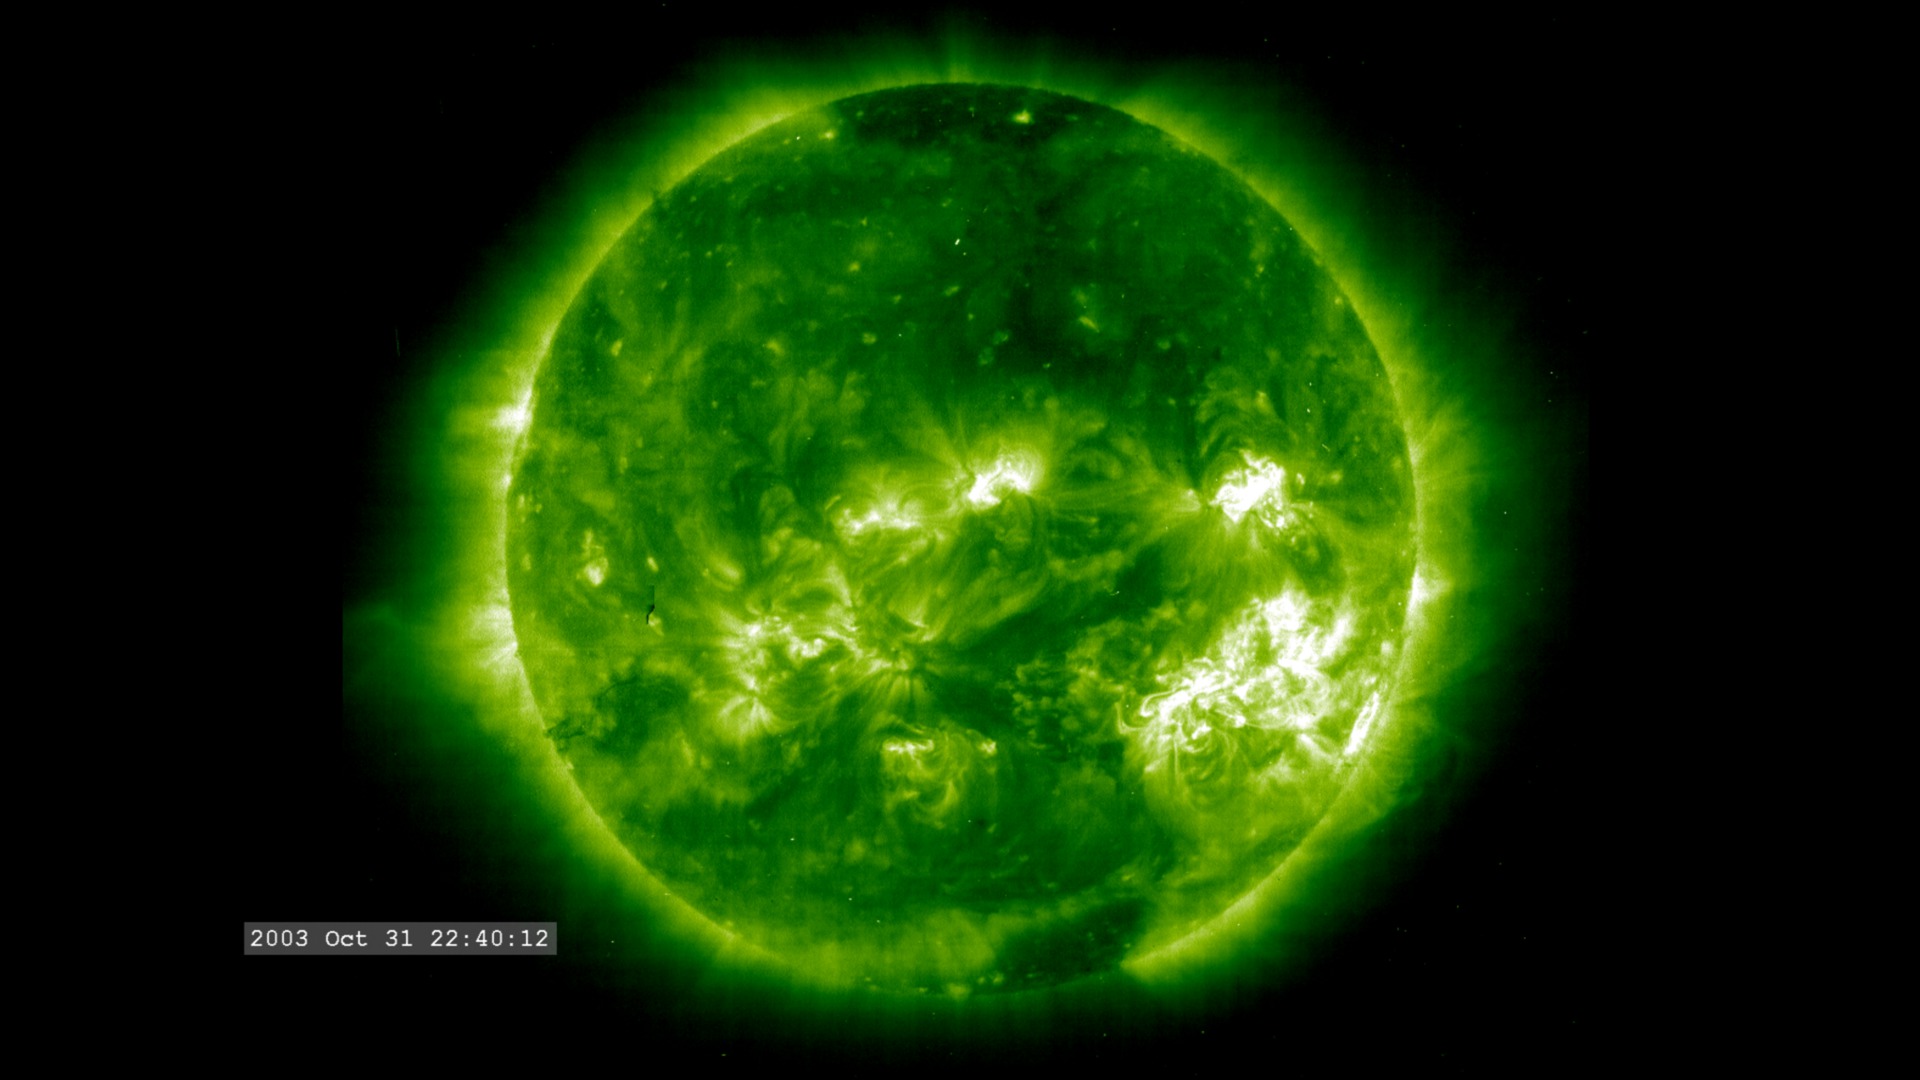
Go to this pageHere is a view of the full solar disk during a two-week period in October and November of 2003 which exhibited some of the largest solar activity events since the advent of space-based solar observing. The Extreme ultraviolet Imaging Telescope (EIT) collects solar images in an extremely short wavelength of ultraviolet light, not visible from the surface of the Earth. The narrow wavelength band at 195 angstroms corresponds (19.5 nanometers) corresponds to a spectral line of multiply-ionized iron atoms. This movie is part of a series of movies with matching cadence designed to play synchronously with each other. The other movies in this series are Halloween 2003 Solar Storms: SOHO/EIT Ultraviolet, 304 A Halloween 2003 Solar Storms: SOHO/MDI Continuum Halloween 2003 Solar Storms: SOHO/MDI Magnetograms Halloween 2003 Solar Storms: SOHO/EIT and SOHO/LASCO For more information, visit the SOHO project page. ||
- ID: 3501 Visualization
Halloween 2003 Solar Storms: SOHO/EIT Ultraviolet, 304 Angstroms
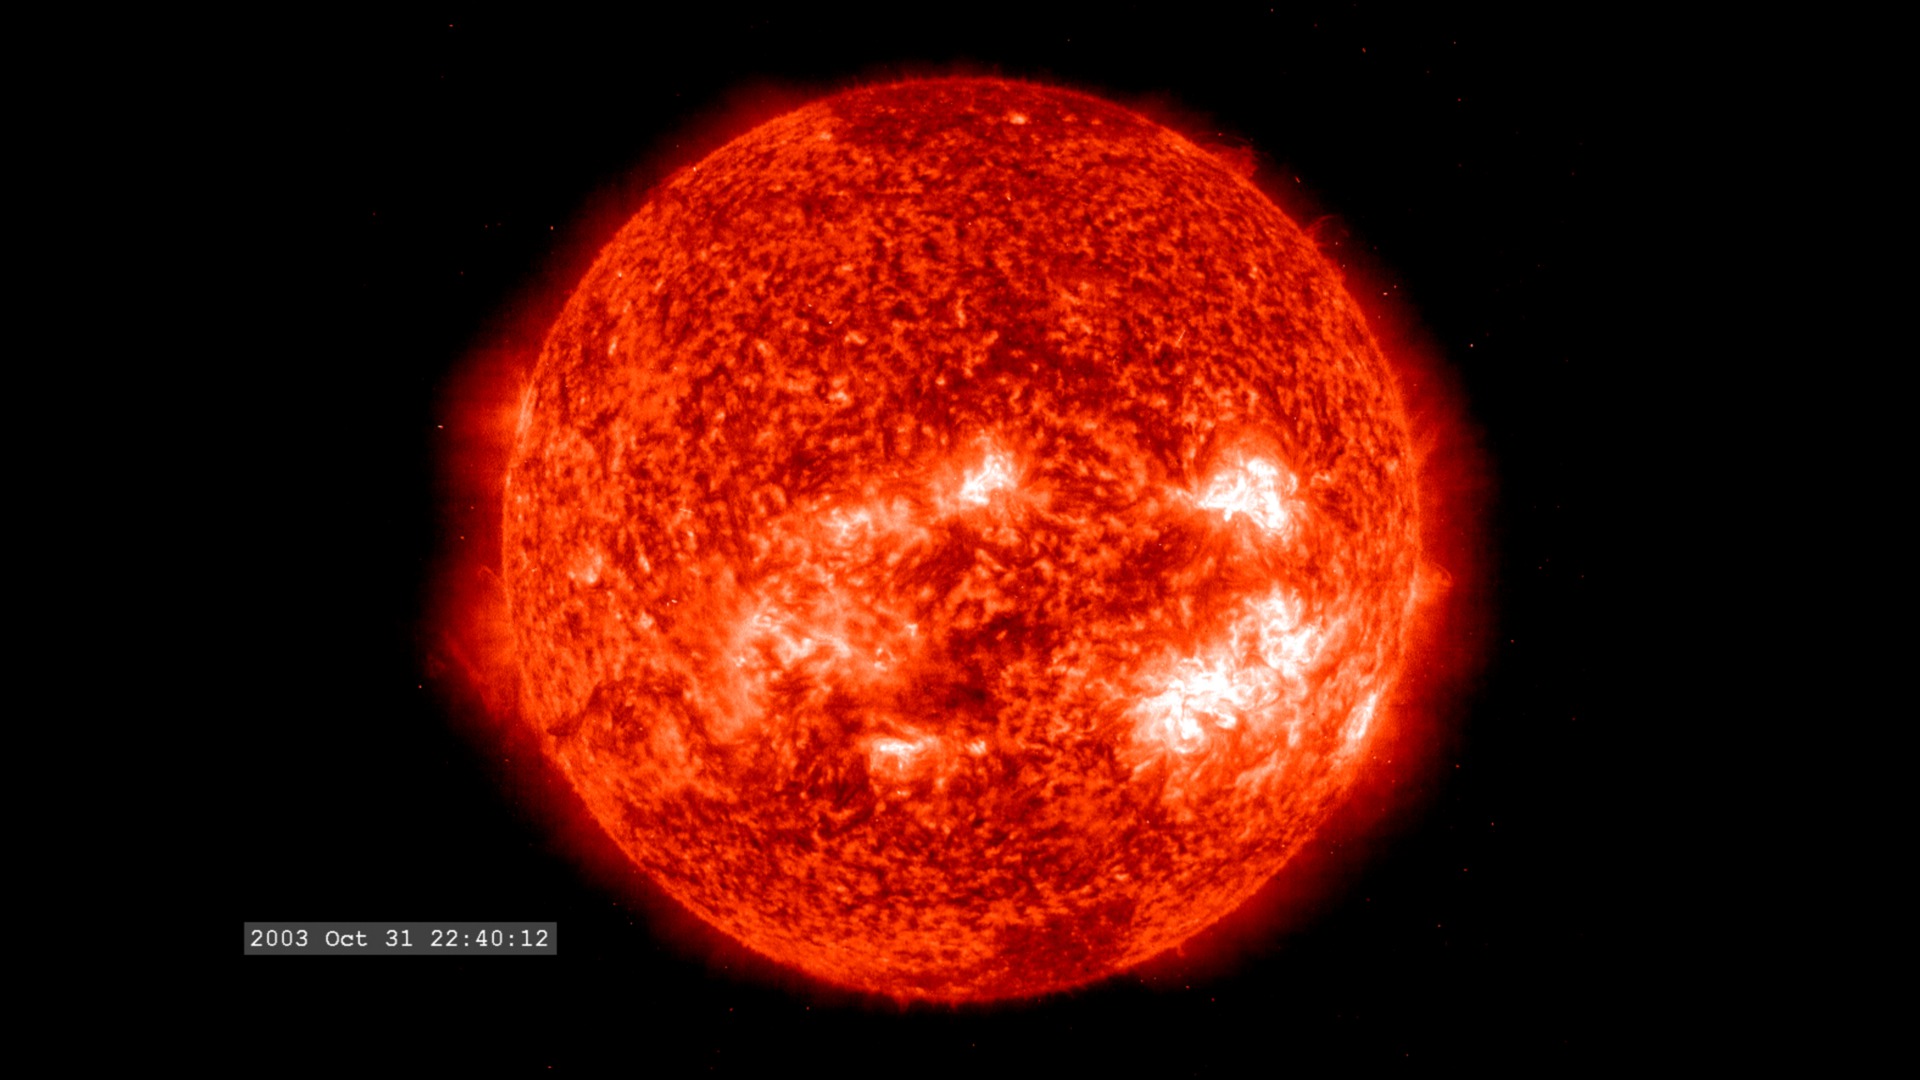
Go to this pageHere is a view of the full solar disk during a two-week period in October and November of 2003 which exhibited some of the largest solar activity events since the advent of space-based solar observing. The Extreme ultraviolet Imaging Telescope (EIT) collects solar images in an extremely short wavelength of ultraviolet light, not visible from the surface of the Earth. The narrow wavelength band at 304 Ångstroms corresponds (30.4 nanometers) corresponds to a spectral line of multiply-ionized iron atoms. This movie is part of a series of movies with matching cadence designed to play synchronously with each other. The other movies in this series are Halloween 2003 Solar Storms: SOHO/EIT Ultraviolet, 195 ÅHalloween 2003 Solar Storms: SOHO/MDI Continuum Halloween 2003 Solar Storms: SOHO/MDI Magnetograms Halloween 2003 Solar Storms: SOHO/EIT and SOHO/LASCO For more information, visit the SOHO project page. ||
- ID: 3502 Visualization
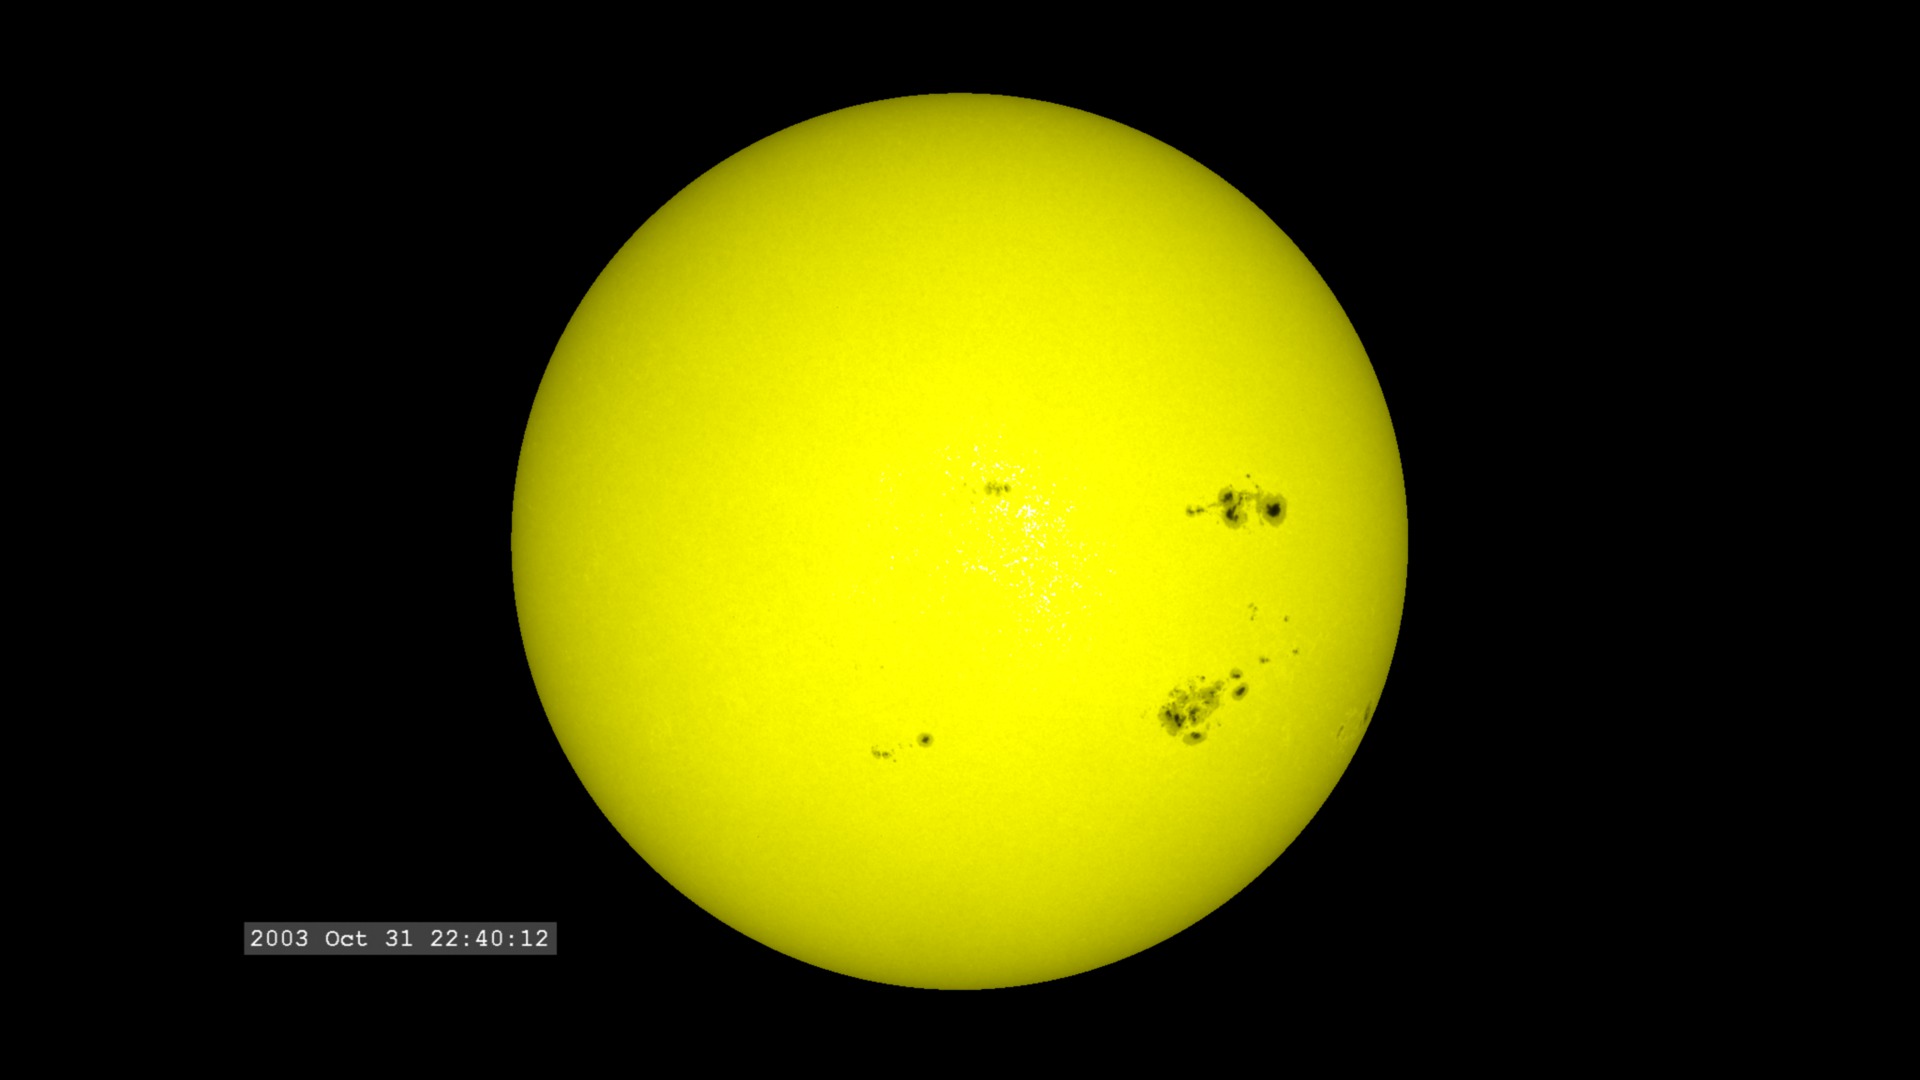
Halloween 2003 Solar Storms: SOHO/MDI Continuum
Go to this pageHere is a view of the full solar disk during a two-week period in October and November of 2003 which exhibited some of the largest solar activity events since the advent of space-based solar observing. The Michelson Doppler Interferometer (MDI) records images at several very narrow wavelength bands in the visible light. These images are often used as proxies for white-light solar images. This movie is part of a series of movies with matching cadence designed to play synchronously with each other. The other movies in this series are Halloween 2003 Solar Storms: SOHO/EIT Ultraviolet, 195 angstroms Halloween 2003 Solar Storms: SOHO/EIT Ultraviolet, 304 angstroms Halloween 2003 Solar Storms: SOHO/MDI Magnetograms Halloween 2003 Solar Storms: SOHO/EIT and SOHO/LASCO For more information, visit the SOHO project page. ||
- ID: 3503 Visualization
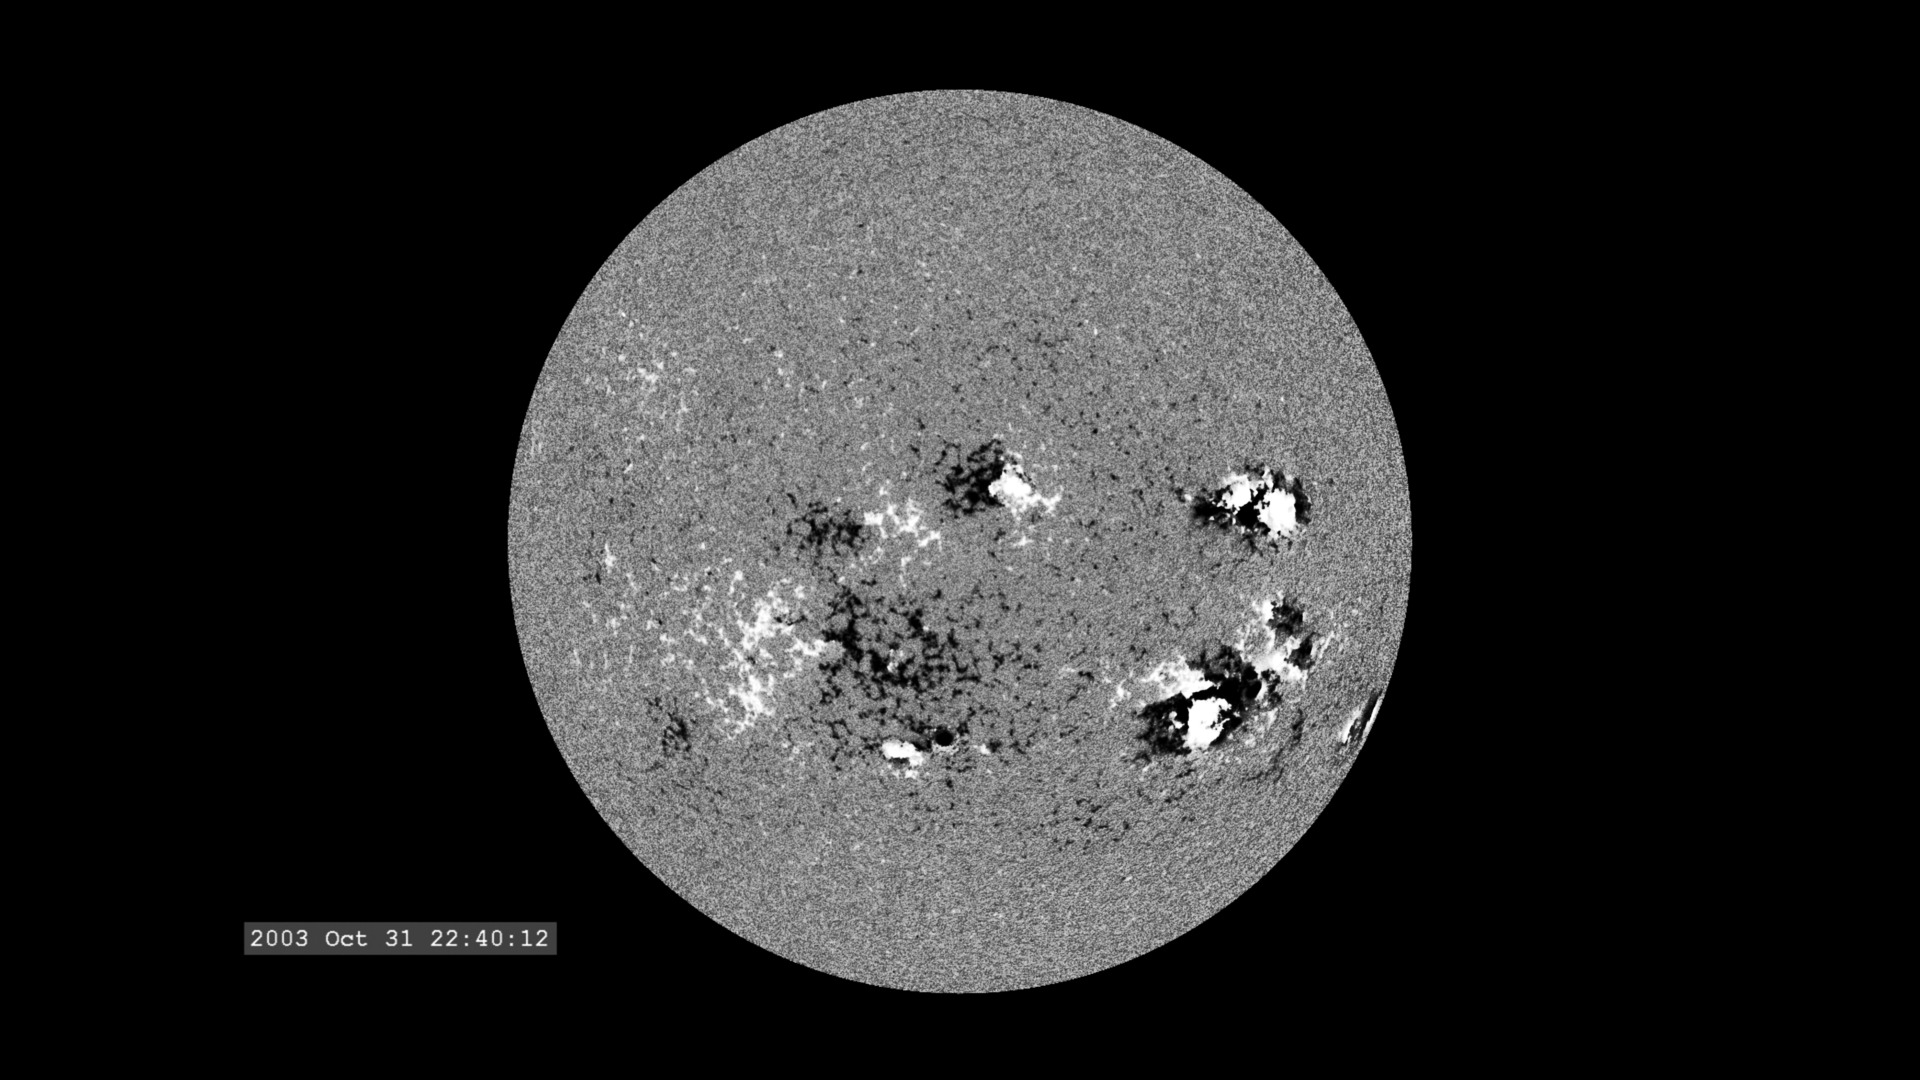
Halloween 2003 Solar Storms: SOHO/MDI Magnetograms
Go to this pageHere is a view of the full solar disk during a two-week period in October and November of 2003 which exhibited some of the largest solar activity events since the advent of space-based solar observing.The Michelson Doppler Interferometer (MDI) takes images of the Sun at five very narrow wavelength bands and four different polarizations in visible light. For this sequence, the images are processed in a form that reveals the magnetic field strength on the solar photosphere. Other combinations of the images act as white-light images and dopplergrams (which measure the velocity of the solar 'surface').This movie is part of a series of movies with matching cadence designed to play synchronously with each other. The other movies in this series are Halloween 2003 Solar Storms: SOHO/EIT Ultraviolet, 195 angstroms Halloween 2003 Solar Storms: SOHO/EIT Ultraviolet, 304 angstroms Halloween 2003 Solar Storms: SOHO/MDI Continuum Halloween 2003 Solar Storms: SOHO/EIT and SOHO/LASCO For more information, visit the SOHO project page.. ||
- ID: 3504 Visualization
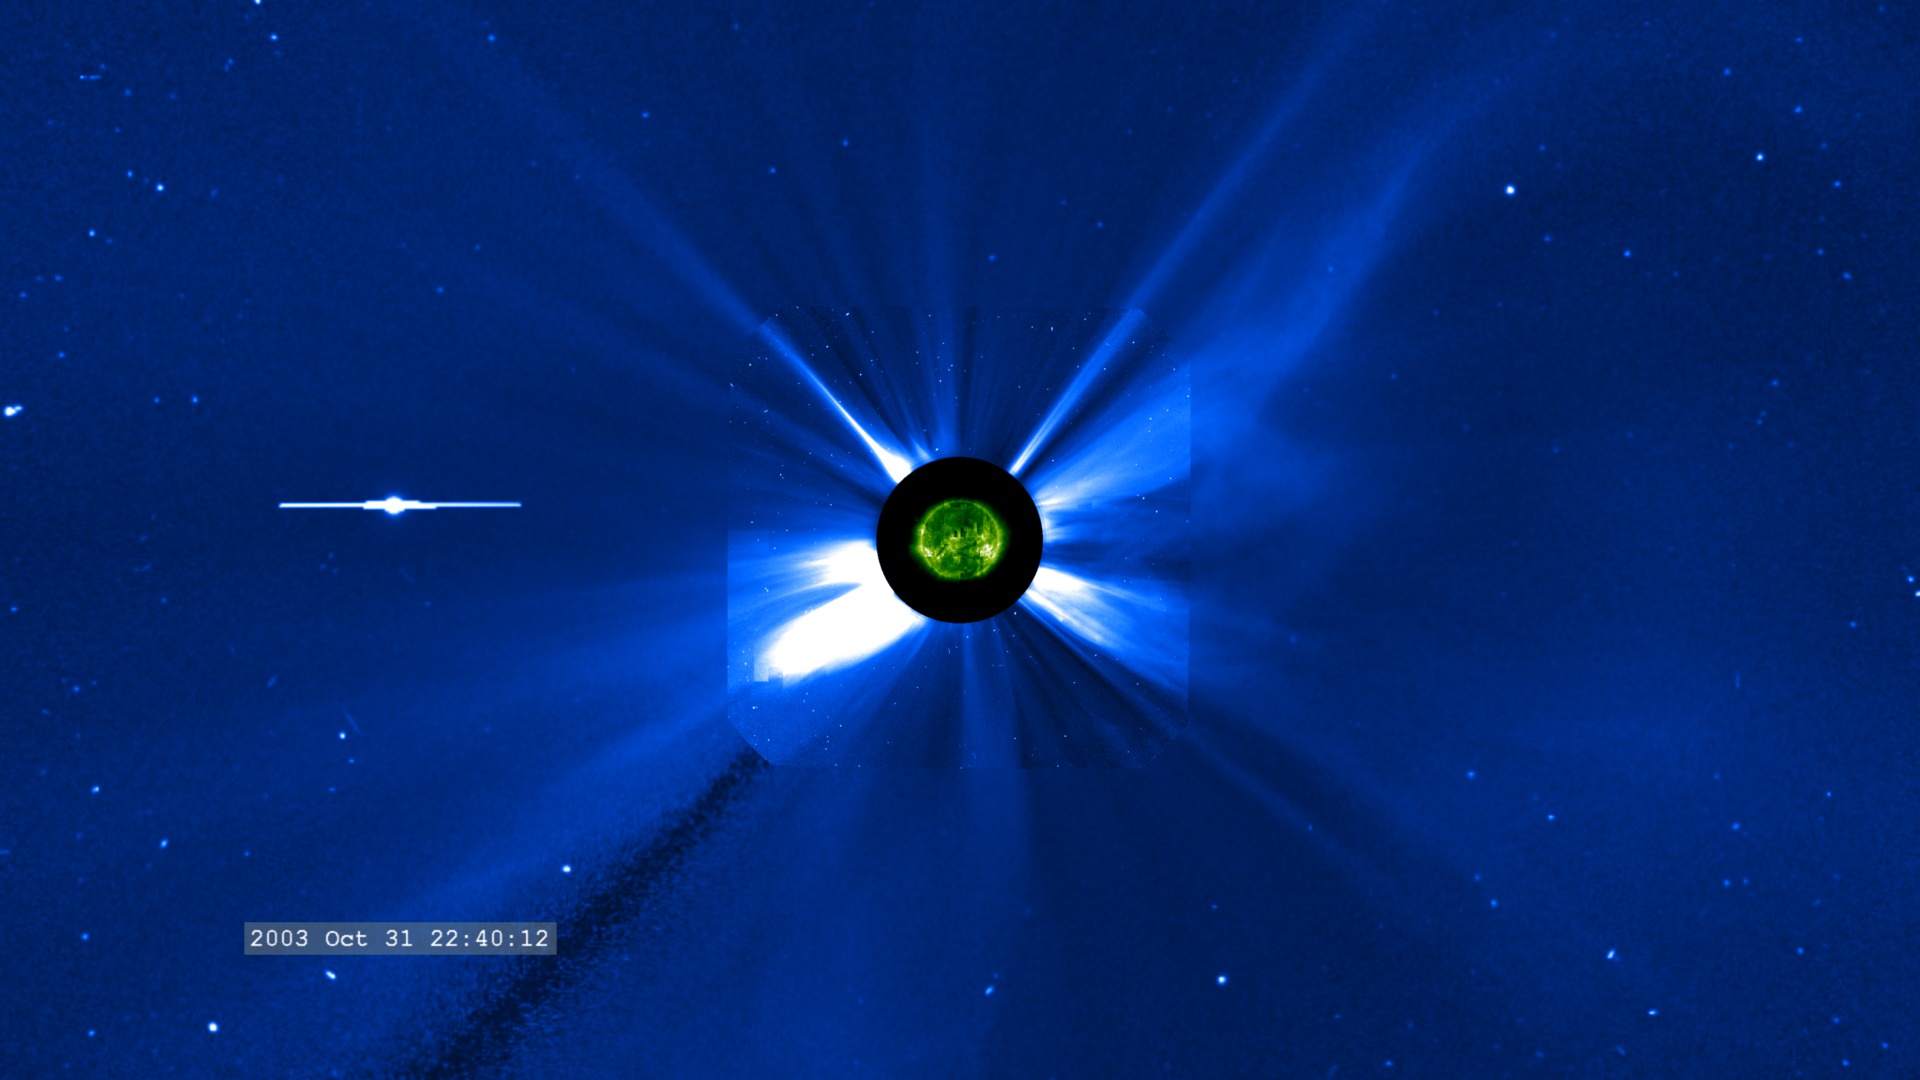
Halloween 2003 Solar Storms: SOHO/EIT and SOHO/LASCO
Go to this pageHere is a view of the solar disk in 195 Å ultraviolet light (colored green in this movie) and the Sun's extended atmosphere, or corona, (blue and white in this movie). The corona is visible to the SOHO/LASCO coronagraph instruments, which block the bright disk of the Sun so the significantly fainter corona can be seen. In this movie, the inner coronagraph (designated C2) is combined with the outer coronagraph (C3). This movie covers a two week period in October and November 2003 which exhibited some of the largest solar activity events since the advent of space-based solar observing.As the movie plays, we can observe a number of features of the active Sun. Long streamers radiate outward from the Sun and wave gently due to their interaction with the solar wind. The bright white regions are visible due to their high density of free electrons which scatter the light from the photosphere towards the observer. Protons and other ionized atoms are there as well, but are not as visible since they do not interact with photons as strongly as electrons. Coronal Mass Ejections (CMEs) are occasionally observed launching from the Sun. Some of these launch particle events which can saturate the cameras with snow-like artifacts.Also visible in the coronagraphs are stars and planets. Stars are seen to drift slowly to the right, carried by the relative motion of the Sun and the Earth. The planet Mercury is visible as the bright point moving left of the Sun. The horizontal 'extension' in the image is called 'blooming' and is due to a charge leakage along the readout wires in the CCD imager in the camera.This movie is part of a series of movies with matching cadence designed to play synchronously with each other. The other movies in this series are Halloween 2003 Solar Storms: SOHO/EIT Ultraviolet, 195 angstromHalloween 2003 Solar Storms: SOHO/EIT Ultraviolet, 304 angstromHalloween 2003 Solar Storms: SOHO/MDI Continuum Halloween 2003 Solar Storms: SOHO/MDI Magnetograms For more information, visit the SOHO project page.. ||
- ID: 2959 Visualization
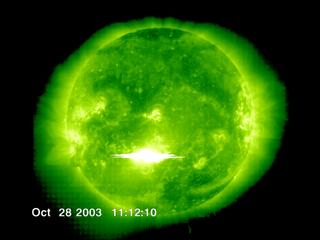
Halloween Solar Storms from SOHO/EIT, 195 Angstroms
Go to this pageThis view from SOHO/EIT in the 195 angstrom band, shows the multitude of solar flares released in the Fall of 2003 as a group of active regions rotated back into view. This movie is synchronized to play with animation IDs 2960 and 2961. For more information on how X-ray solar flares are classified (B, C, M, X), visit SpaceWeather.com. ||
- ID: 2960 Visualization
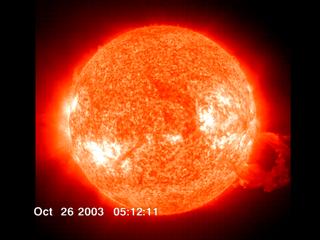
Halloween Solar Storms from SOHO/EIT, 304 Angstroms
Go to this pageThis view from SOHO/EIT in the 304 angstrom band, shows a group of active regions rotating back into view. This movie is synchronized to play with animation IDs 2959 and 2961. One obvious difference is that solar flares are not as visible at this wavelength than at the 195 angstrom band. The 304 angstrom filter was not used as frequently as the 195 angstrom filter, so this movie has more jumps in its time coverage. For more information on how X-ray solar flares are classified (B, C, M, X), visit SpaceWeather.com. ||
- ID: 2961 Visualization
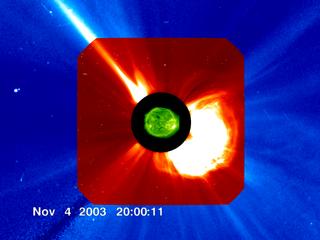
Halloween Solar Storms from SOHO/EIT and SOHO/LASCO
Go to this pageThis movie is a combination of SOHO/EIT at 195 angstroms as well as the LASCO/C2 and C3 cameras. At this scale we can see the flashes from solar flares in SOHO/EIT (green) and the subsequent coronal mass ejections in SOHO/LASCO/C2 (red) and SOHO/LASCO/C3 (blue). This movie is synchronized to play with animation IDs 2960 and 2959. For more information on how X-ray solar flares are classified (B, C, M, X), visit SpaceWeather.com. ||