Cryospheric Animations
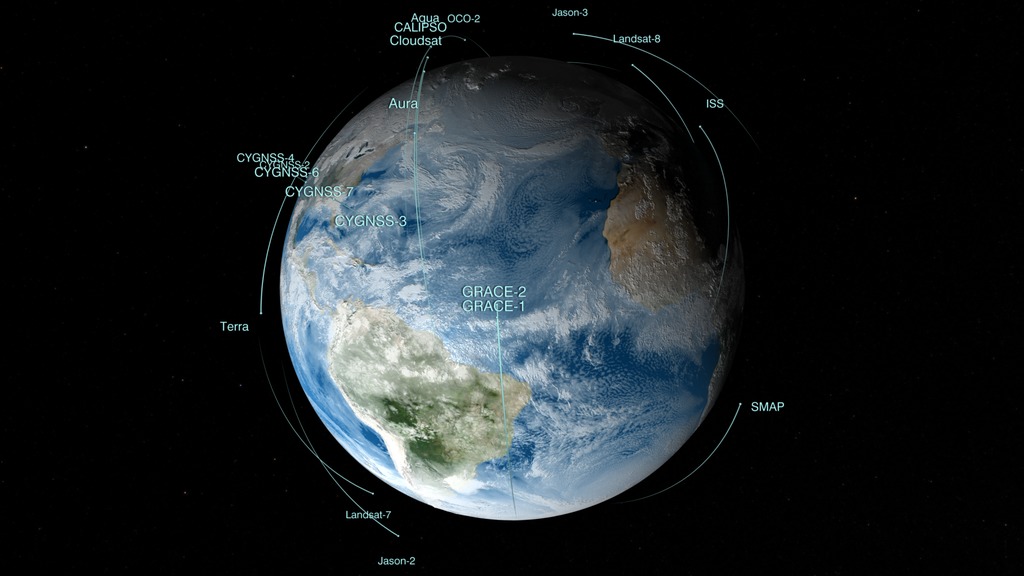
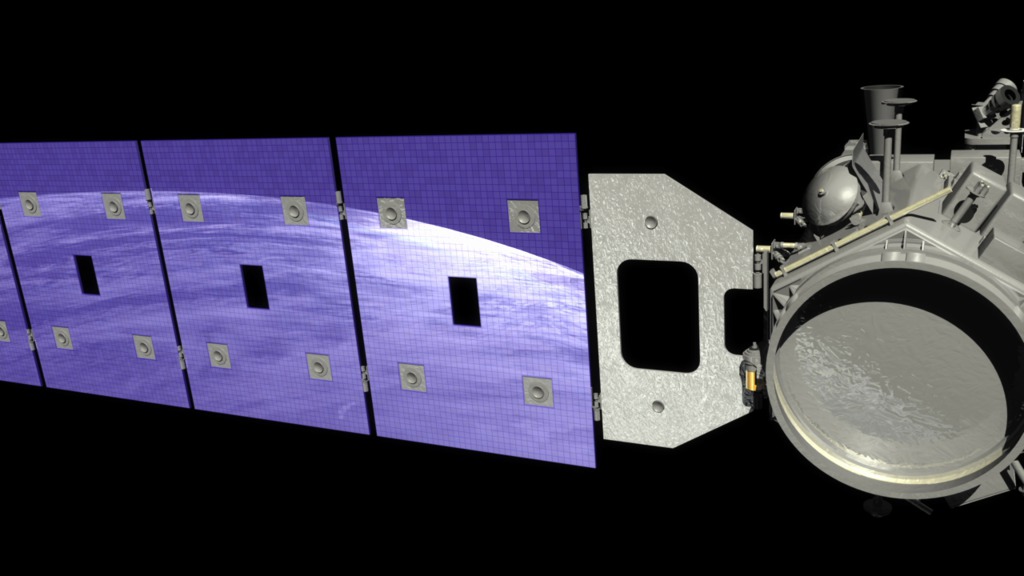
Satellites and Instrumentation
- ID: 30496
 Hyperwall Visual
 - ID: 20204
 Animation
 - ID: 10757
 Produced Video
 - ID: 3818
 Visualization
 - ID: 10518
 Produced Video
 - ID: 2743
 Visualization
 - ID: 2742
 Visualization
 - ID: 2741

- ID: 2747
 Visualization
 - ID: 2746
 Visualization
 - ID: 2745
- ID: 20024
 Animation
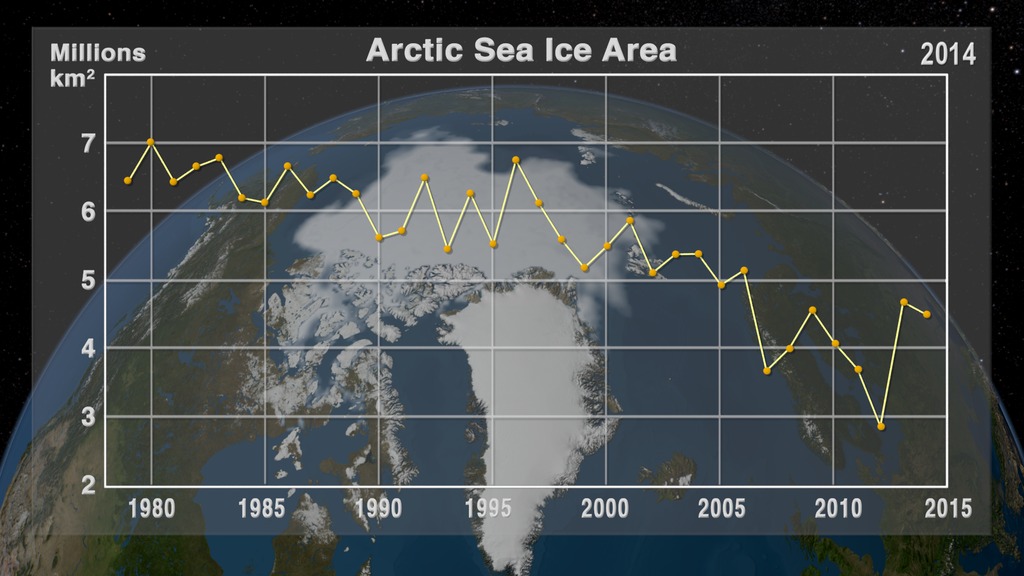
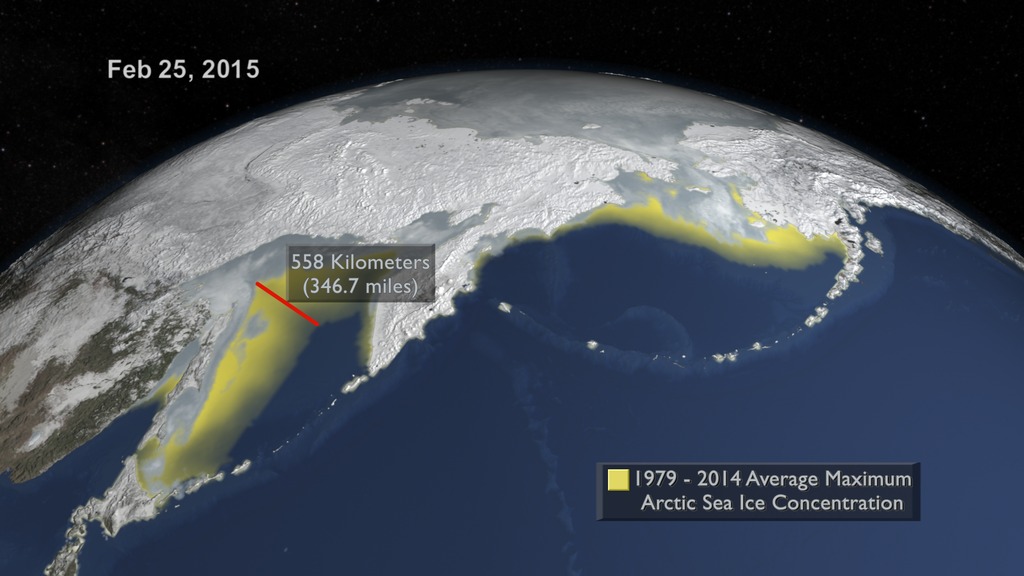
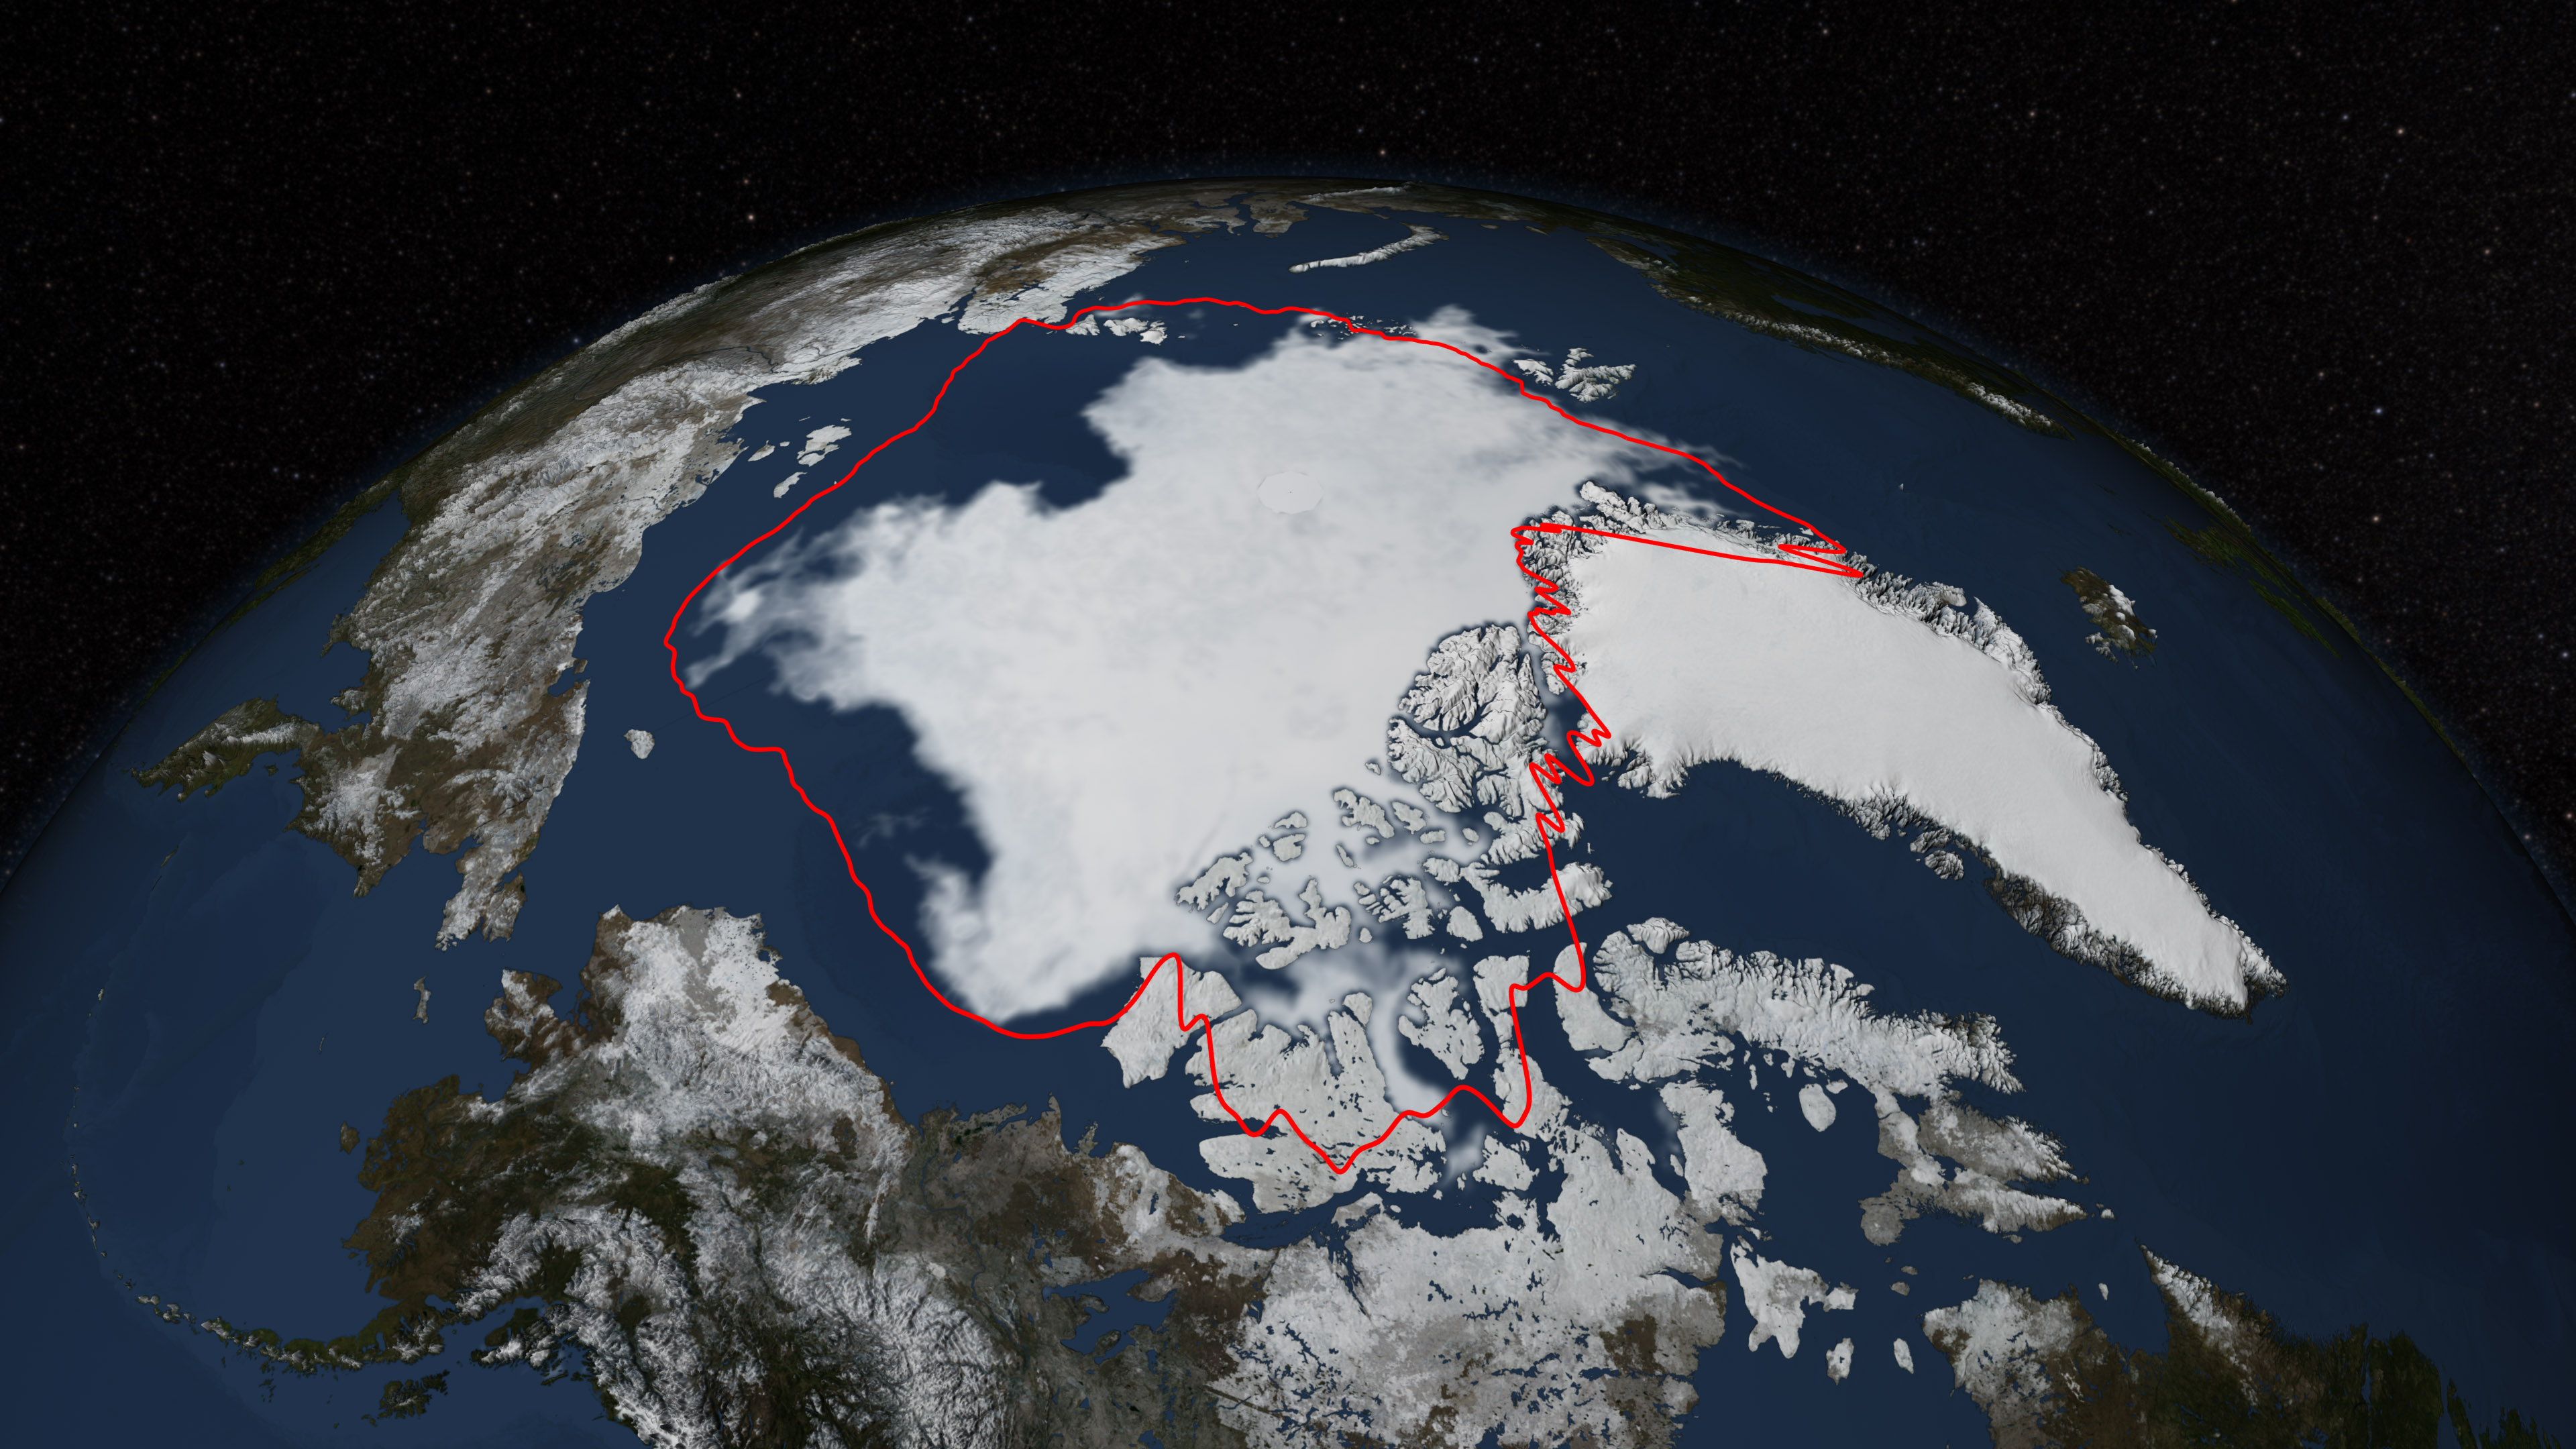
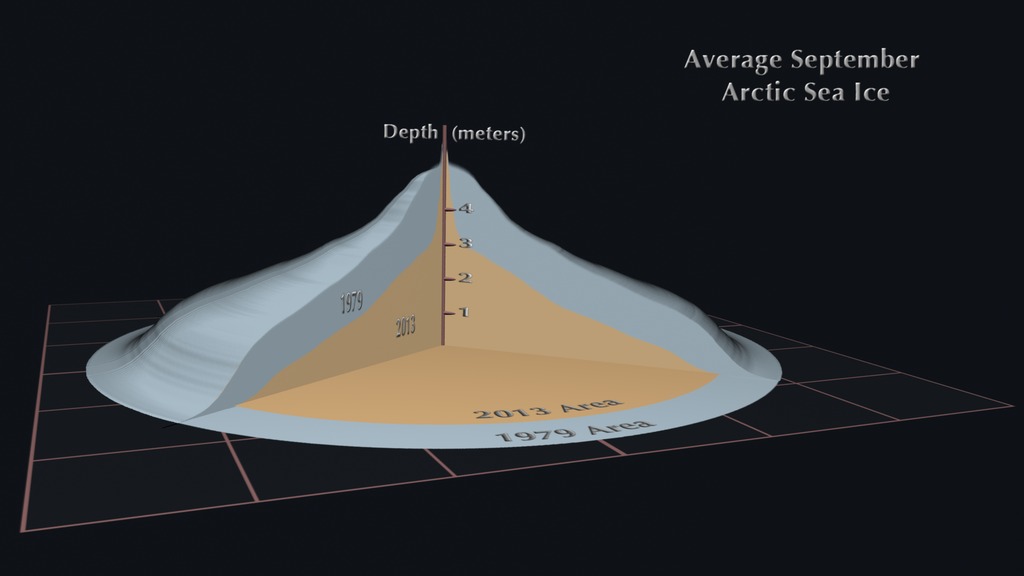
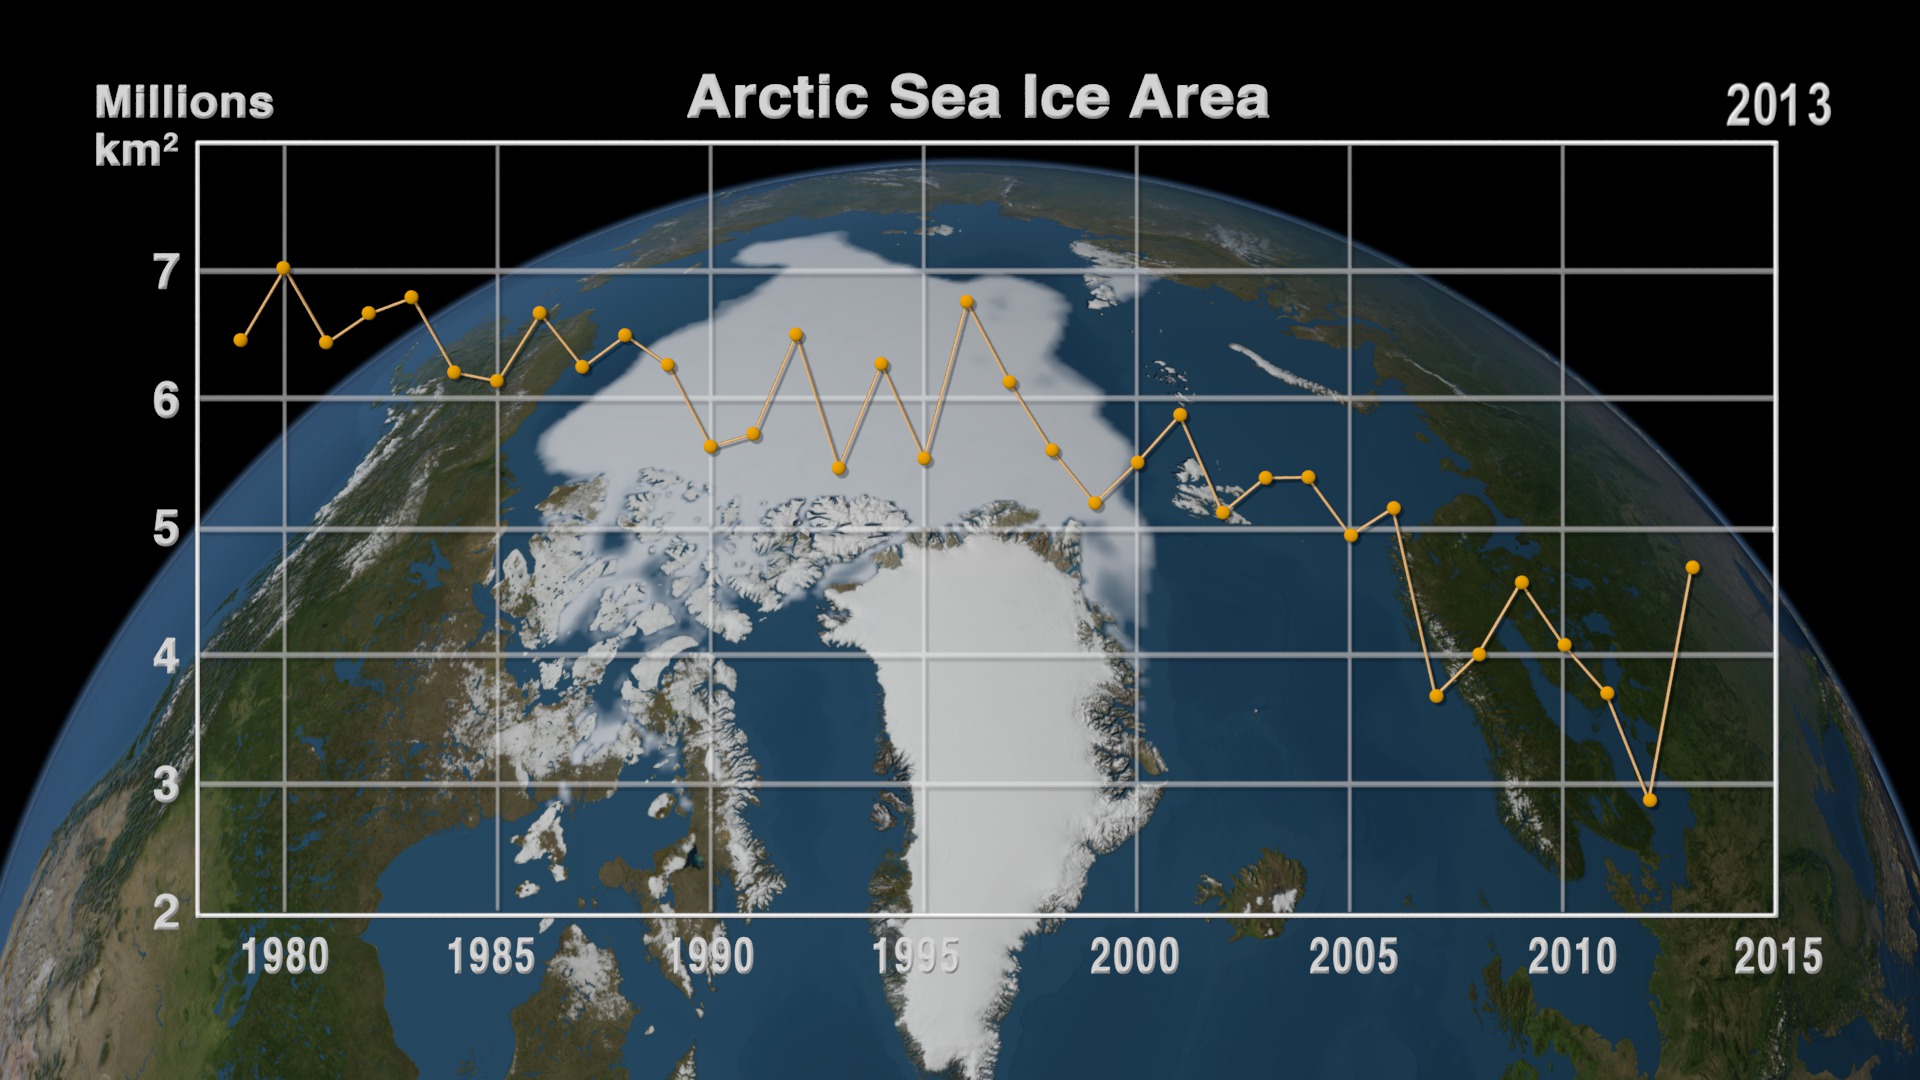
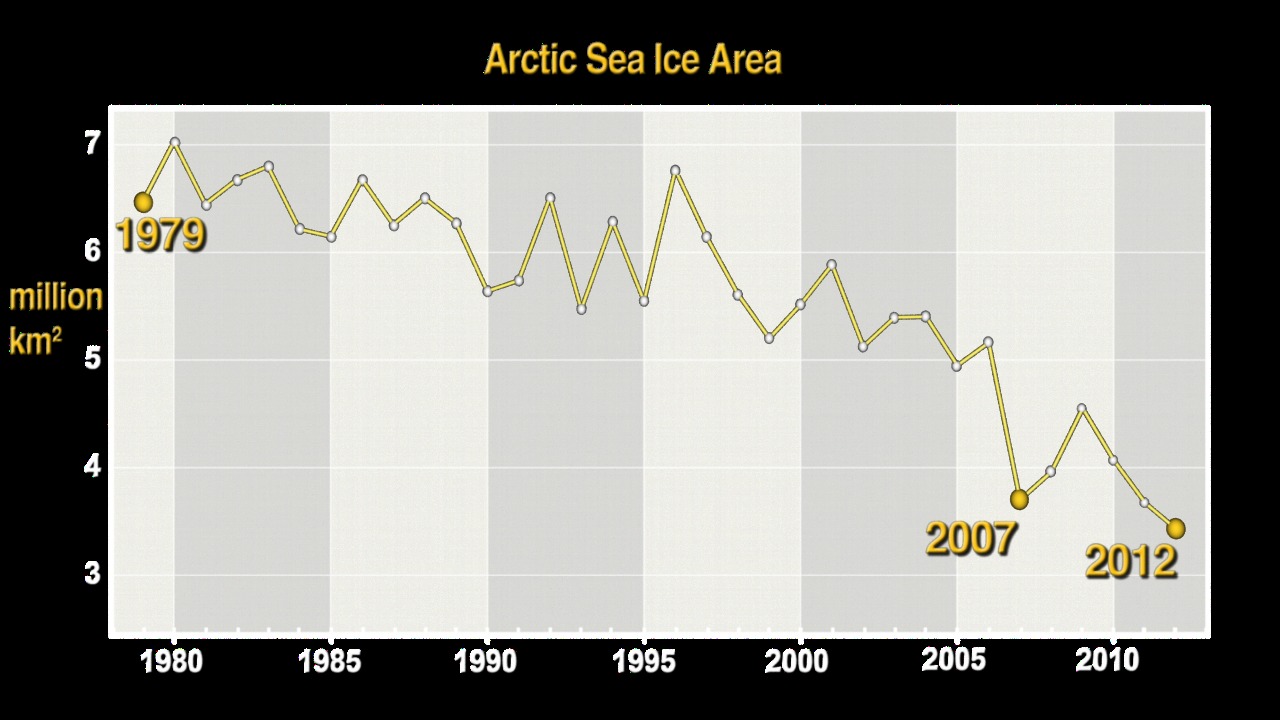
Arctic Sea Ice
- ID: 4355
 Visualization
 - ID: 4301
 Visualization
 - ID: 4281
 Visualization
 - ID: 4215
 Visualization
 - ID: 4206
- ID: 4131
 Visualization
 - ID: 4052
- ID: 4004
- ID: 3992
 Visualization
 - ID: 3991
 Visualization
 - ID: 3915
 Visualization
 - ID: 3916
 Visualization
 - ID: 3944
 Visualization
 - ID: 3824
 Visualization
 - ID: 3767
 Visualization
 - ID: 3698
 Visualization
 - ID: 10492
 Produced Video
 - ID: 3631
 Visualization
 - ID: 3593

- ID: 3592
 Visualization
 - ID: 3589
 Visualization
 - ID: 3498
- ID: 3753
 Visualization
 - ID: 3563
 Visualization
 - ID: 3556
 Visualization
 - ID: 3561
 Visualization
 - ID: 10353
 Produced Video
 - ID: 3368
 Visualization
 - ID: 3345
Antarctic Sea Ice
- ID: 4219 Visualization
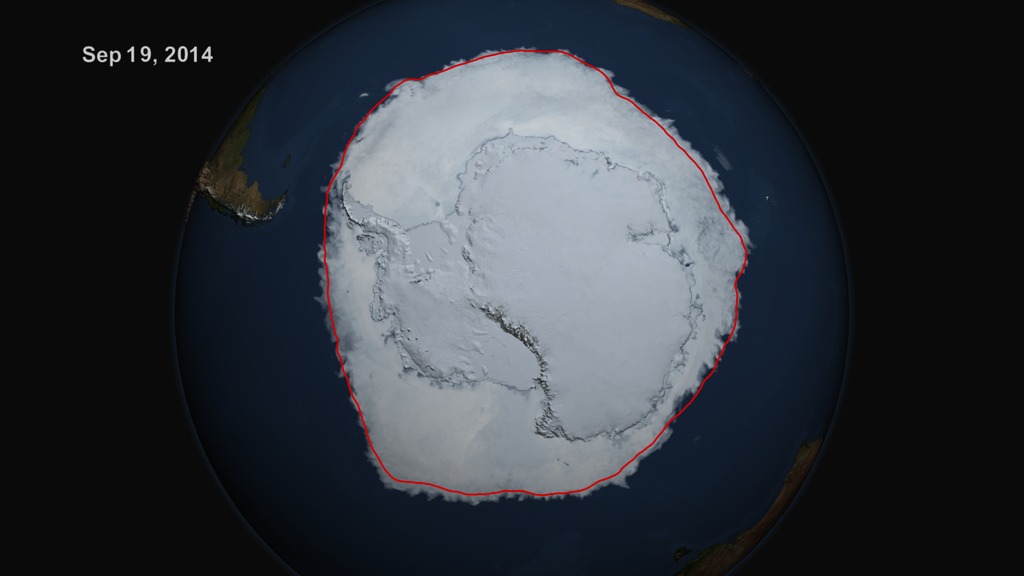
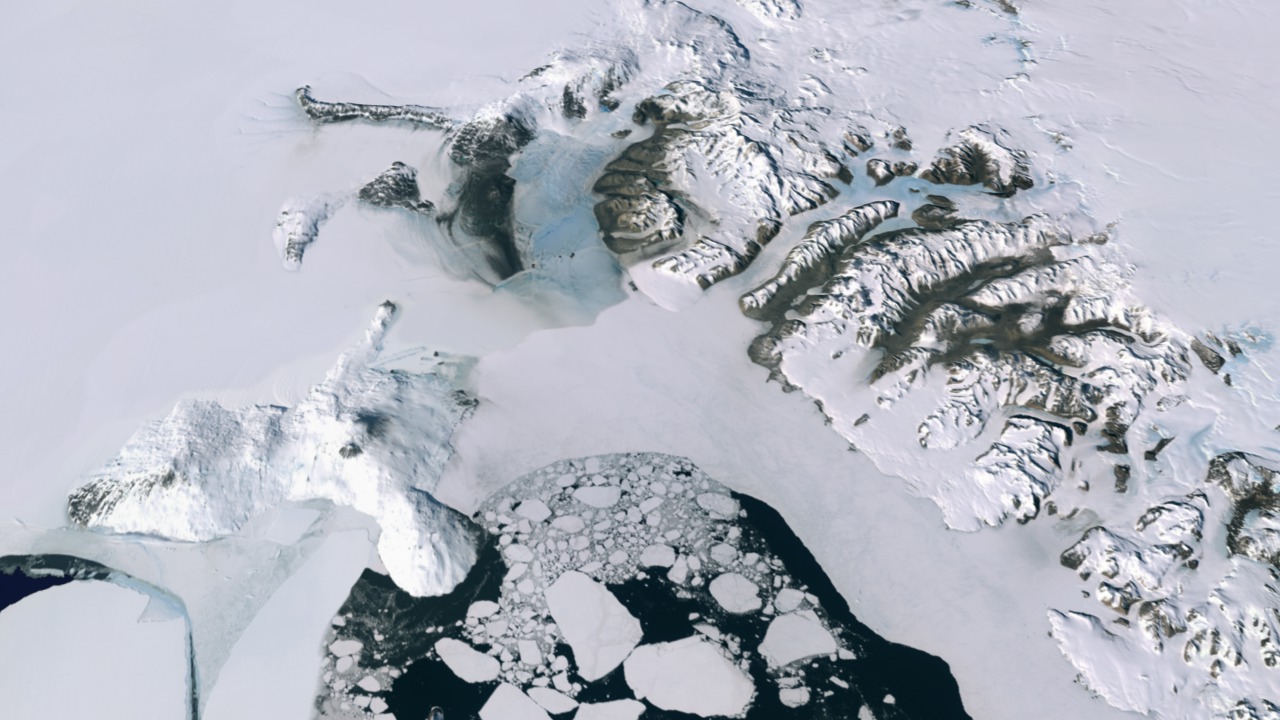
Maximum Antarctic Sea Ice 2014
Go to this pageIn this animation we see the Antarctic sea ice expansion from March, 21, 2014 through September 19, 2014, the date on which the sea ice reached its maximum annual extent. Over the water, the opacity of the sea ice is determined by a running 3-day maximum of the AMSR2 sea ice concentration. The blueish white color of the sea ice is a false color derived from a 3-day running minimum of the AMSR2 89 GHz brightness temperature. Over the Antarctic continent, the LIMA data shown here uses the pan-chromatic band and has a resolution of 240 meters per pixel. ||
- ID: 3944 Visualization
Pulse of Snow and Sea Ice
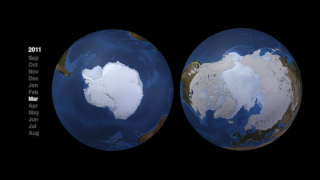
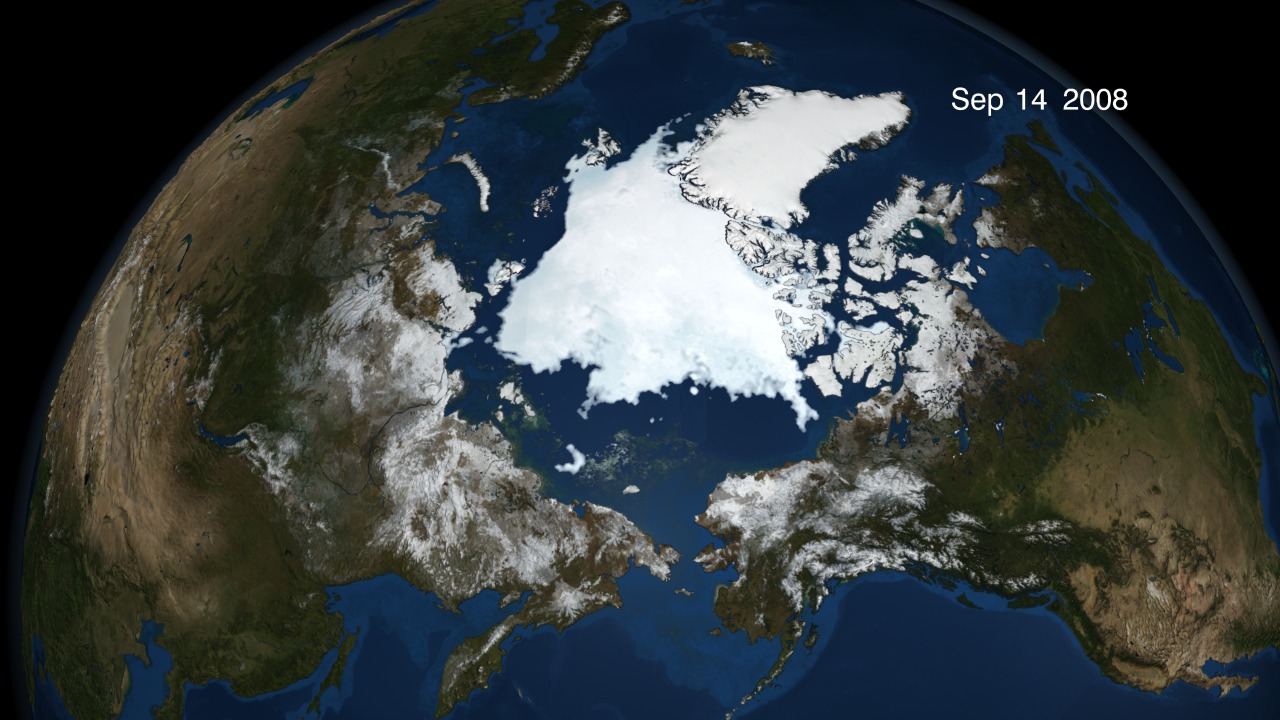
Go to this pageSnow and sea ice in the Northern and Southern Hemispheres pulse at exact opposite times of year, constantly out of phase. ||
- ID: 3862 Visualization
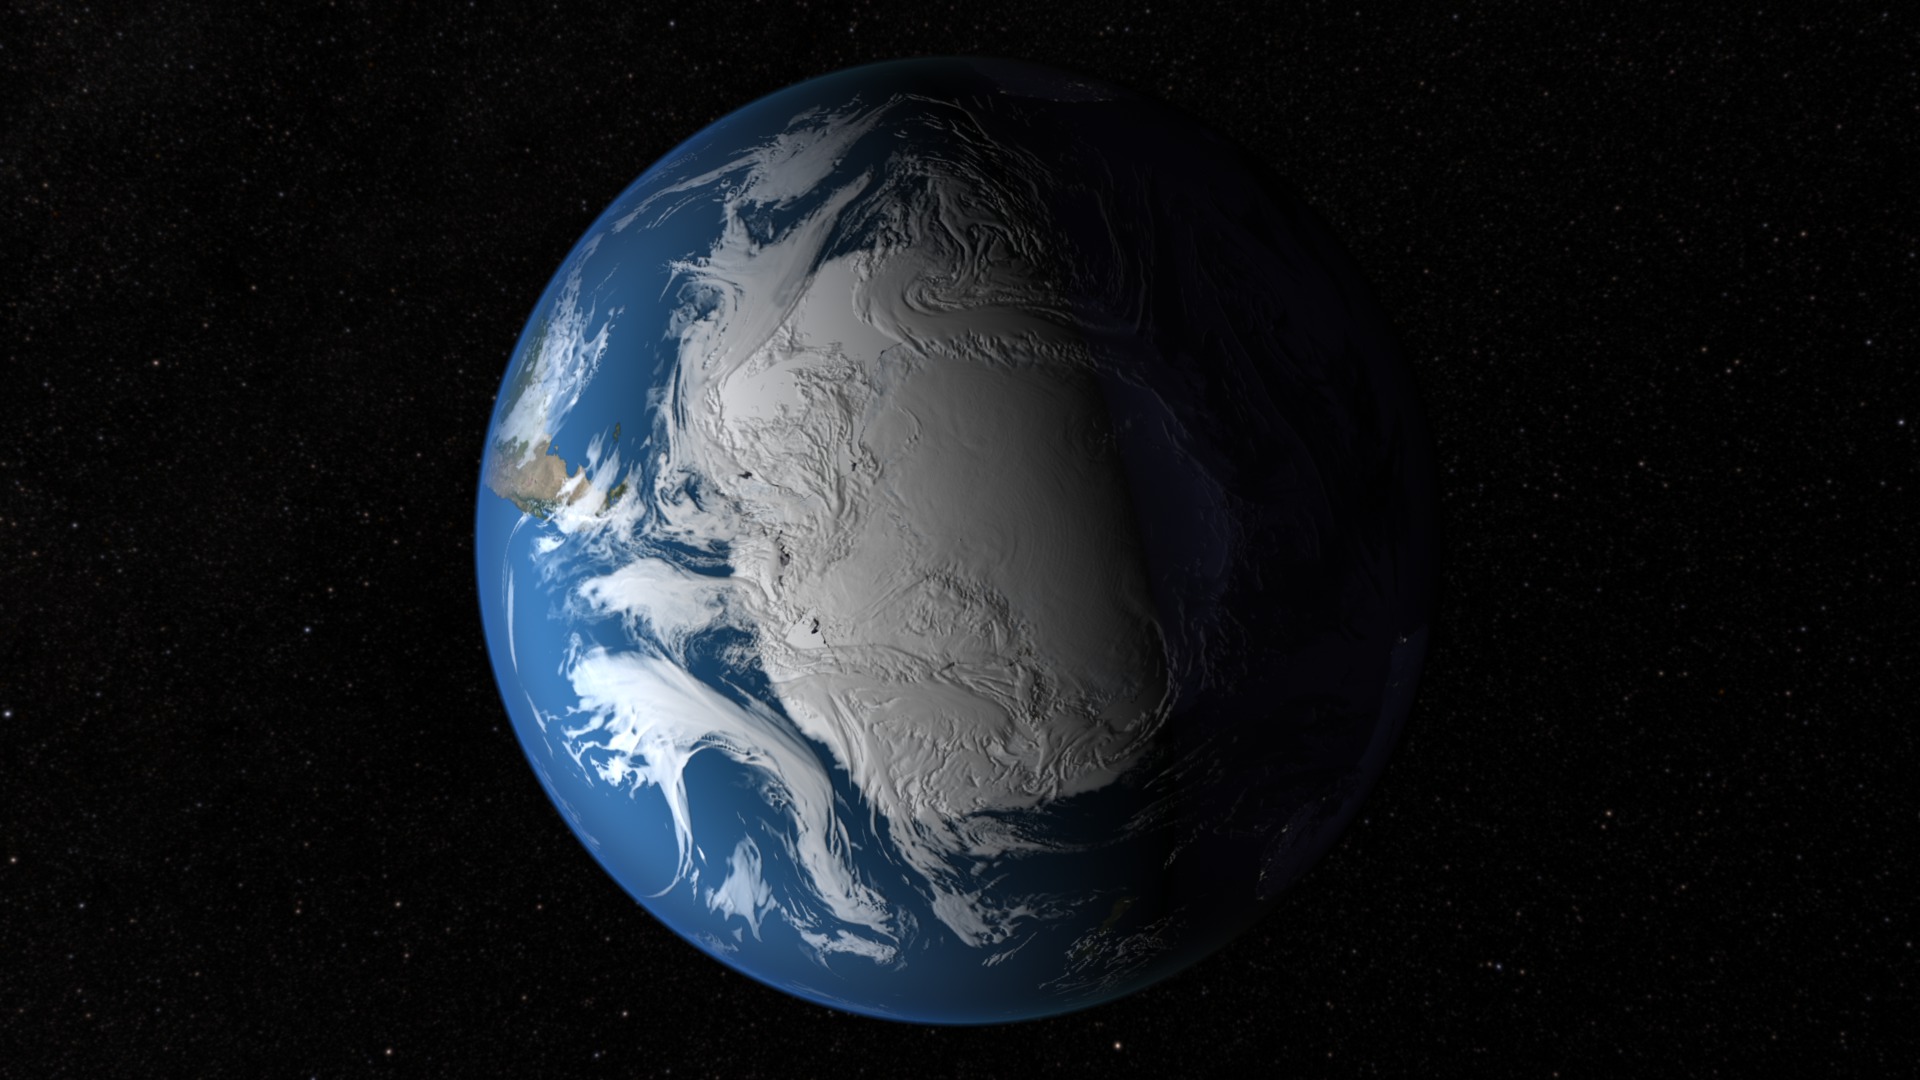
Seasonal Antarctic Sea Ice
Go to this pageAntarctica is a land mass surrounded by an ocean which allows the sea ice here to move more freely than it does in the Northern Hemisphere. Because there are no surrounding continents to limit its movement, the sea ice is free to float northward into warmer waters where it eventually melts. As a result, almost all of the sea ice that forms during the Antarctic winter melts during the summer. During the winter, up to 18 million square kilometers (6.9 million square miles) of ocean is covered by sea ice, but by the end of summer, only about 3 million square kilometers (1.1 million square miles) of sea ice remain. Antarctic sea ice extent are characterized by fairly large variations from year to year. The monthly average extent can vary by as much as 1 million square kilometers (386,102 square miles) from the year-to-year monthly average. The AMSR-E instrument on the Aqua satellite acquires high resolution measurements of the 89 GHz brightness temperature near the poles. Because this is a passive microwave sensor which is not so sensitive to atmospheric effects, this sensor is able to observe the entire polar region every day, even through clouds and snowfall. The false color in this animation of sea ice surrounding the South Pole is derived from the daily AMSR-E 6.25 km 89 GHz brightness temperature while the sea ice extent is derived from the daily AMSR-E 12.5 km sea ice concentration. The sea ice extent shown is generated using a three day moving average where the daily sea ice concentration is at least 15%. This animation portrays the changes in the sea ice from May 26, 2009 through July 29, 2010. ||
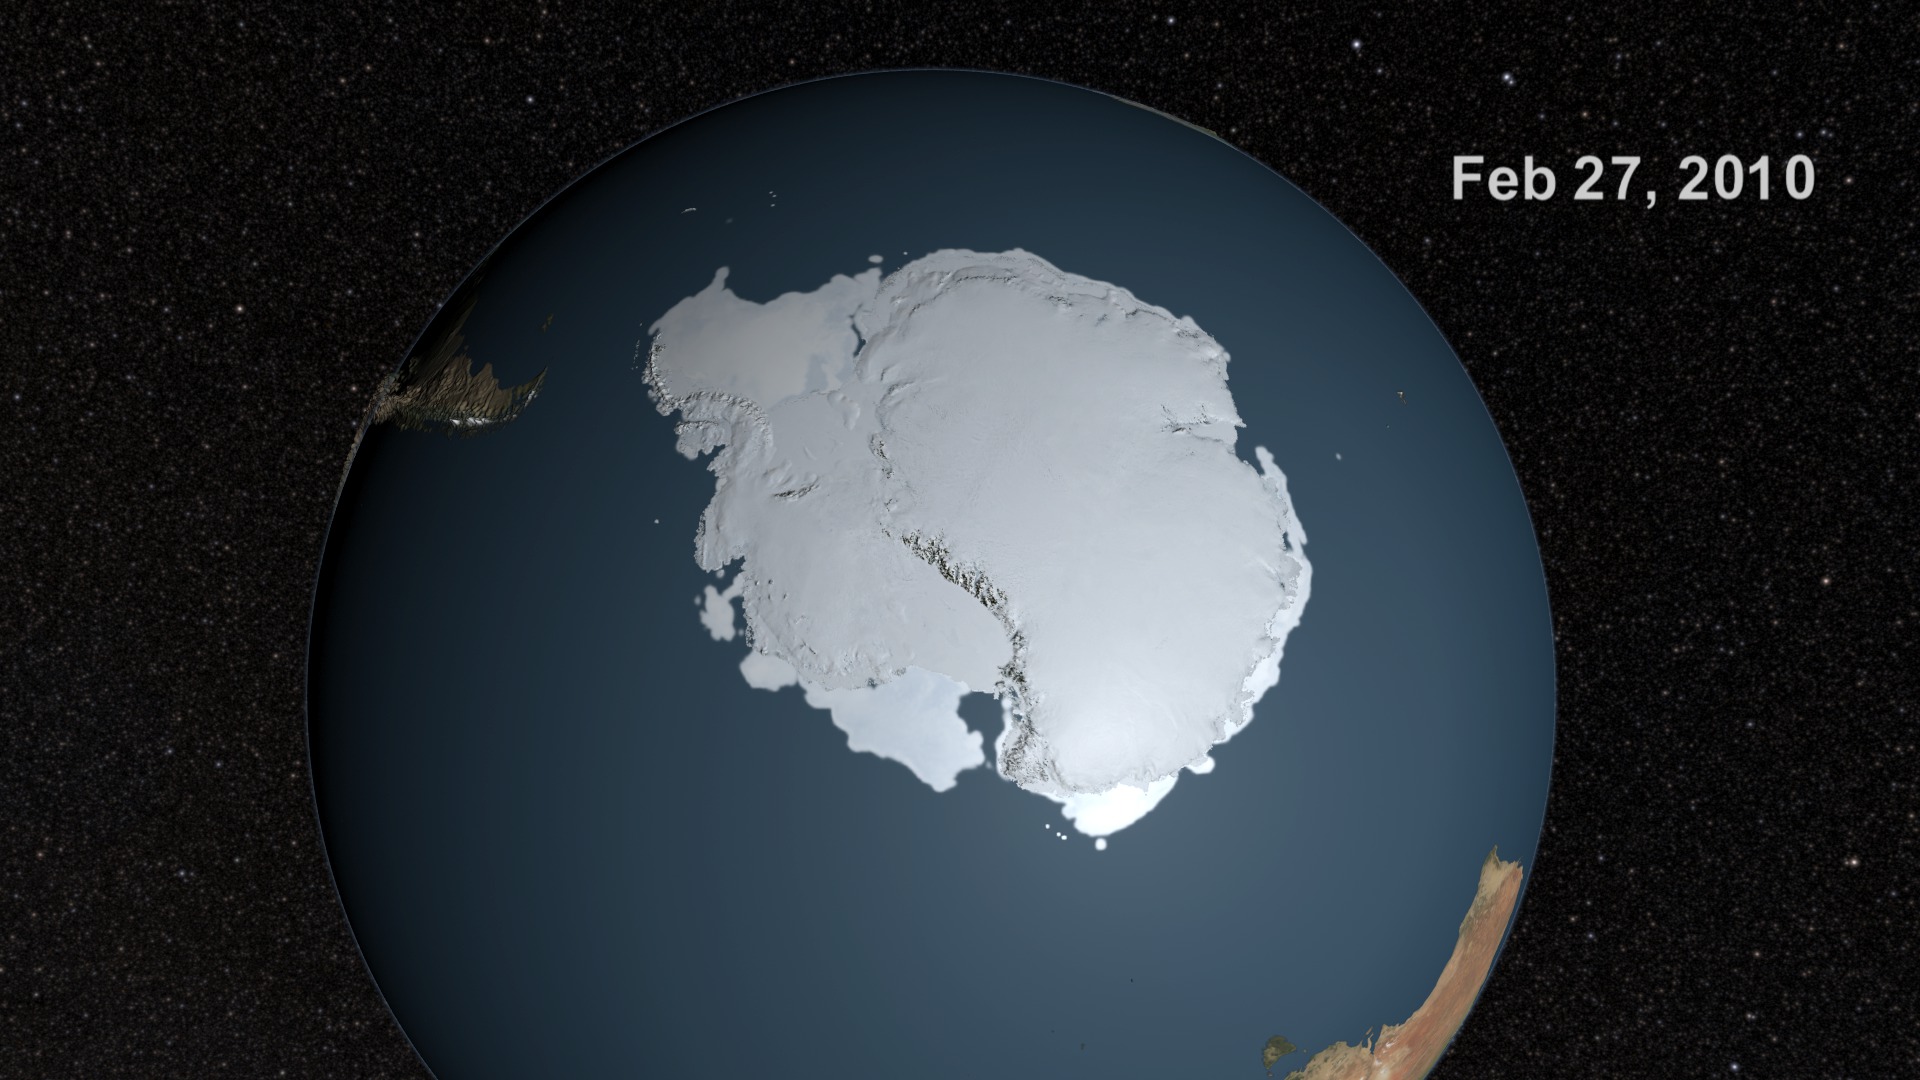
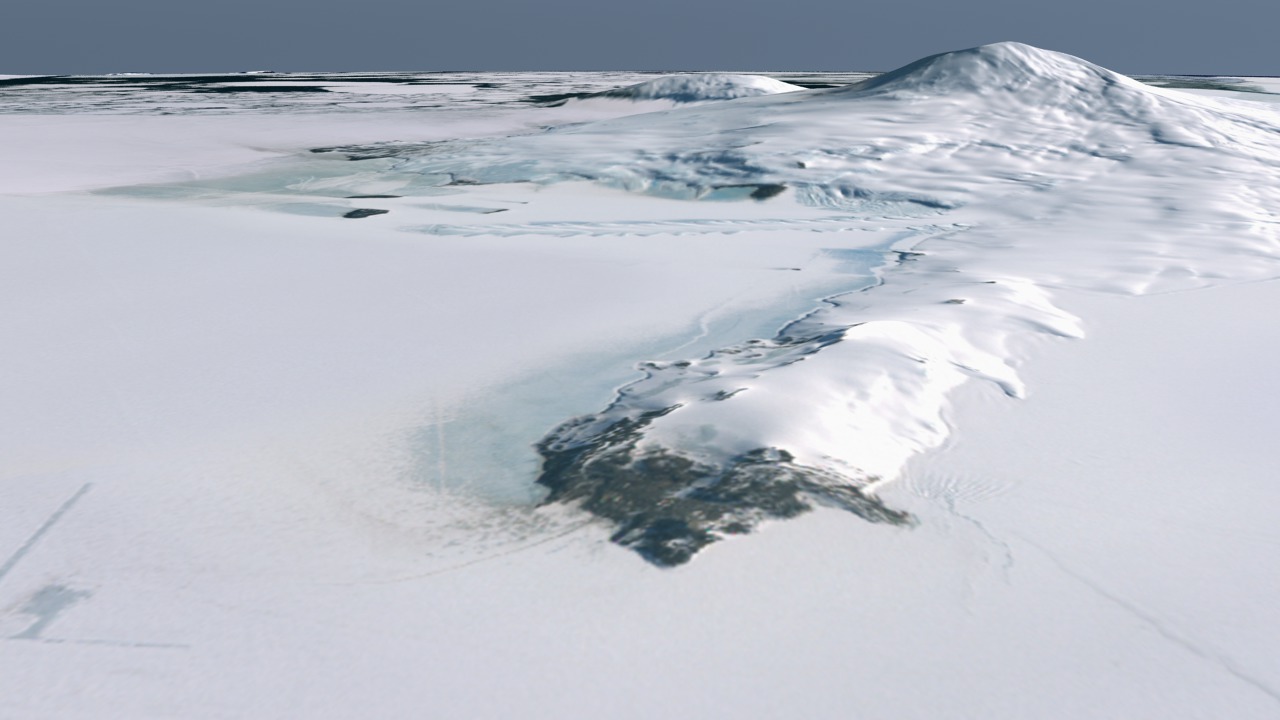
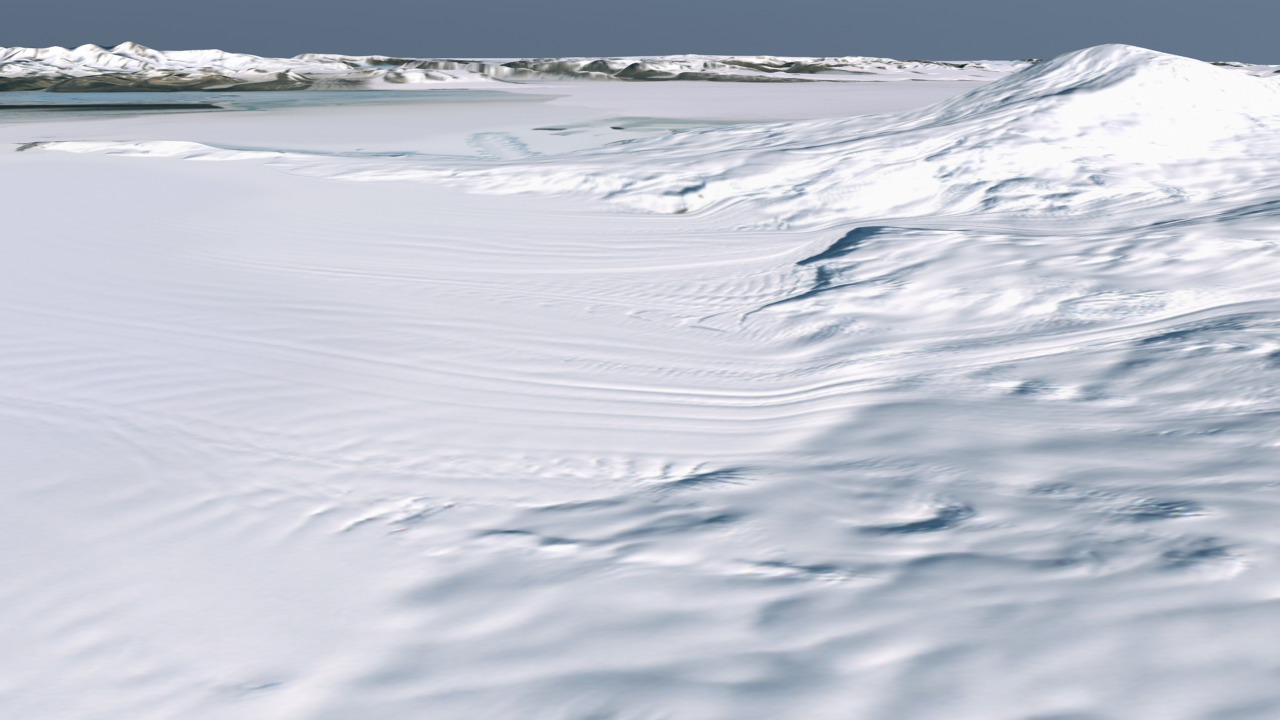
- ID: 3854 Visualization
AMSR-E Antarctic Sea Ice
Go to this pageSea ice is frozen seawater floating on the surface of the ocean. Some sea ice is semi-permanent, persisting from year to year, and some is seasonal, melting and refreezing from season to season. The sea ice cover reaches its minimum extent at the end of each summer and the remaining ice is called the perennial ice cover.In this animation, the Antarctic sea ice progresses through time from May 26, 2009 through July 31, 2010. Over the water, Arctic sea ice changes from day to day showing a running 3-day average sea ice concentration in the region where the concentration is greater than 15%. The blueish white color of the sea ice is derived from a 3-day running minimum of the AMSR-E 89 GHz brightness temperature. Over the Antarctic continent, the LIMA data shown here uses the pan-chromatic band and has a resolution of 240 meters per pixel. The Landsat Image Mosaic of Antarctica (LIMA) is a data product funded by the National Science Foundation (NSF) and jointly produced by the U.S. Geological Survey (USGS), the British Antarctic Survey (BAS), and the National Aeronautics and Space Administration (NASA). ||
Antarctic Ice Sheet
- ID: 4347
- ID: 4168
 Visualization
 - ID: 30492
 Hyperwall Visual
 - ID: 4126
 Visualization
 - ID: 4103
 Visualization
 - ID: 3948
- ID: 3889
 Visualization
 - ID: 3875
 Visualization
 - ID: 3848
- ID: 10860
 Produced Video
 - ID: 3803
 Visualization
 - ID: 3414
 Visualization
 - ID: 3415
 Visualization
 - ID: 3416
- ID: 3417
 Visualization
 - ID: 3418
 Visualization
 - ID: 20100
 Animation
 - ID: 3123
 Visualization
Other Glaciers
- ID: 11030 Produced Video
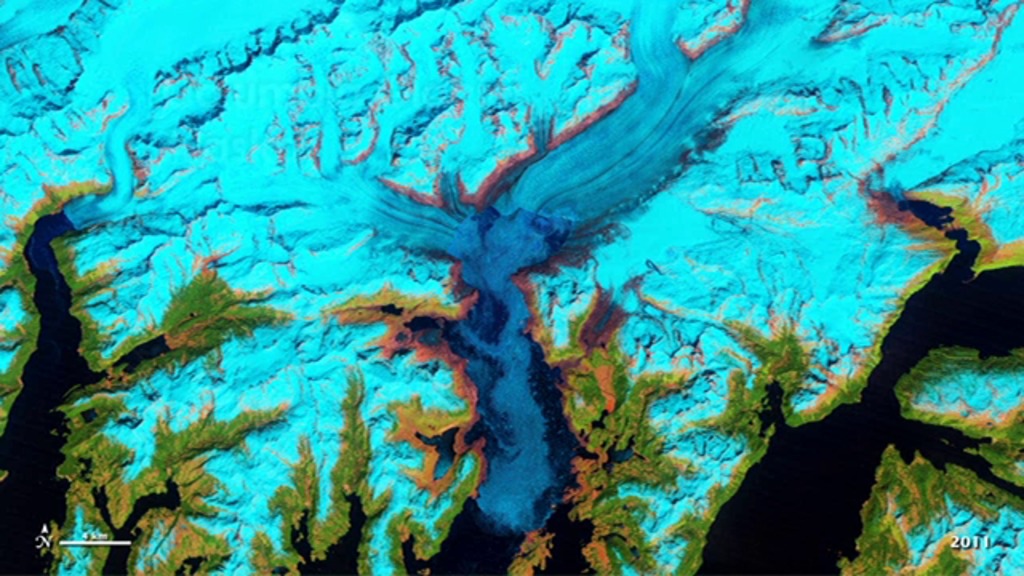
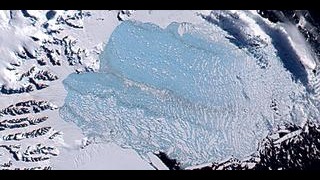
Columbia Glacier, Alaska, 1986-2011
Go to this pageThe Columbia Glacier in Alaska is one of many vanishing around the world. Glacier retreat is one of the most direct and understandable effects of climate change. The consequences of the decline in alpine glaciers include contributing to global sea level rise. ||
- ID: 2969 Visualization
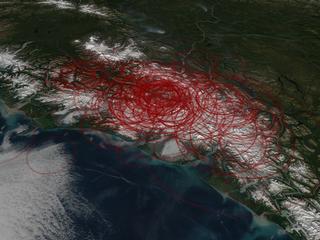
Glaciers Spur Alaskan Earthquakes
Go to this pageIn a new study, NASA and United States Geological Survey (USGS) scientists found that retreating glaciers in southern Alaska may be opening the way for future earthquakes. The study examined the likelihood of increased earthquake activity in southern Alaska as a result of rapidly melting glaciers. As glaciers melt they lighten the load on the Earth's crust. Tectonic plates, that are mobile pieces of the Earth's crust, can then move more freely, which increases the probability of earthquakes occurring in this region. ||
- ID: 3429 Visualization
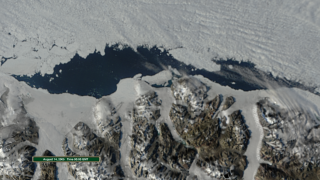
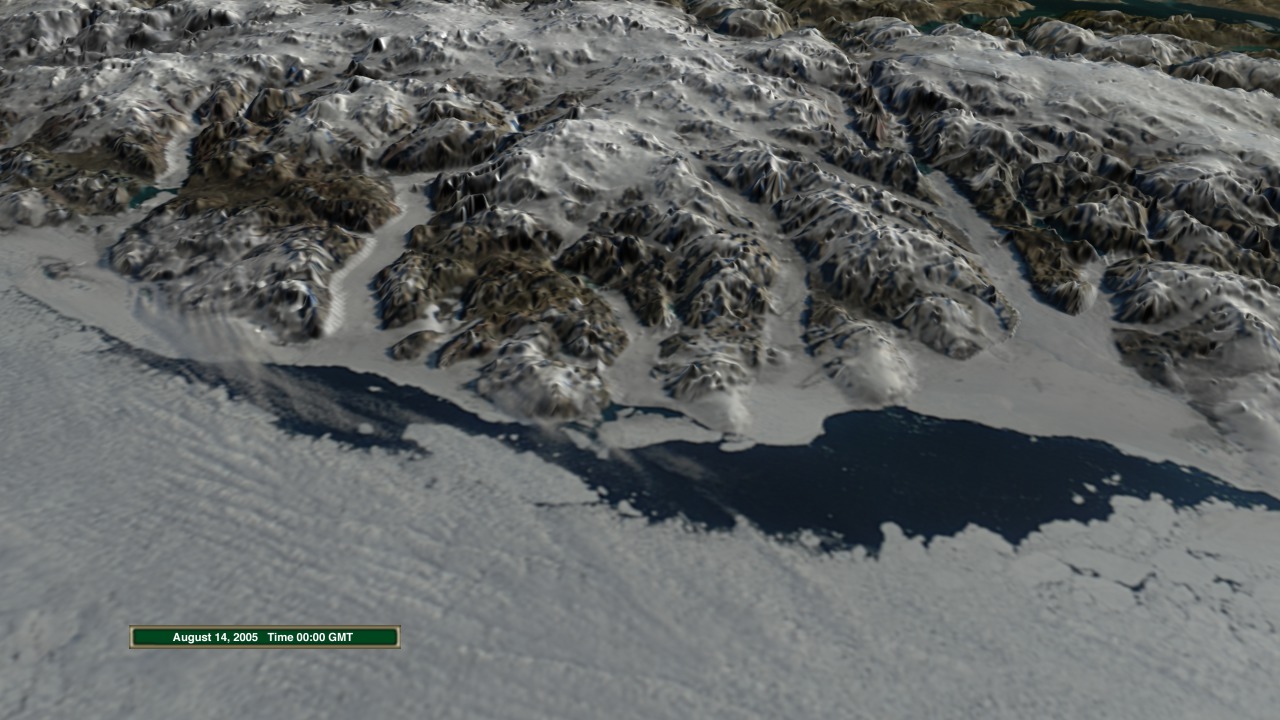
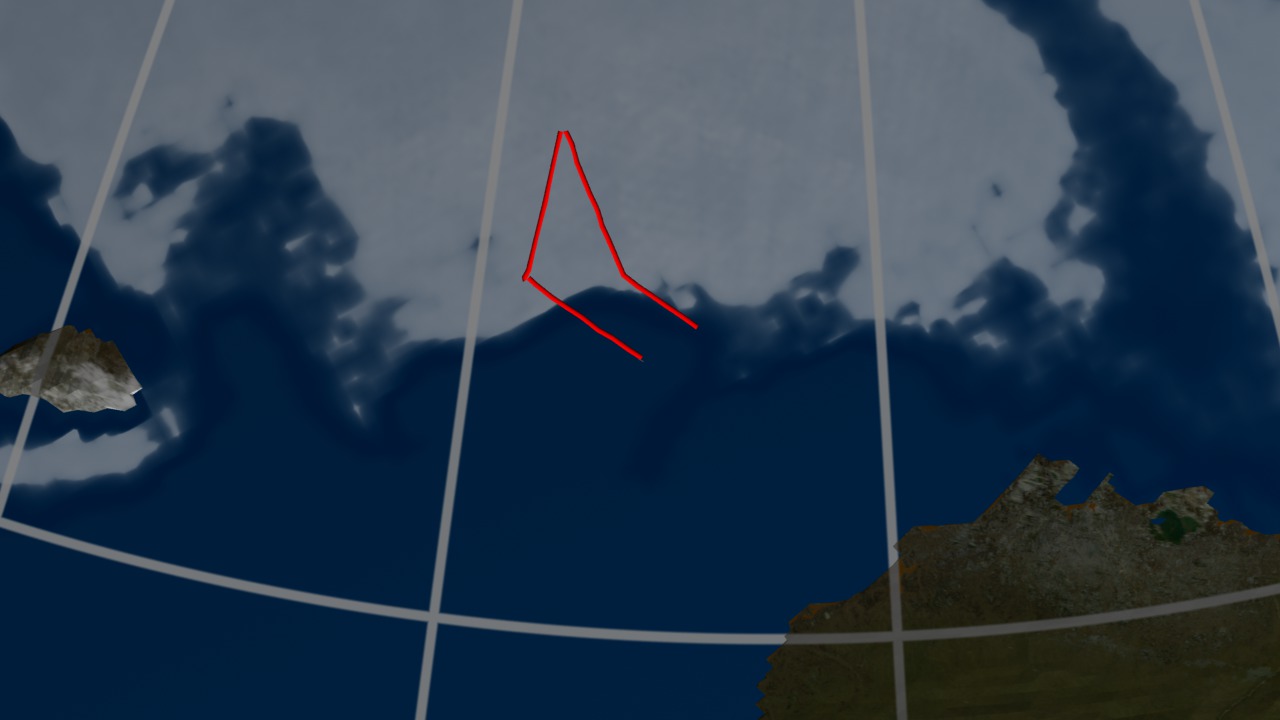
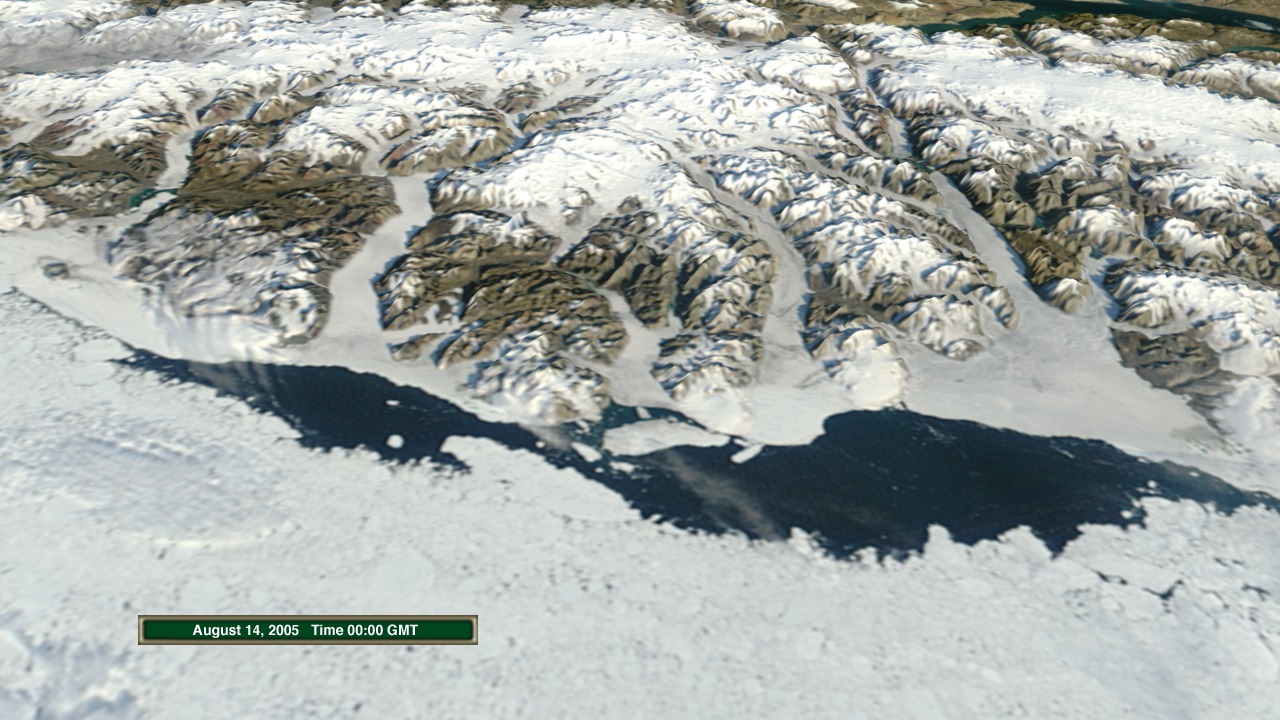
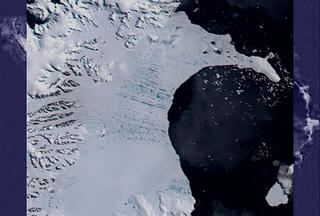
Ayles Ice Shelf Breakup Viewed from Overhead
Go to this pageOn August 13, 2005, almost the entire Ayles Ice Shelf calved from the northern edge of Ellesmere Island. This continues the trend of dramatic loss of these ice shelves over the past century, reducing the remaining ice shelves there from six to five. Since 1900, approximately 90% of the Ellesmere Island ice shelves have calved and floated away. There is insufficient new ice formation to replace the ice that has been lost. The Ayles calving event was the largest in at least the last 25 years; a total of 87.1 sq km (33.6 sq miles) of ice was lost in this event, of which the largest piece was 66.4 sq km (25.6 sq. miles) in area. This piece is equivalent in size to approximately 11,000 football fields or a little larger than the island of Manhattan. ||
- ID: 3430 Visualization
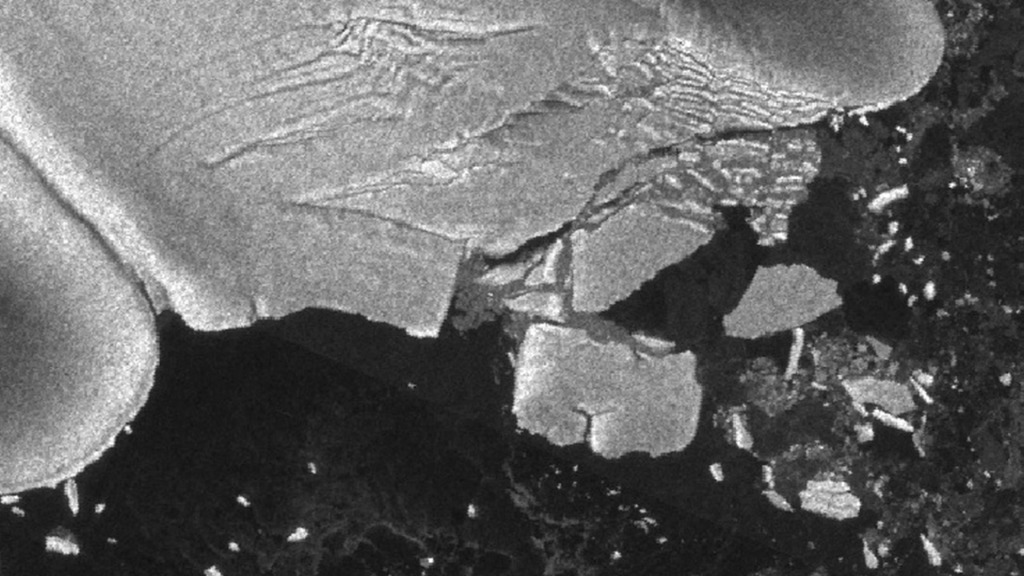
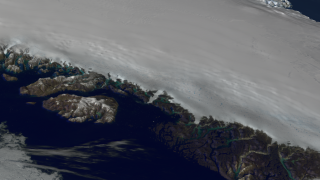
Ayles Ice Shelf Breakup Viewed from Northwest Coastline
Go to this pageOn August 13, 2005, almost the entire Ayles Ice Shelf calved from the northern edge of Ellesmere Island. This continues the trend of dramatic loss of these ice shelves over the past century, reducing the remaining ice shelves there from six to five. Since 1900, approximately 90% of the Ellesmere Island ice shelves have calved and floated away. There is insufficient new ice formation to replace the ice that has been lost. The Ayles calving event was the largest in at least the last 25 years; a total of 87.1 sq km (33.6 sq miles) of ice was lost in this event, of which the largest piece was 66.4 sq km (25.6 sq. miles) in area. This piece is equivalent in size to approximately 11,000 football fields or a little larger than the island of Manhattan. ||
Snow
- ID: 4256 Visualization
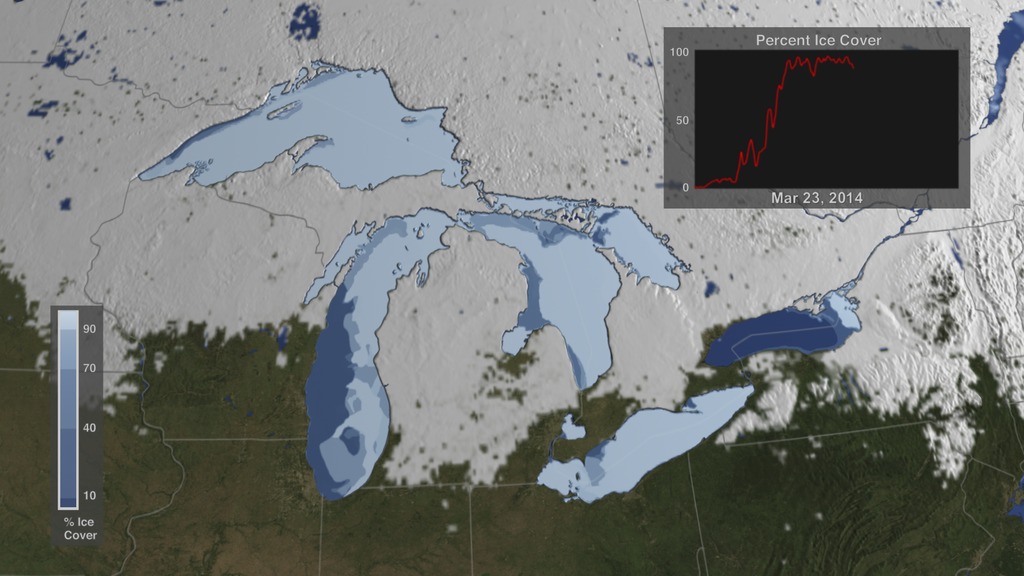
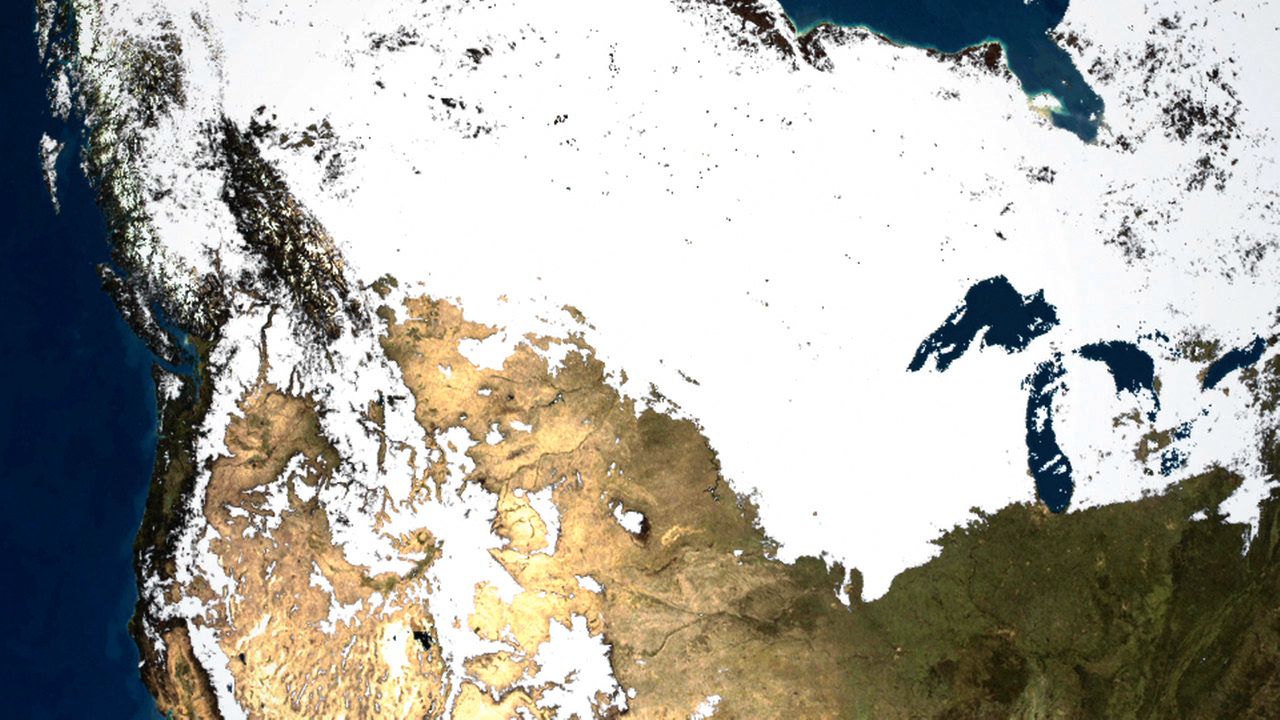
The Winter of 2013 – 2014: A Cold, Snowy and Icy Winter in North America
Go to this pageThis animation shows the snow cover over North America during the 2013-2014 winter as well as the ice concentration over the Great Lakes. The date and a graph showing the percent of ice cover over the Great Lakes and Lake Superior is shown on this version. || GreatLakes_ice_2014-15_30p.02845_print.jpg (1024x576) [134.0 KB] || GreatLakes_ice_2014-15_30p.02845_searchweb.png (320x180) [90.3 KB] || GreatLakes_ice_2014-15_30p.02845_thm.png (80x40) [6.6 KB] || GreatLakes_Ice_2013-2014_720.mp4 (1280x720) [42.1 MB] || GreatLakes_Ice_2013-2014_1080.mp4 (1920x1080) [74.5 MB] || GreatLakes_ice_withOlay (1920x1080) [0 Item(s)] || GreatLakes_ice_withOlay (1920x1080) [0 Item(s)] || GreatLakes_Ice_2013-2014_720.webm (1280x720) [27.5 MB] || GreatLakes_Ice_2013-2014_4256.key [45.7 MB] || GreatLakes_Ice_2013-2014_4256.pptx [43.1 MB] ||
- ID: 2981 Visualization
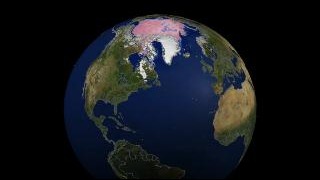
Global Daily Snow and Sea Ice Surface Temperature
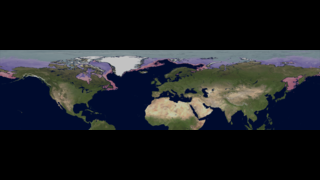
Go to this pageThis animation shows the global advance and retreat of daily snow cover along with daily sea ice surface temperature over the Northern Hemisphere from September 2002 through May 2003. The snow cover was measured by the MODIS instrument on the Terra satellite, while the sea ice surface temperature was measured by the MODIS instrument on the Aqua satellite. Since these instruments cannot take measurements through clouds, in cloud-covered regions or areas with suspect data quality, the prior day's value is retained until a valid data reading is obtained. This visualization designates an area as covered by snow when the instrument takes a valid measurement showing greater than ~50% snow coverage in that area. This area is assumed to be snow covered until the instrument takes a valid measurement showing less than 40% snow coverage in that same area. A color bar indicates the sea ice surface temperature values. The satellite instruments are unable to collect data through darkness. The region in polar darkness is shown as a gray cap over the pole that grows and shrinks seasonally. A date slider indicates the progression of time. SeaWiFS Land Reflectance shows the seasonal changes in land cover. ||
- ID: 4055 Visualization
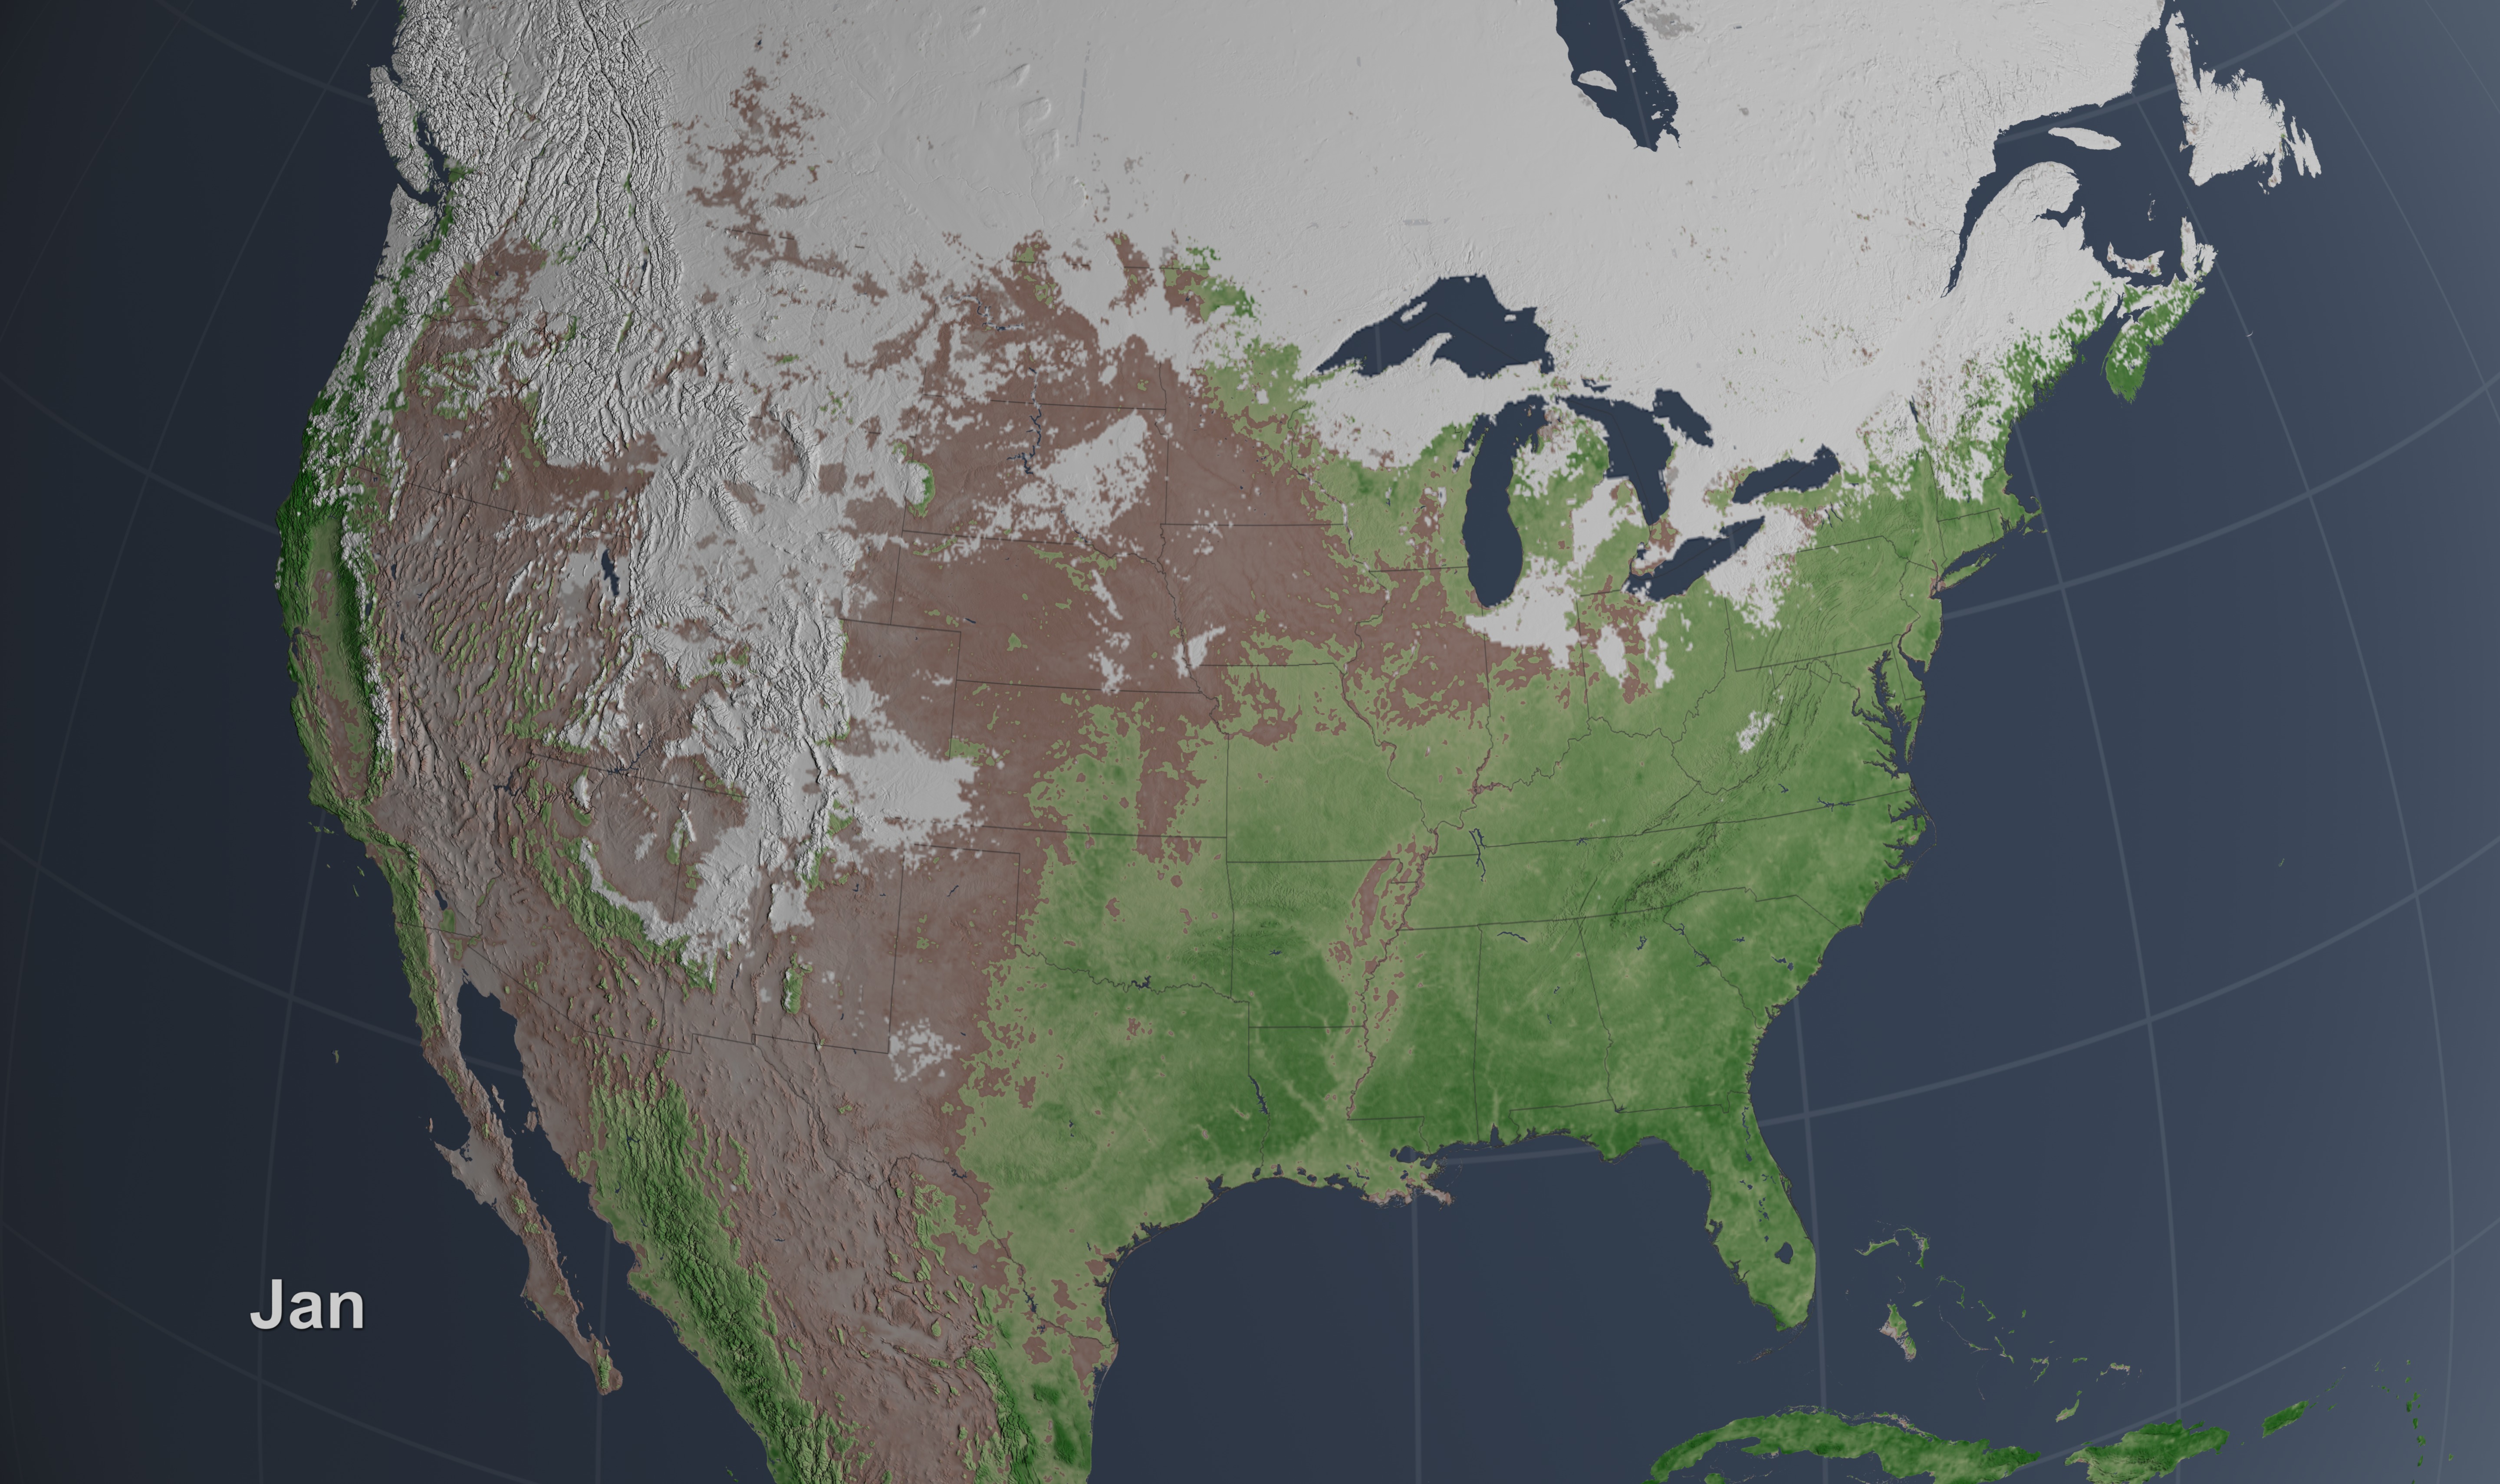
Seasonal Vegetation and Snow Change
Go to this pageTo determine the density of green on a patch of land, researchers must observe the wavelengths of visible and near-infrared sunlight reflected by the plants. The pigment in plant leaves, chlorophyll, strongly absorbs visible light (from 0.4 um - 0.7 um). Vegetation strongly reflects near-infrared light (from 0.7 -1.0 um). The more healthy leaves a plant has, the more the the visible light will be absorbed and the near-infrared will be reflected. In this animation, dark green indicates dense, healthy vegetation, whereas beige areas represent bare soil. Snow from the MODIS instruments is overlaid on top. ||
- ID: 3944 Visualization
Pulse of Snow and Sea Ice
Go to this pageSnow and sea ice in the Northern and Southern Hemispheres pulse at exact opposite times of year, constantly out of phase. ||
- ID: 3928 Visualization
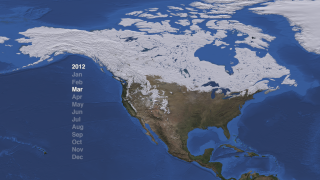
North America Snow Cover 2009-2012
Go to this pageThis entry features visualization material of daily snow cover over North America from July 1, 2009 - March 11, 2012 and still images of snow cover in the Western region of United States. ||
- ID: 30372 Hyperwall Visual
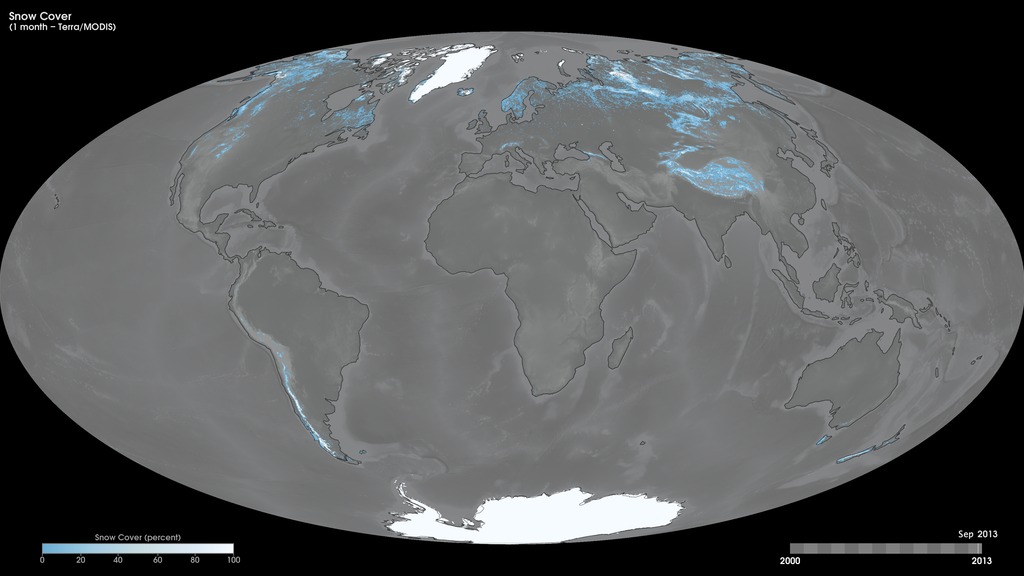
Monthly Snow Cover
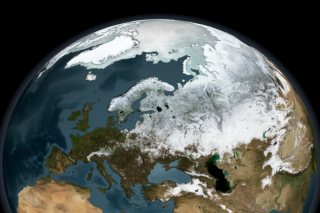
Go to this pageSnow and ice cover most of the Earth's polar regions throughout the year, but the coverage at lower latitudes changes with the seasons. Northern Hemisphere snow cover changes dramatically throughout the year, but the only significant snow cover in the Southern Hemisphere is in Antarctica, which has very few snow-free areas at any time of the year. These maps show monthly snow cover data from February 2000 to the present, derived using observations from the Moderate Resolution Imaging Spectroradiometer (MODIS) onboard NASA's Terra satellite. The colors show the percent of land area that is covered with snow. The white areas show lands that were completely snow-covered, while the light blue shades show regions in which there was only partial snow cover. ||
Other
- ID: 4271
 Visualization
 - ID: 4154
- ID: 30371
 Hyperwall Visual
 - ID: 11054
 Produced Video
 - ID: 3927
- ID: 3856
 Visualization
 - ID: 10737
 Produced Video
 - ID: 3710
 Visualization
 - ID: 3672
 Visualization
 - ID: 3676
 Visualization
 - ID: 3677
 Visualization
 - ID: 3678
 Visualization
 - ID: 3679
 Visualization
 - ID: 10503
 Produced Video
 - ID: 3754
 Visualization
 - ID: 3658
- ID: 3619
 Visualization
 - ID: 20021
 Animation
 - ID: 20022
 Animation
 - ID: 20023
 Animation
 - ID: 20020
 Animation
Greenland Ice Sheet
- ID: 4325
- ID: 4249
 Visualization
 - ID: 4328
 Visualization
 - ID: 4022
 Visualization
 - ID: 11114
 Produced Video
 - ID: 4001
 Visualization
 - ID: 3962
 Visualization
 - ID: 3738
 Visualization
 - ID: 3401
 Visualization
 - ID: 3374
- ID: 2421
 Visualization