Search All Stories...
Search
Earth
ID: 4432
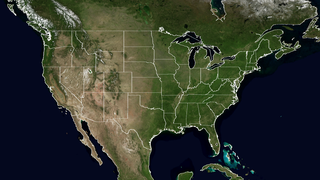
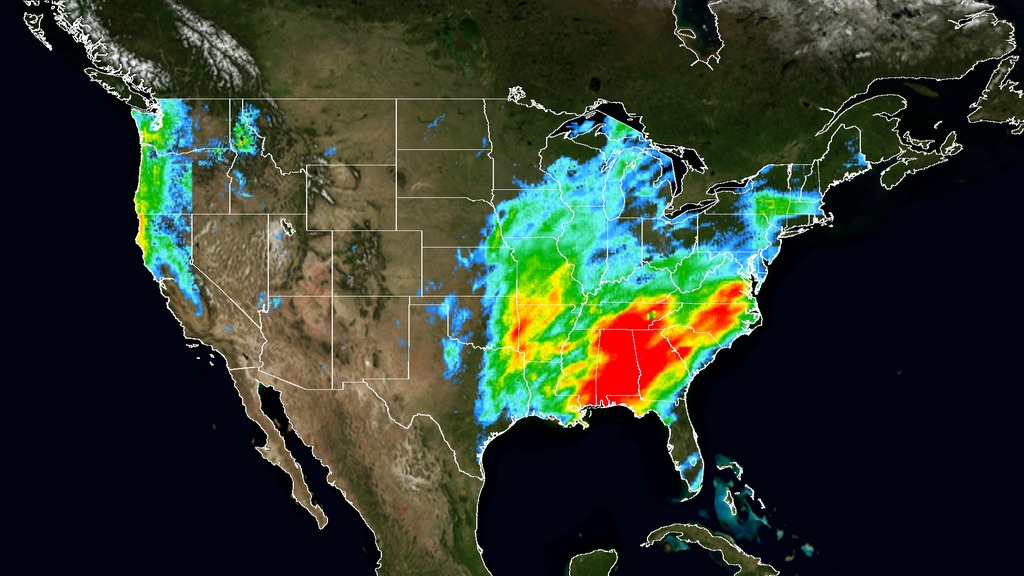
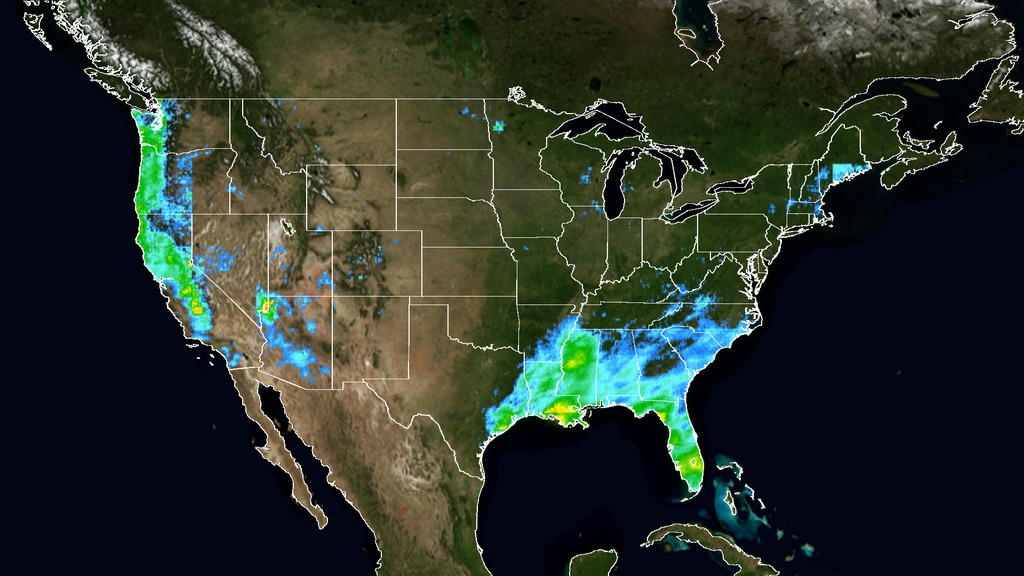
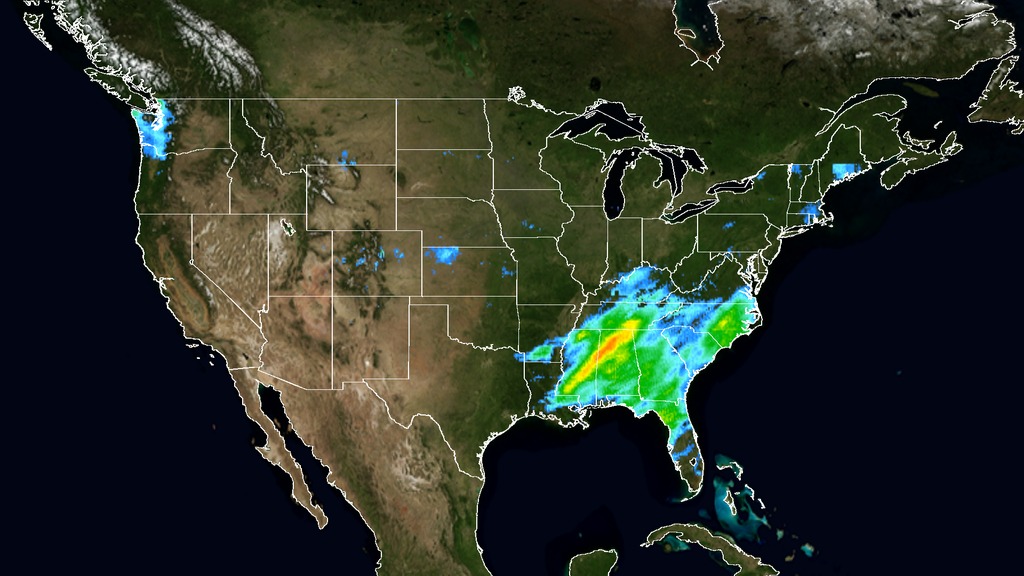
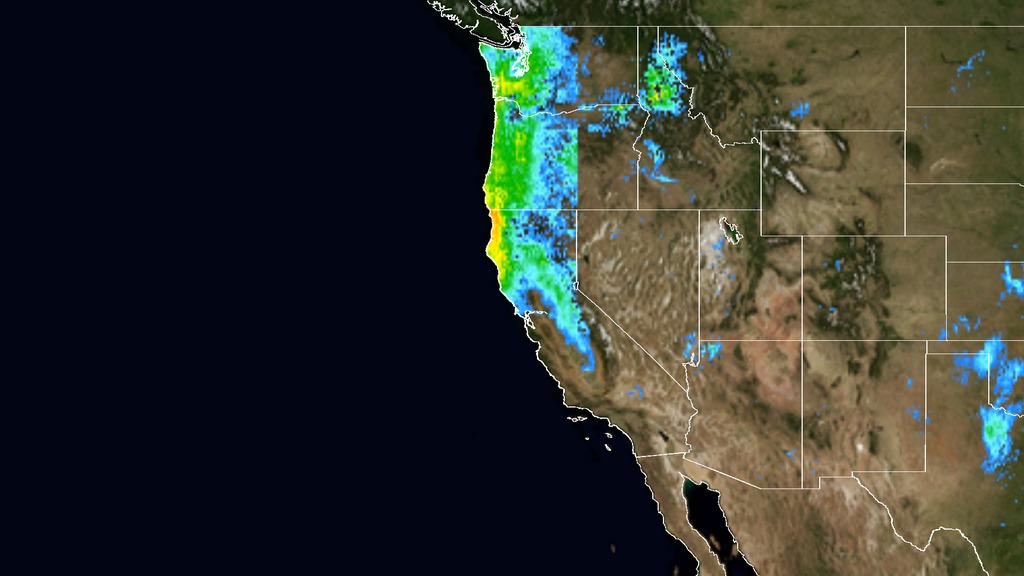
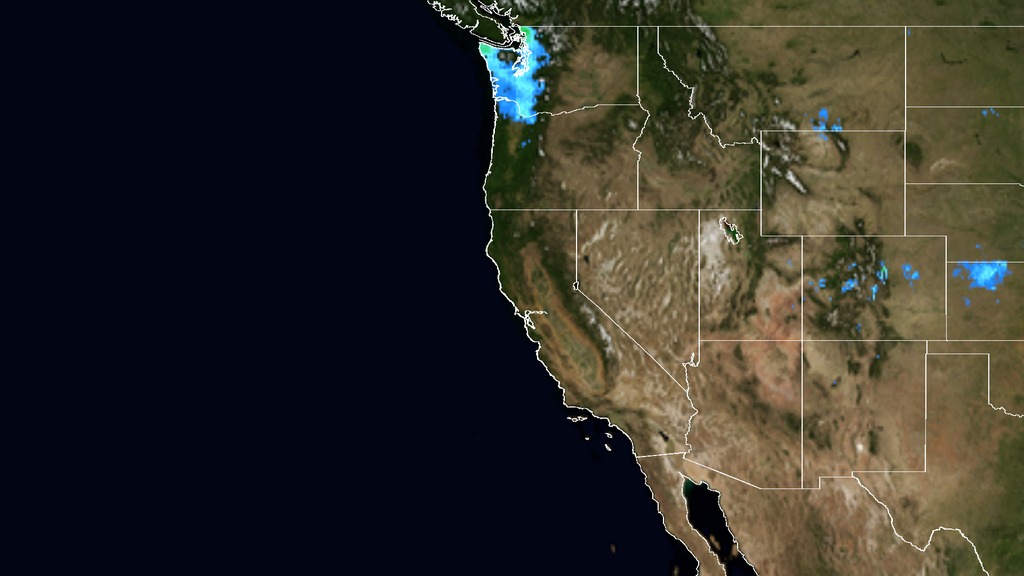
IMERG Rainfall Accumulation from December 2015 through February 2016
Visualizations by
Horace Mitchell
Released on February 25, 2016
Used Elsewhere In
El Niño Rainfall and Ocean Temperature Visualizations
Related
"Tracking El Nino" Live Shots Resource Page
Visualization Credits
Horace Mitchell
(NASA/GSFC): Lead Visualizer
George Huffman
(NASA/GSFC): Scientist
Please give credit for this item to:
NASA's Scientific Visualization Studio
Short URL to share this page:
https://svs.gsfc.nasa.gov/4432
Data Used:
also referred to as:
IMERG
Data Compilation - NASA/GSFC - 12/1/2015-2/16/2016
http://pmm.nasa.gov/sites/default/files/document_files/IMERG_ATBD_V4.4.pdf
view all stories where this data set is used
Note: While we identify the data sets used in these visualizations, we do not store any further details nor the data sets themselves on our site.
Keywords:
SVS >> Hyperwall
NASA Science >> Earth
Search All Stories...
Search
←
Previous
Next
→
Browse Stories
Recent
Popular
Related
M 6.3 flare at Active Region 13229 - February 25, 2023
M 3.7 Flare and filament eruption at Active Region 13229 - February 24, 2023
Arctic Sea Ice Maximum 2023
SOFIA Map of Water Near the Moon's South Pole
X 2.2 Flare - February 17, 2023
X1.1 Flare, Active Region 13217 - February 11, 2023
The 2023 and 2024 Solar Eclipses: Map and Data
Moon Phase and Libration, 2021
Moon Phase and Libration, 2023
Moon Phase and Libration, 2022
A Tour of NASA’s Solar Eclipse Map for 2023 and 2024
2017 Total Solar Eclipse Map and Shapefiles
El Niño Rainfall and Ocean Temperature Visualizations
"Tracking El Nino" Live Shots Resource Page