Earth
ID: 4301
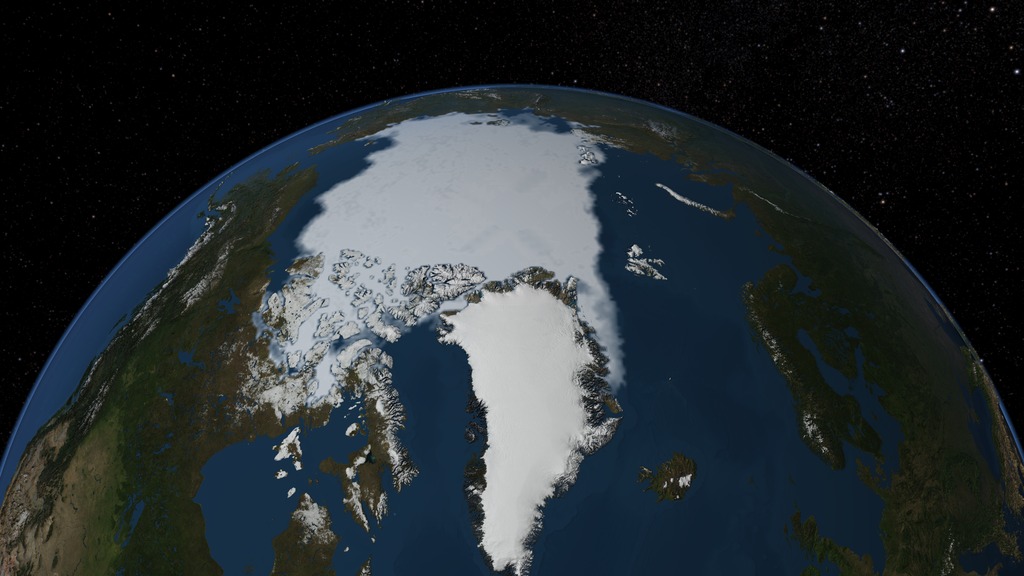
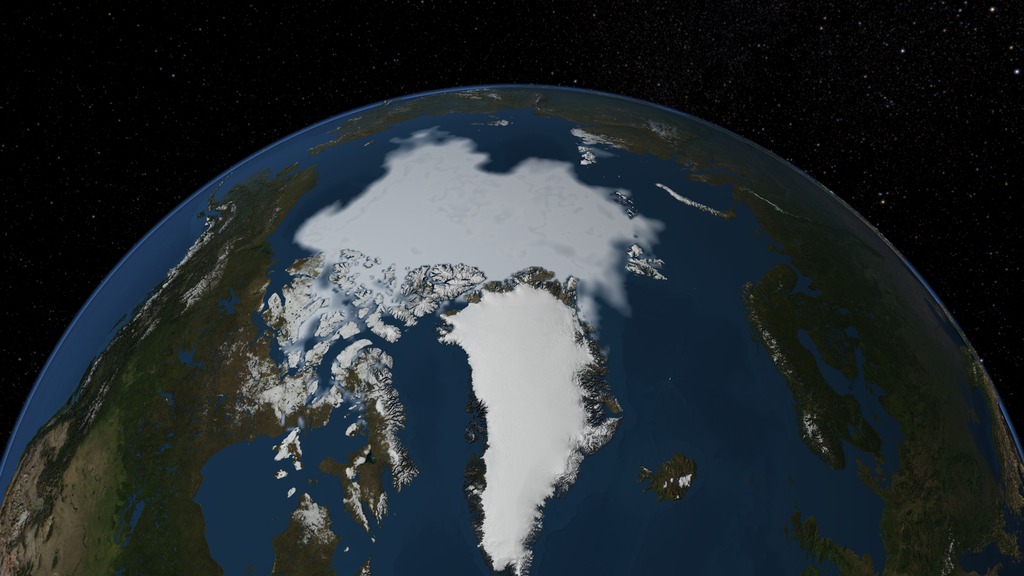
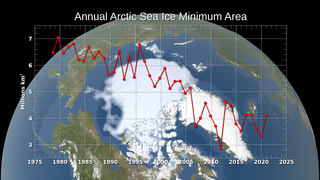
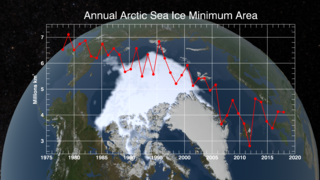
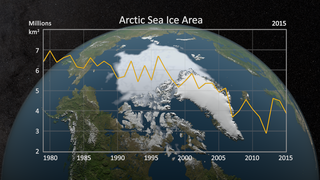
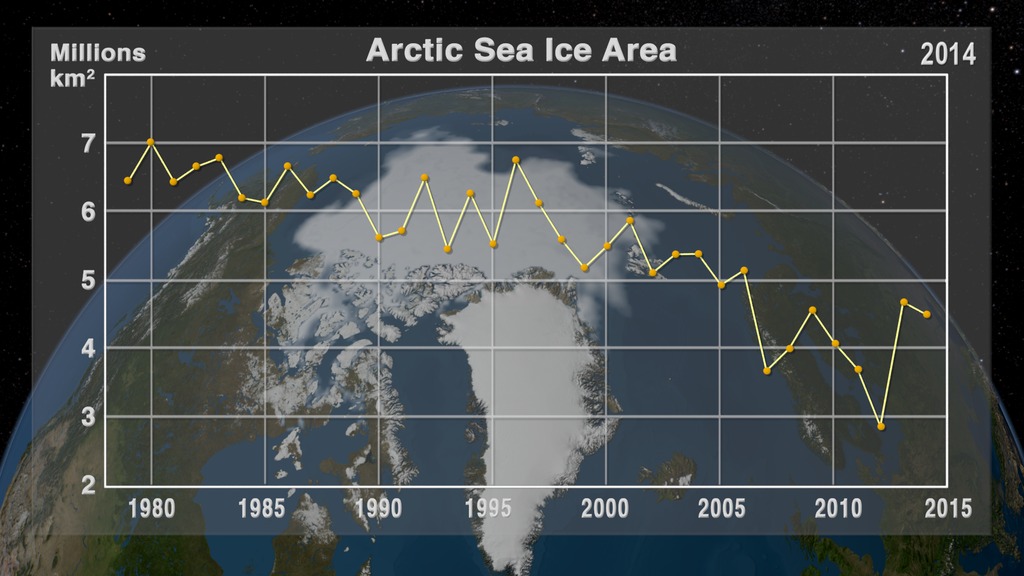
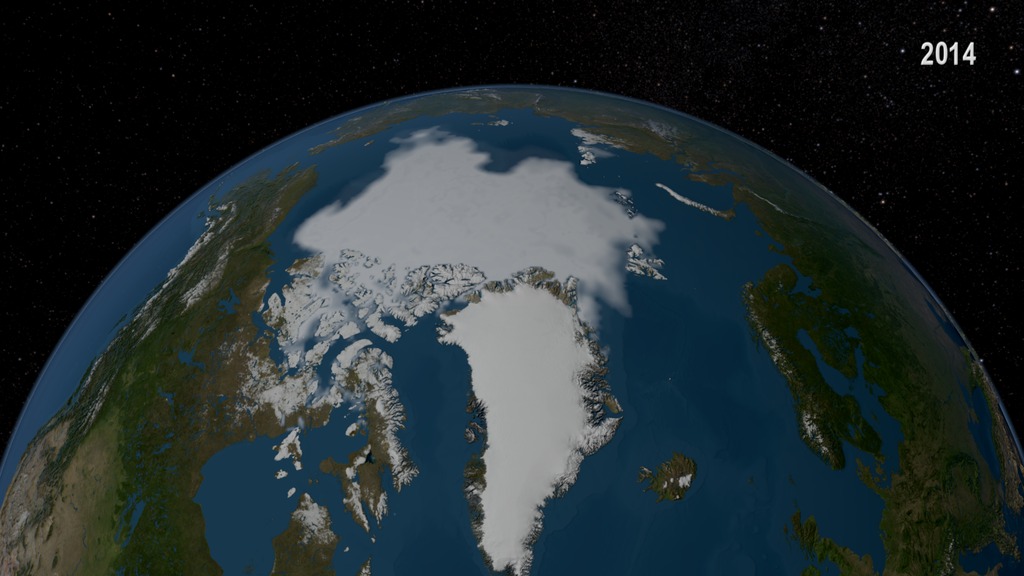
Satellite-based passive microwave images of the sea ice have provided a reliable tool for continuously monitoring changes in the Arctic ice since 1979. Every summer the Arctic ice cap melts down to what scientists call its "minimum" before colder weather begins to cause ice cover to increase. The ice parameters derived from satellite ice concentration data that are most relevant to climate change studies are sea ice extent and sea ice area. This graph displays the area of the minimum sea ice coverage each year from 1979 through 2014. In 2014, the Arctic minimum sea ice covered an area of 4.527 million square kilometers.
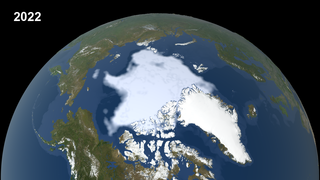
This visualization shows the expanse of the annual minimum Arctic sea ice for each year from 1979 to 2014 as derived from SSMI data. A semi-transparent graph overlay shows the area in million square kilometers for each year's minimum day. The date shown in the upper right corner indicates the current year being displayed.
Annual Arctic Sea Ice Minimum 1979-2014 with Area Graph
There is a newer version of this story located here: https://svs.gsfc.nasa.gov/5170
This visualization shows the expanse of the annual minimum Arctic sea ice for each year from 1979 to 2014 as derived from SSMI data. A semi-transparent graph overlay shows the area in million square kilometers for each year's minimum day. The date shown in the upper right corner indicates the current year being displayed.
Newer Versions


Related
Visualization Credits
Cindy Starr (Global Science and Technology, Inc.): Lead Visualizer
Josefino Comiso (NASA/GSFC): Scientist
Robert Gersten (Wyle Information Systems): Sr. Data Analyst
Laurence Schuler (ADNET Systems, Inc.): Project Support
Ian Jones (ADNET Systems, Inc.): Project Support
Eric Sokolowsky (Global Science and Technology, Inc.): Project Support
Josefino Comiso (NASA/GSFC): Scientist
Robert Gersten (Wyle Information Systems): Sr. Data Analyst
Laurence Schuler (ADNET Systems, Inc.): Project Support
Ian Jones (ADNET Systems, Inc.): Project Support
Eric Sokolowsky (Global Science and Technology, Inc.): Project Support
Please give credit for this item to:
NASA/Goddard Space Flight Center Scientific Visualization Studio
The Blue Marble data is courtesy of Reto Stockli (NASA/GSFC).
NASA/Goddard Space Flight Center Scientific Visualization Studio
The Blue Marble data is courtesy of Reto Stockli (NASA/GSFC).
Short URL to share this page:
https://svs.gsfc.nasa.gov/4301
Data Used:
Note: While we identify the data sets used in these visualizations, we do not store any further details nor the data sets themselves on our site.
This item is part of this series:
Arctic Annual Sea Ice Minimum with Graph Overlay
Keywords:
DLESE >> Cryology
SVS >> HDTV
GCMD >> Earth Science >> Cryosphere >> Sea Ice
GCMD >> Earth Science >> Cryosphere >> Sea Ice >> Sea Ice Concentration
GCMD >> Earth Science >> Oceans >> Sea Ice >> Sea Ice Concentration
SVS >> Hyperwall
NASA Science >> Earth
SVS >> Presentation
GCMD keywords can be found on the Internet with the following citation: Olsen, L.M., G. Major, K. Shein, J. Scialdone, S. Ritz, T. Stevens, M. Morahan, A. Aleman, R. Vogel, S. Leicester, H. Weir, M. Meaux, S. Grebas, C.Solomon, M. Holland, T. Northcutt, R. A. Restrepo, R. Bilodeau, 2013. NASA/Global Change Master Directory (GCMD) Earth Science Keywords. Version 8.0.0.0.0
https://svs.gsfc.nasa.gov/4301
Data Used:
Comiso's September Minimum Sea Ice Concentration
Data Compilation - NASA/GSFC - 1979-2014This item is part of this series:
Arctic Annual Sea Ice Minimum with Graph Overlay
Keywords:
DLESE >> Cryology
SVS >> HDTV
GCMD >> Earth Science >> Cryosphere >> Sea Ice
GCMD >> Earth Science >> Cryosphere >> Sea Ice >> Sea Ice Concentration
GCMD >> Earth Science >> Oceans >> Sea Ice >> Sea Ice Concentration
SVS >> Hyperwall
NASA Science >> Earth
SVS >> Presentation
GCMD keywords can be found on the Internet with the following citation: Olsen, L.M., G. Major, K. Shein, J. Scialdone, S. Ritz, T. Stevens, M. Morahan, A. Aleman, R. Vogel, S. Leicester, H. Weir, M. Meaux, S. Grebas, C.Solomon, M. Holland, T. Northcutt, R. A. Restrepo, R. Bilodeau, 2013. NASA/Global Change Master Directory (GCMD) Earth Science Keywords. Version 8.0.0.0.0


