A newer version of this visualization is available.
Annual Arctic Sea Ice Minimum 1979-2017 (SSMI data)
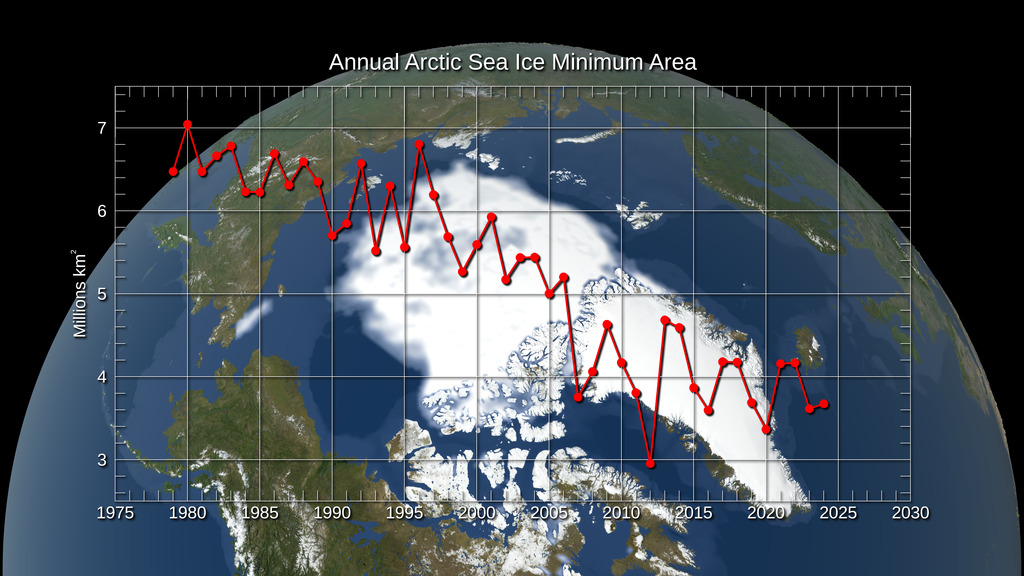
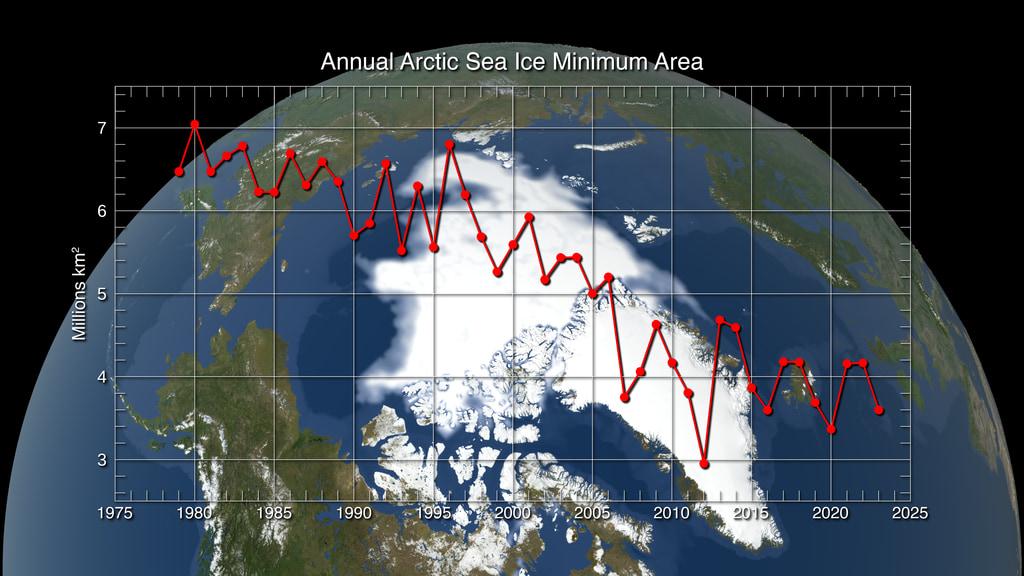
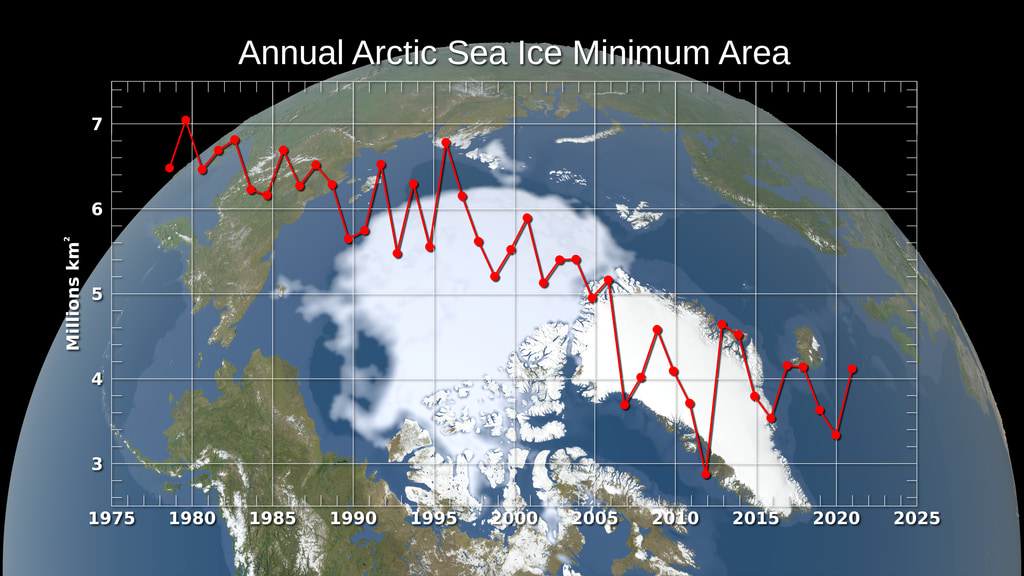
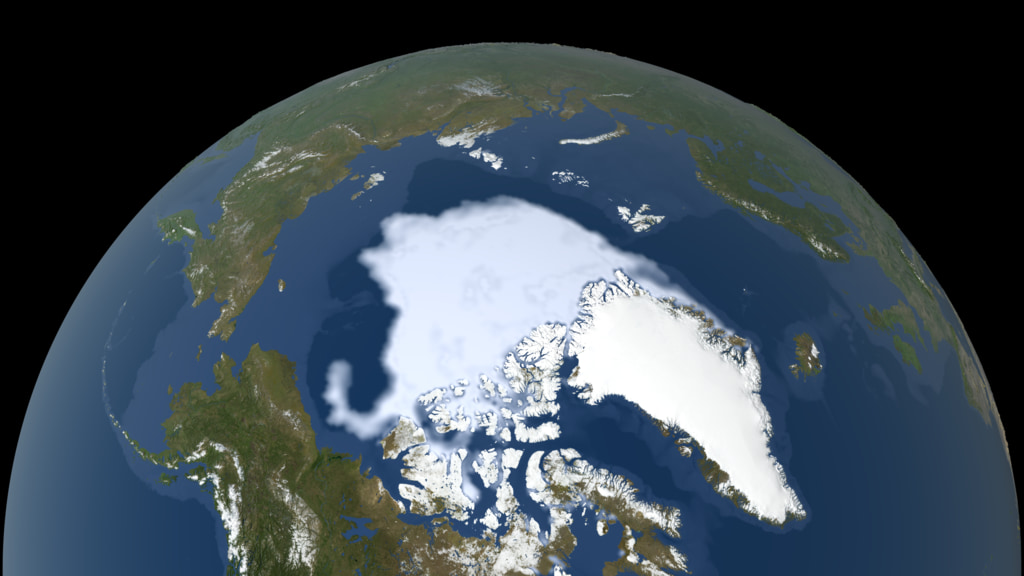
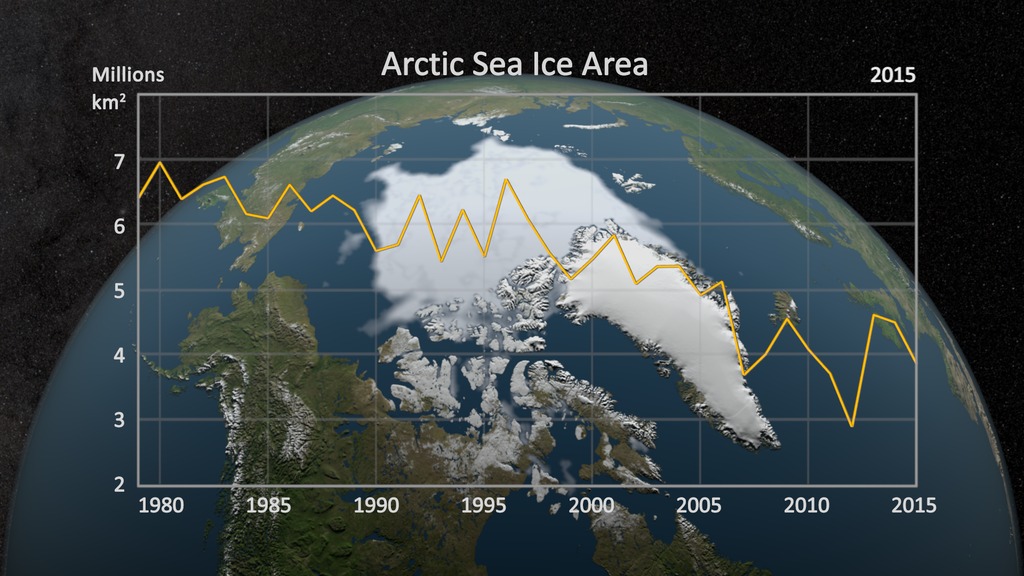
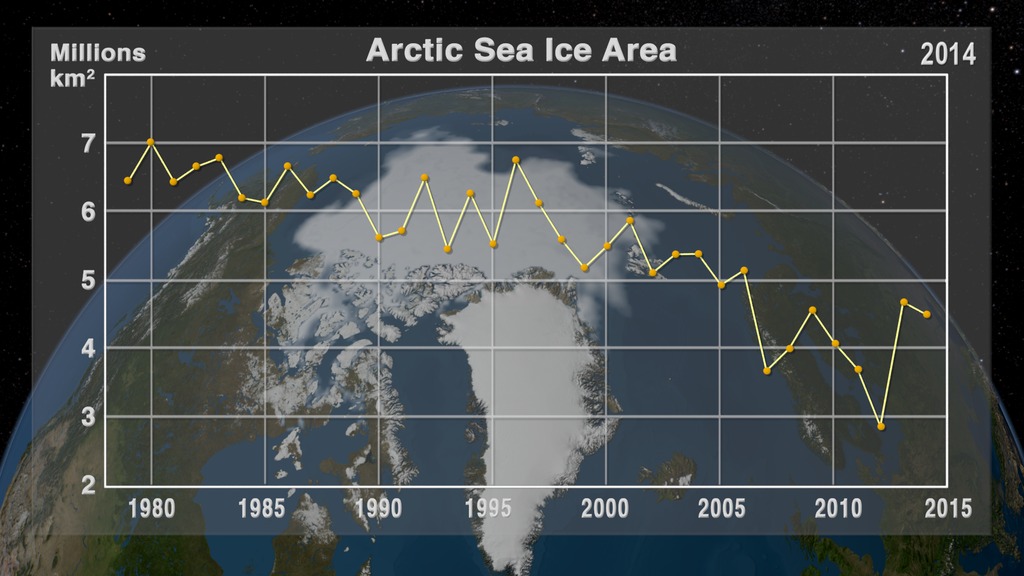
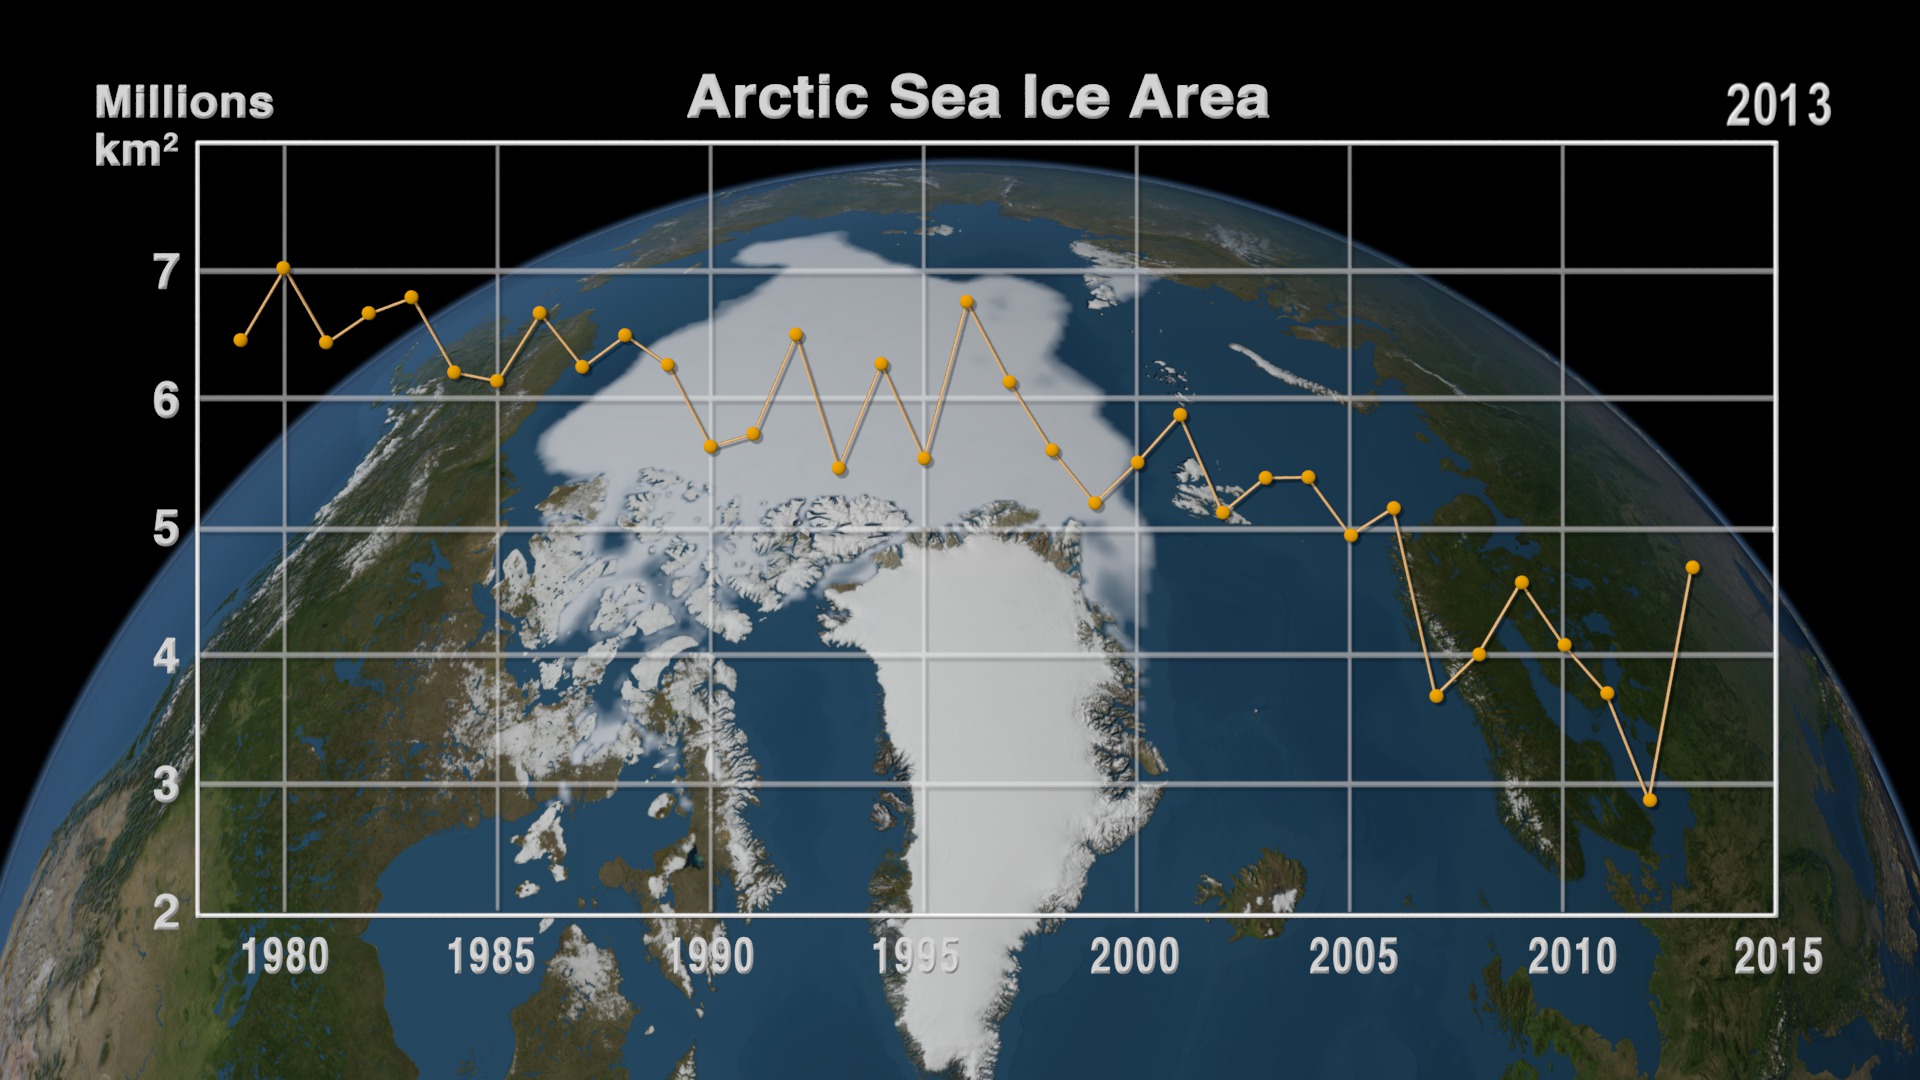
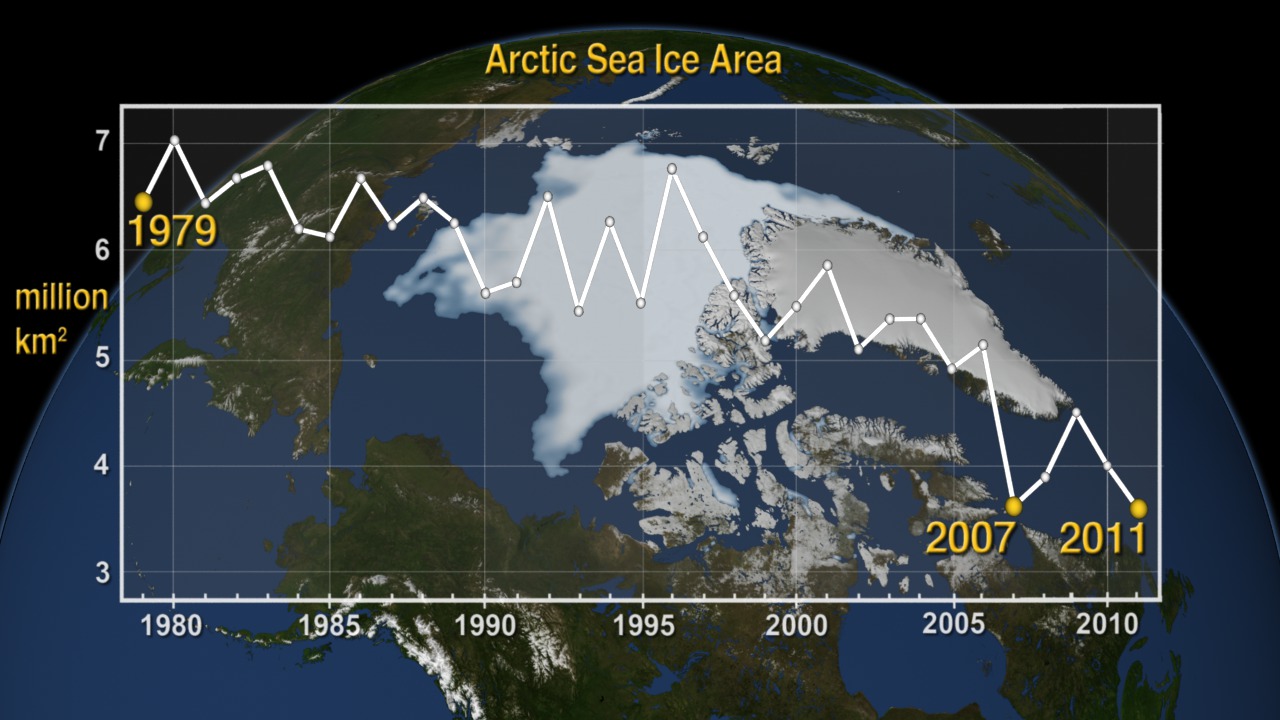
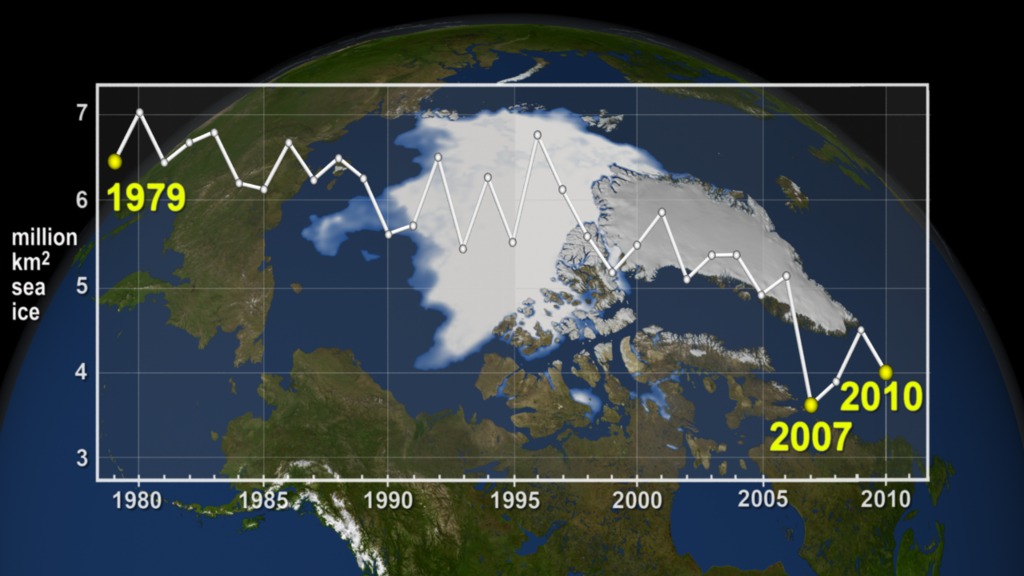
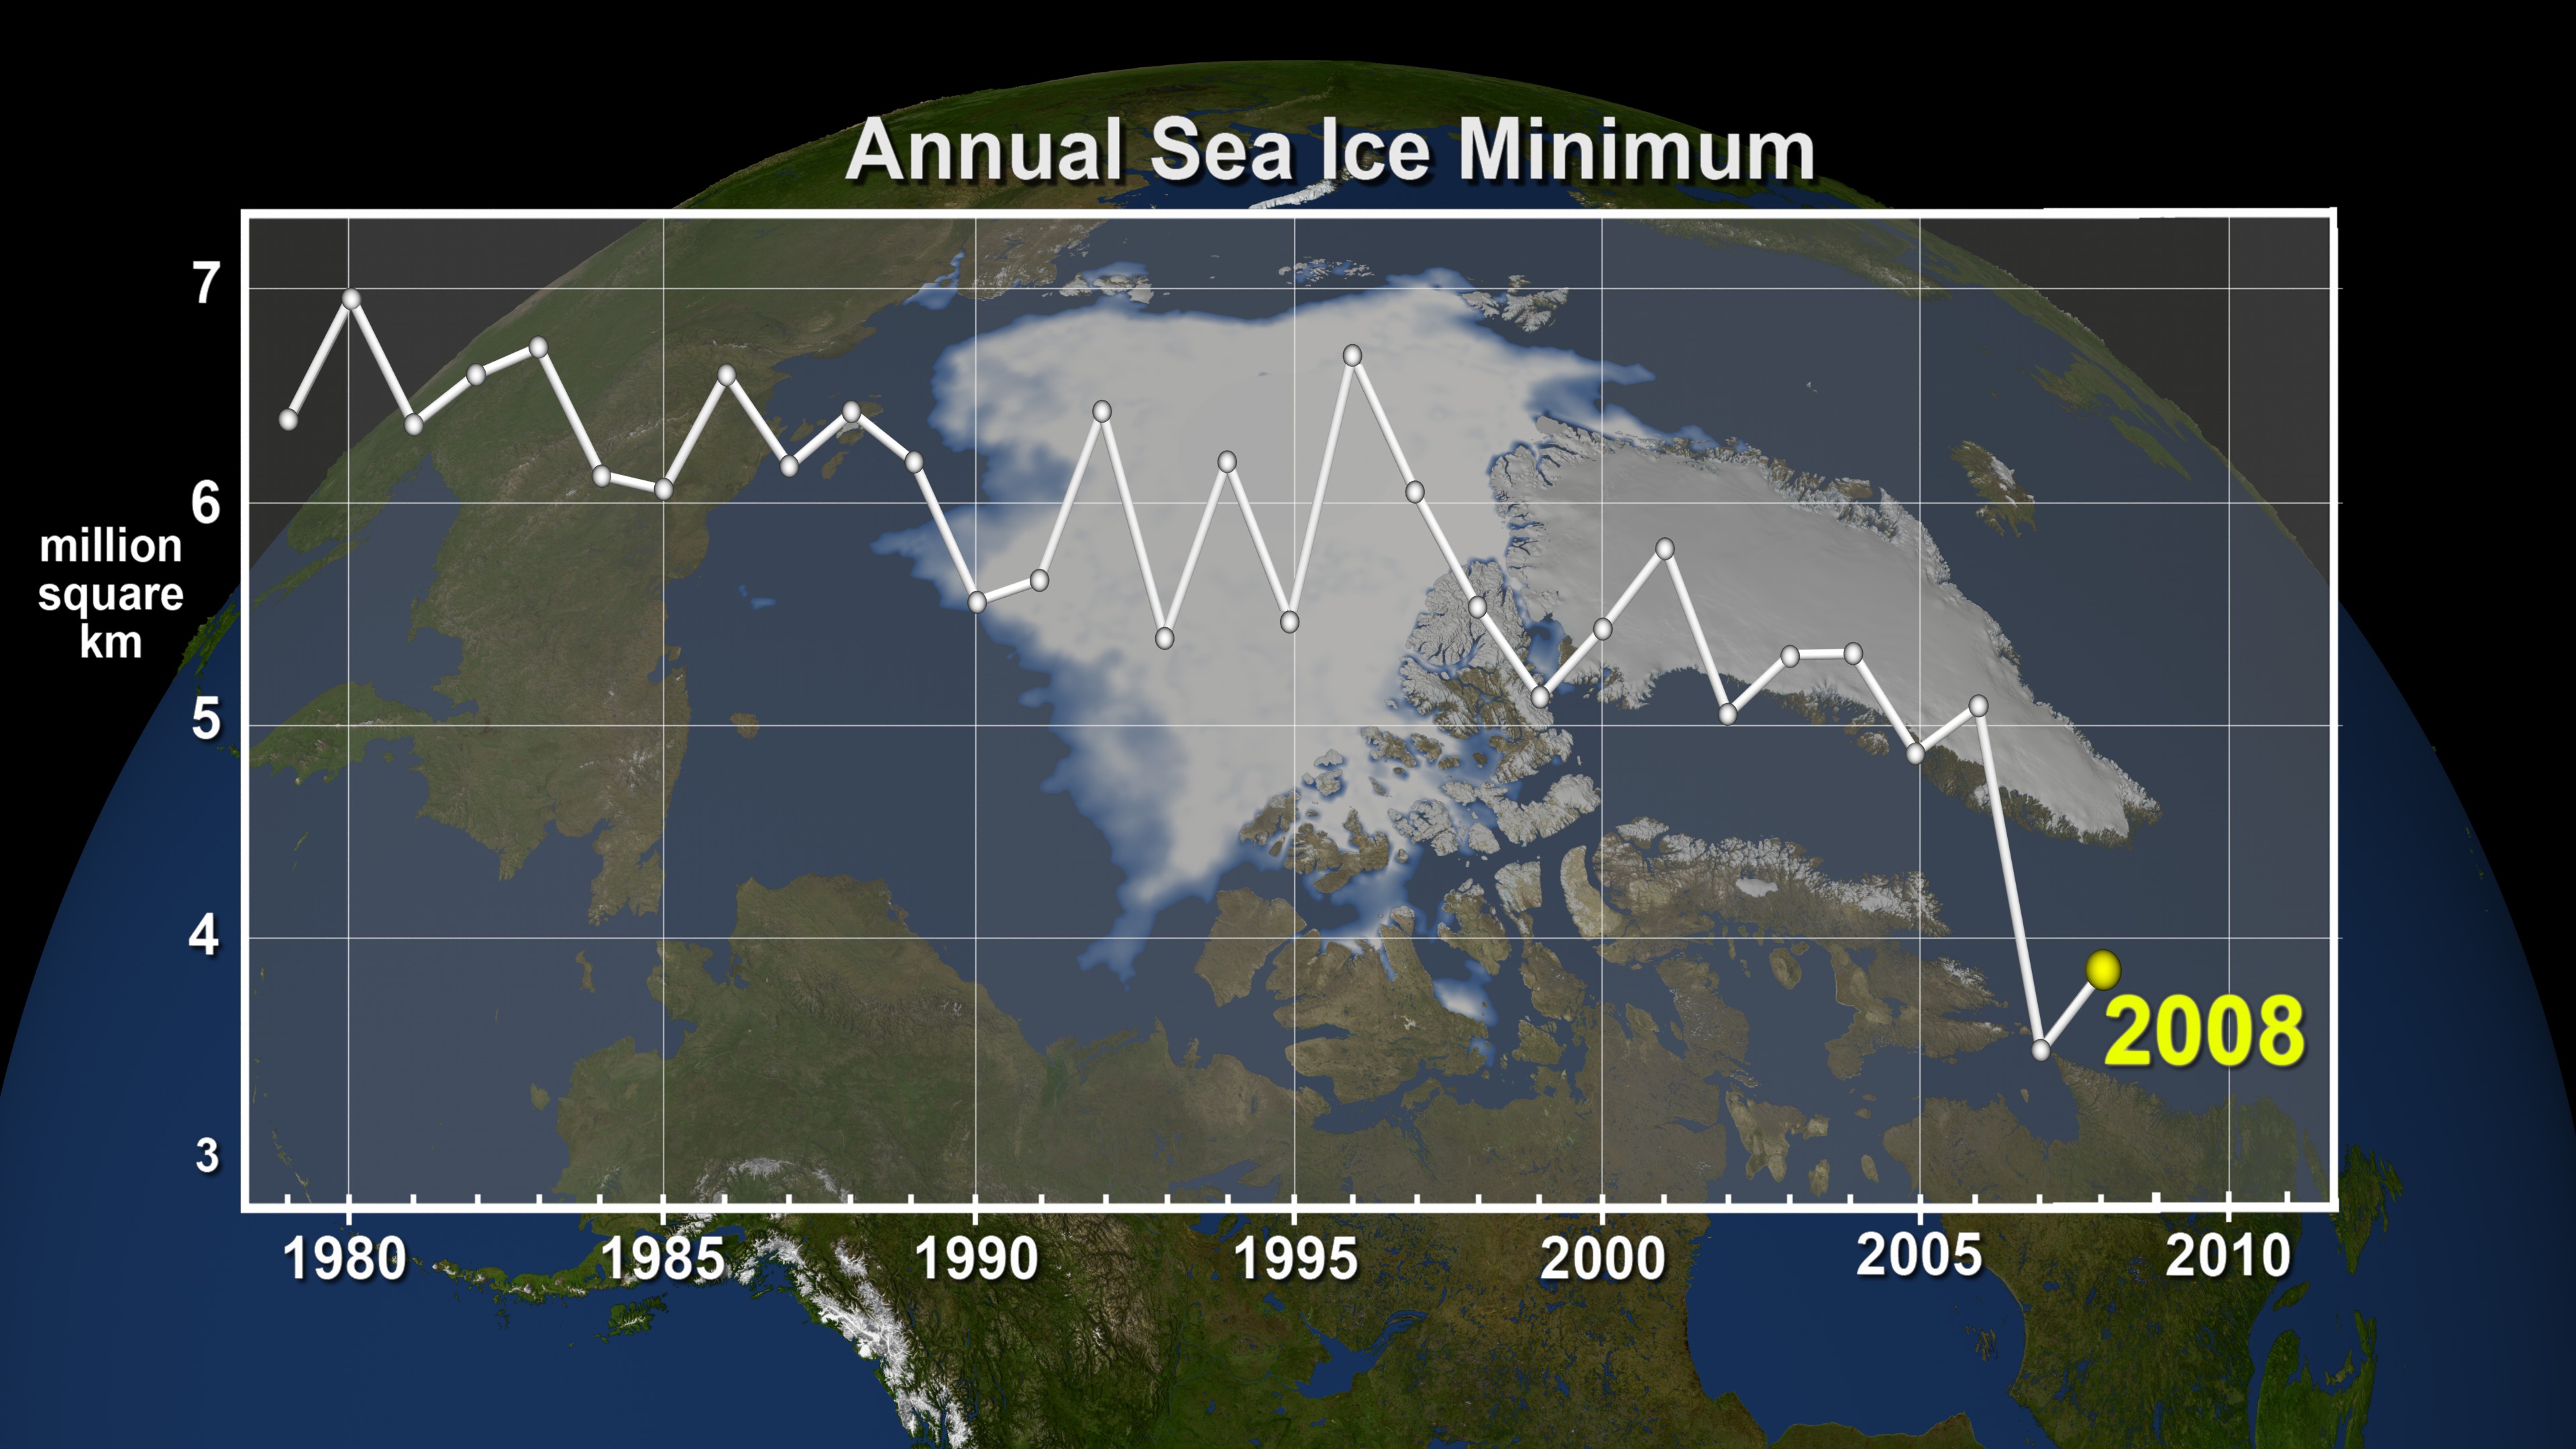
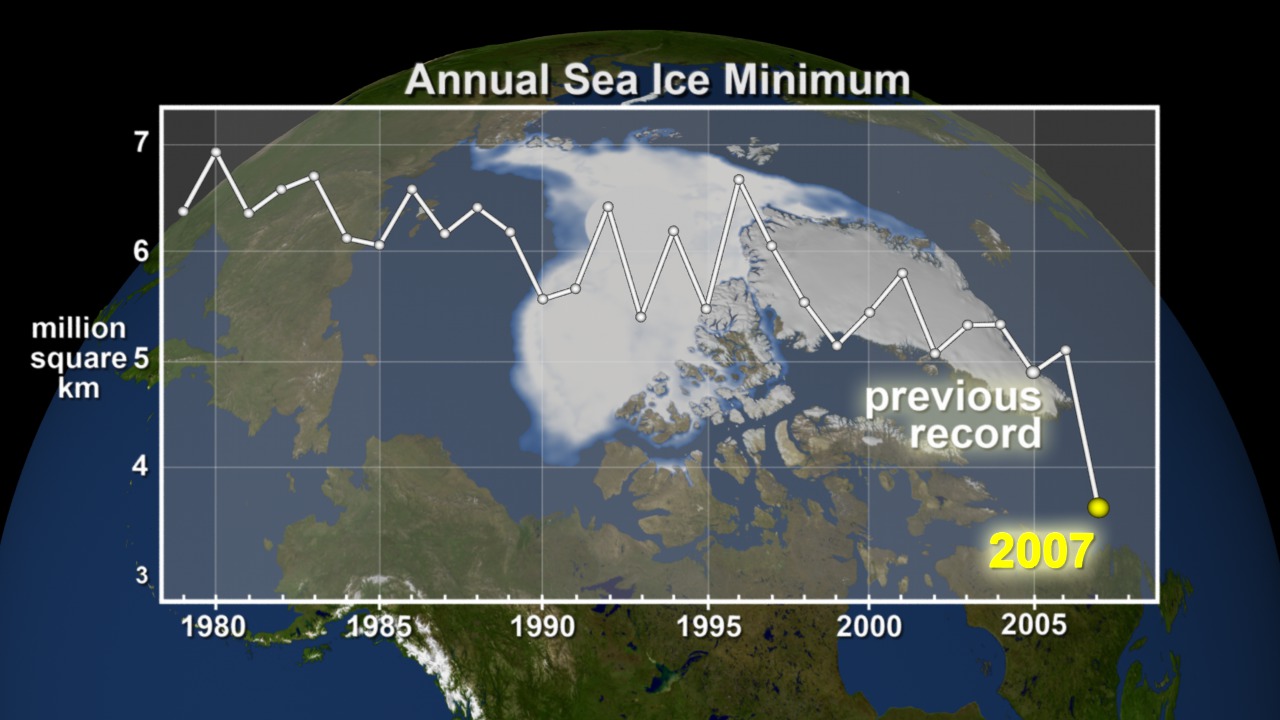
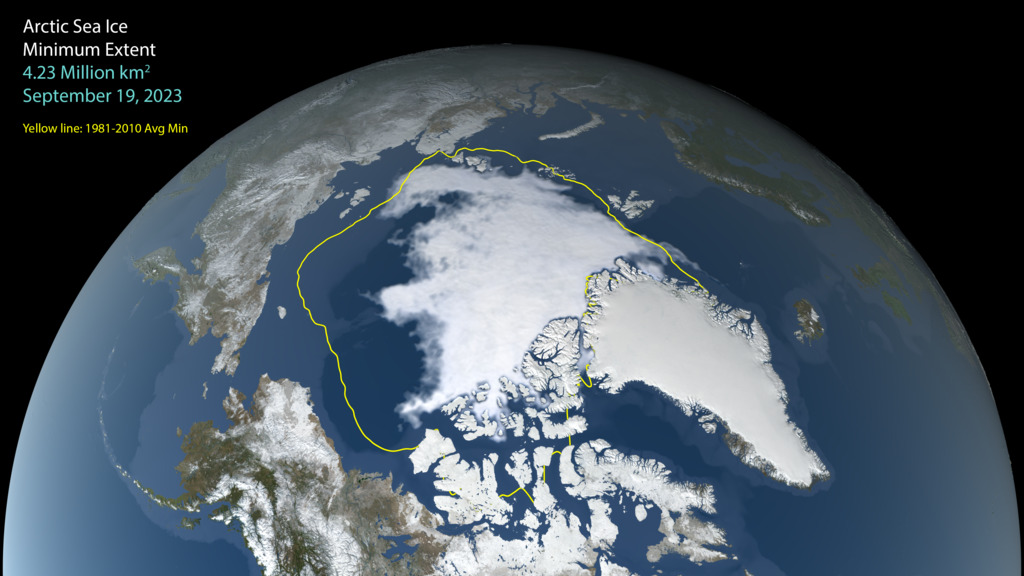
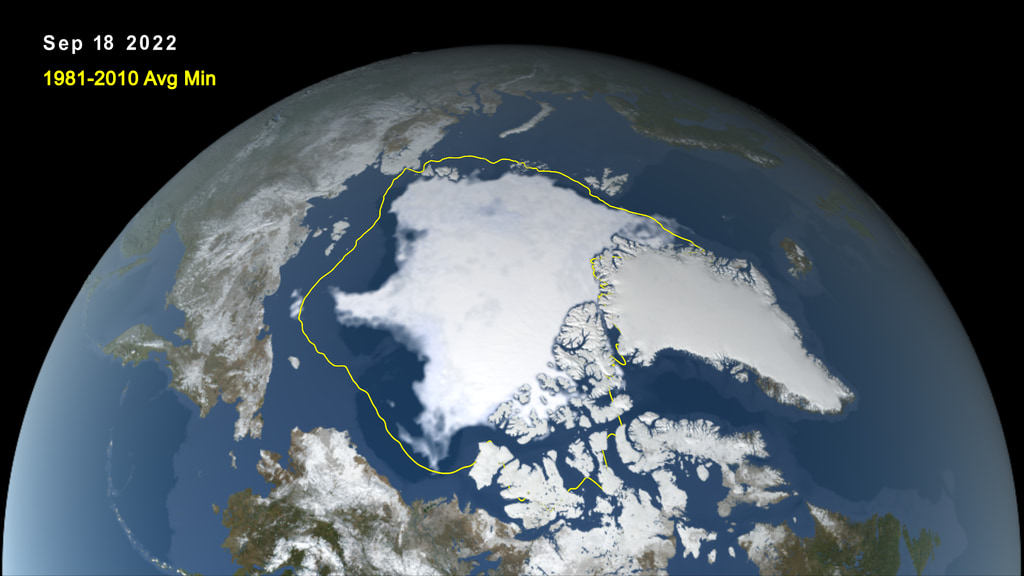
The annual minimum Arctic sea ice from 1979-2017.
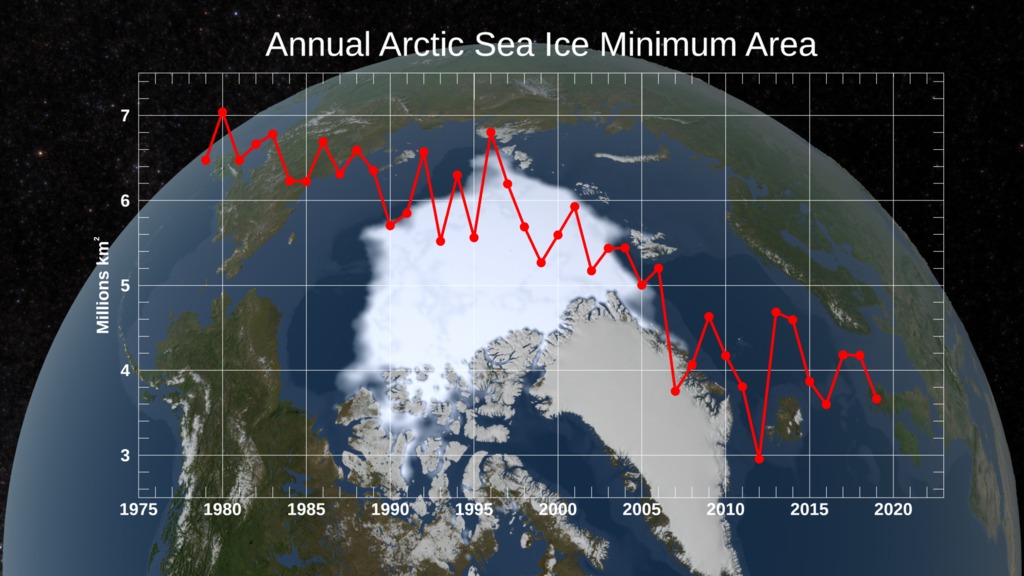
Satellite-based passive microwave images of the sea ice have provided a reliable tool for continuously monitoring changes in the Arctic ice since 1979. Every summer the Arctic ice cap melts down to what scientists call its "minimum" before colder weather begins to cause ice cover to increase. This graph displays the area of the minimum sea ice coverage each year from 1979 through 2017. In 2017, the Arctic minimum sea ice covered an area of 4.17 million square kilometers.
This visualization shows the expanse of the annual minimum Arctic sea ice for each year from 1979 through 2017 as derived from passive microwave data.
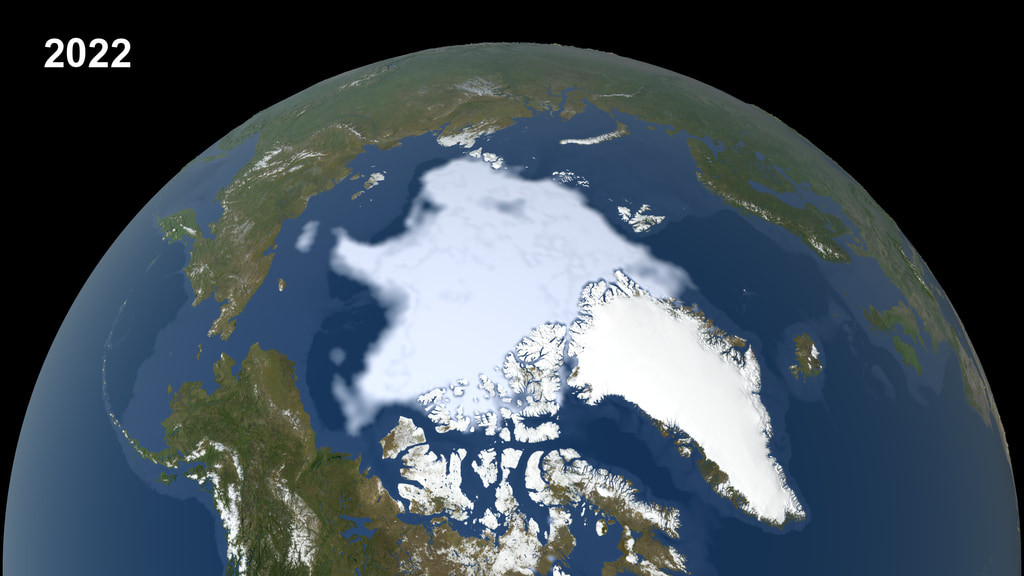
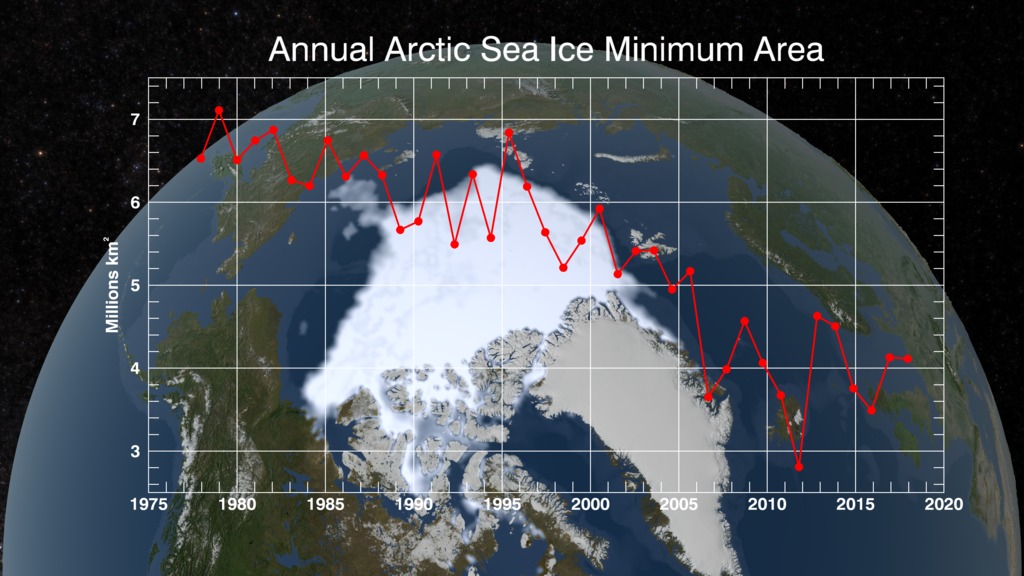
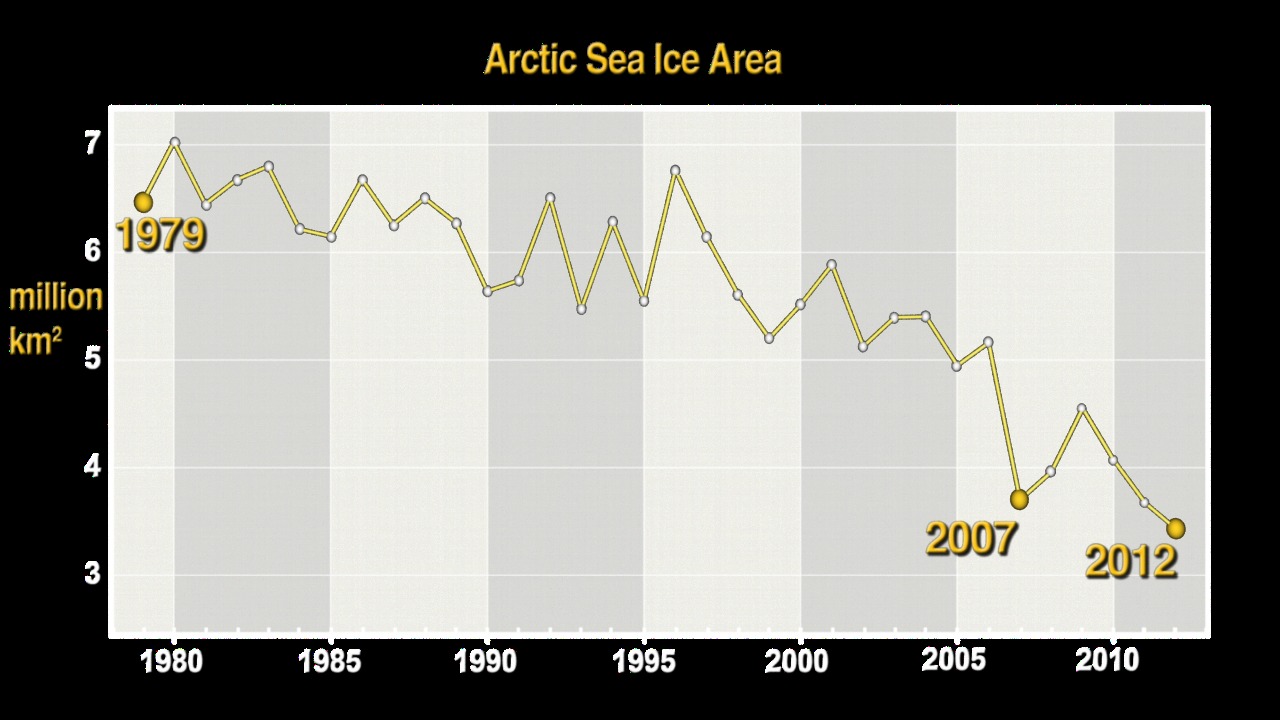
The annual minimum Arctic sea ice from 1979-2017 with its corresponding year overlay.

Corresponding year for the SSM/I data time series.
Credits
Please give credit for this item to:
NASA/Goddard Space Flight Center Scientific Visualization Studio
The Blue Marble data is courtesy of Reto Stockli (NASA/GSFC).
-
Data visualizer
- Lori Perkins (NASA/GSFC)
-
Visualizers
-
Cindy Starr
(Global Science and Technology, Inc.)

-
Helen-Nicole Kostis
(USRA)
-
Cindy Starr
(Global Science and Technology, Inc.)
-
Scientists
- Josefino Comiso (NASA/GSFC)
- Walt Meier (NASA/GSFC)
-
Sr. data analyst
- Robert Gersten (Wyle Information Systems)
-
Technical support
- Laurence Schuler (ADNET Systems, Inc.)
- Ian Jones (ADNET Systems, Inc.)
-
Project support
- Joycelyn Thomson Jones (NASA/GSFC)
- Leann Johnson (Global Science and Technology, Inc.)
- Eric Sokolowsky (Global Science and Technology, Inc.)
Series
This page can be found in the following series:Datasets used
-
Comiso's September Minimum Sea Ice Concentration
ID: 540
Note: While we identify the data sets used on this page, we do not store any further details, nor the data sets themselves on our site.
Related
- ID: 5395
 Visualization
 - ID: 5170
 Visualization
 - ID: 5036
 Visualization
 - ID: 5002
 Visualization
 - ID: 4867
 Visualization
 - ID: 4786
 Visualization
 - ID: 4686
 Visualization
 - ID: 4573
 Visualization
 - ID: 4435
 Visualization
 - ID: 4301
 Visualization
 - ID: 4131
 Visualization
 - ID: 3991
 Visualization
 - ID: 3893
 Visualization
 - ID: 3802
 Visualization
 - ID: 3563
 Visualization
 - ID: 3464
 Visualization
Newer Versions
- ID: 5162
 Visualization
 - ID: 5030
 Visualization
Release date
This page was originally published on Monday, October 16, 2017.
This page was last updated on Wednesday, May 3, 2023 at 1:47 PM EDT.