A newer version of this visualization is available.
Sea Ice Yearly Minimum 1979-2007
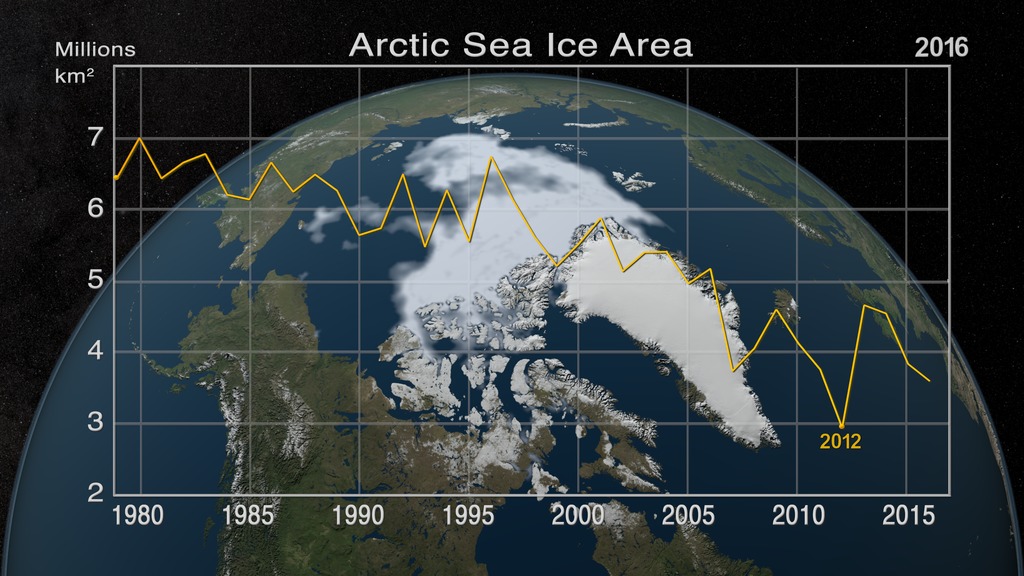
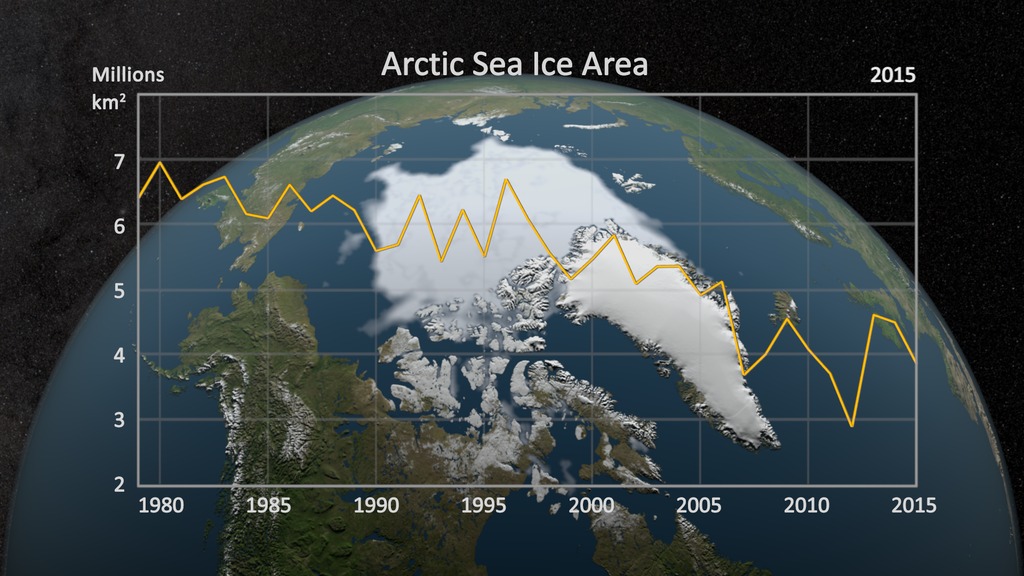
In 2007, Arctic summer sea ice reached its lowest extent on record - nearly 25% less than the previous low set in 2005. At the end of each summer, the sea ice cover reaches its minimum extent and what is left is what is called the perennial ice cover which consists mainly of thick multi-year ice floes. The area of the perennial ice has been steadily decreasing since the satellite record began in 1979, at a rate of about 10% per decade. But the 2007 minimum, reached on September 14, is far below the previous record made in 2005 and is about 38% lower than the climatological average. Such a dramatic loss has implications for ecology, climate and industry as new shipping lanes open.
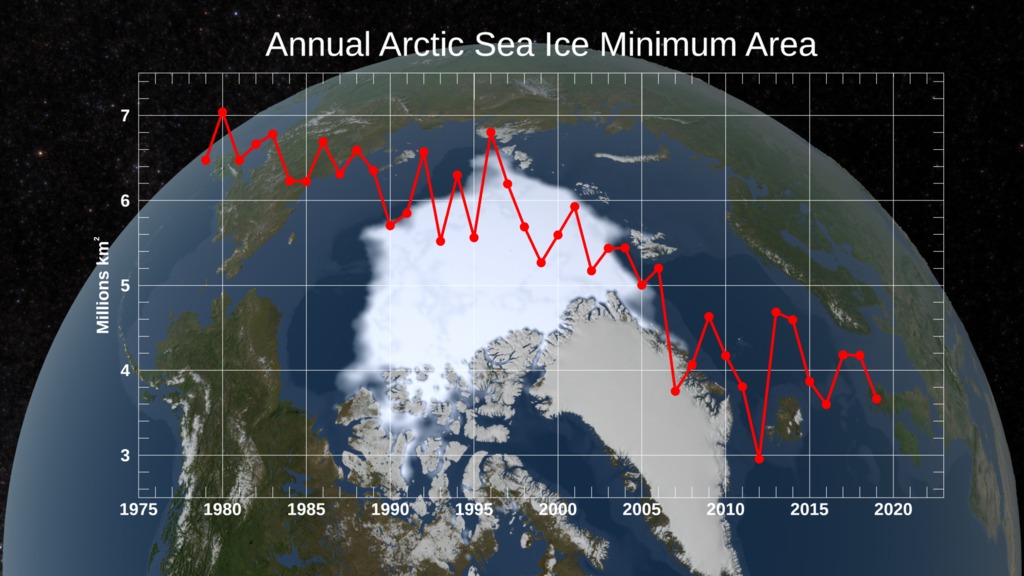
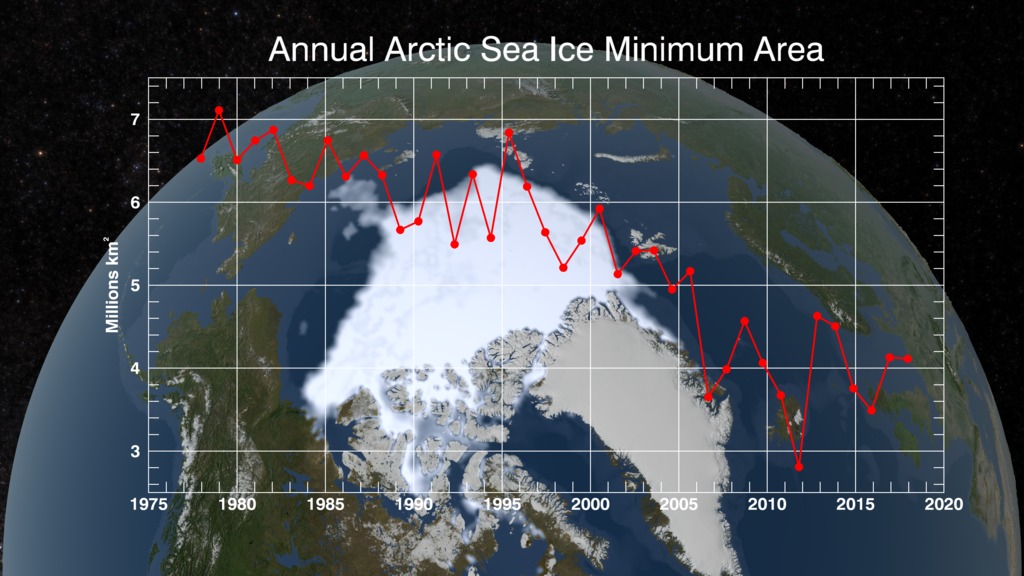
This visualization shows the annual Arctic sea ice minimum from 1979 to 2007. A graph is overlaid that shows the area in million square kilometers for each year's minimum day. The previous record and the 2007 record are highlighted.
Annual Arctic sea ice minimum for 1979 to 2007
Overlay sequence: graph showing annual decline from 1979 to 2007

Overlay still: Minimum Arctice sea ice area trend from 1979 to 2007
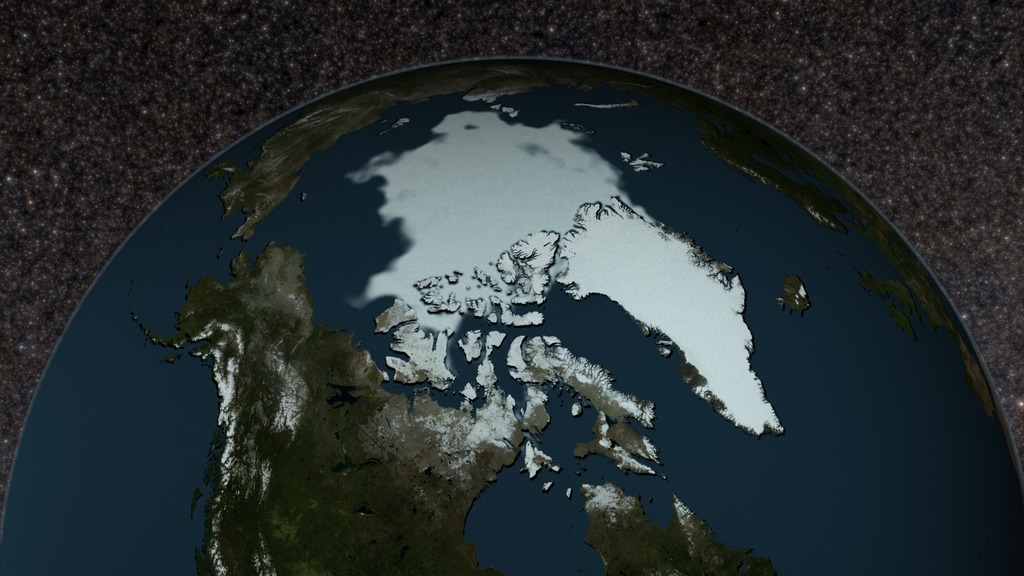
Overlay still: average Arctic aea ice concentration (filled) from 1979 to 2007
Overlay still: average Arctic aea ice concentration (outline) from 1979 to 2007
Print resolution still showing the 14 Sept 2007 sea ice minimum record and an overlay graph showing previous years
14 September 2007 Arctic sea ice minimum area for 2007 (record minimum)
14 September 2006 Arctic sea ice minimum area for 2006
21 September 2005 Arctic sea ice minimum area for 2005
11 September 2004 Arctic sea ice minimum area for 2004
11 September 2003 Arctic sea ice minimum area for 2003
12 September 2002 Arctic sea ice minimum area for 2002
19 September 2001 Arctic sea ice minimum area for 2001
11 September 2000 Arctic sea ice minimum area for 2000
11 September 1999 Arctic sea ice minimum area for 1999
12 September 1998 Arctic sea ice minimum area for 1998
19 September 1997 Arctic sea ice minimum area for 1997
10 September 1996 Arctic sea ice minimum area for 1996
01 October 1995 Arctic sea ice minimum area for 1995
05 September 1994 Arctic sea ice minimum area for 1994
11 September 1993 Arctic sea ice minimum area for 1993
04 September 1992 Arctic sea ice minimum area for 1992
16 September 1991 Arctic sea ice minimum area for 1991
19 September 1990 Arctic sea ice minimum area for 1990
23 September 1989 Arctic sea ice minimum area for 1989
12 September 1988 Arctic sea ice minimum area for 1988
02 September 1987 Arctic sea ice minimum area for 1987
06 September 1986 Arctic sea ice minimum area for 1986
07 September 1985 Arctic sea ice minimum area for 1985
16 September 1984 Arctic sea ice minimum area for 1984
18 September 1983 Arctic sea ice minimum area for 1983
17 September 1982 Arctic sea ice minimum area for 1982
10 September 1981 Arctic sea ice minimum area for 1981
05 September 1980 Arctic sea ice minimum area for 1980
21 September 1979 Arctic sea ice minimum area for 1979
Credits
Please give credit for this item to:
NASA/Goddard Space Flight Center Scientific Visualization Studio
Thanks to Rob Gerston (GSFC) for providing the data.
-
Animator
-
Greg Shirah
(NASA/GSFC)

-
Greg Shirah
(NASA/GSFC)
-
Visualizer
-
Cindy Starr
(Global Science and Technology, Inc.)
-
Cindy Starr
(Global Science and Technology, Inc.)
-
Scientist
- Josefino Comiso (NASA/GSFC)
Series
This page can be found in the following series:Datasets used
-
[DMSP: SSM/I]
ID: 11Defense Meteorological Satellite Program Special Sensor Microwave Imager
See all pages that use this dataset -
Comiso's September Minimum Sea Ice Concentration
ID: 540
Note: While we identify the data sets used on this page, we do not store any further details, nor the data sets themselves on our site.
Related
- ID: 4592
 Visualization
Newer Versions
- ID: 4786
 Visualization
 - ID: 4686
 Visualization
 - ID: 4573
 Visualization
 - ID: 4435
 Visualization
Release date
This page was originally published on Wednesday, September 26, 2007.
This page was last updated on Wednesday, May 3, 2023 at 1:55 PM EDT.