A newer version of this visualization is available.
Daily Arctic Sea Ice from August/September 2007
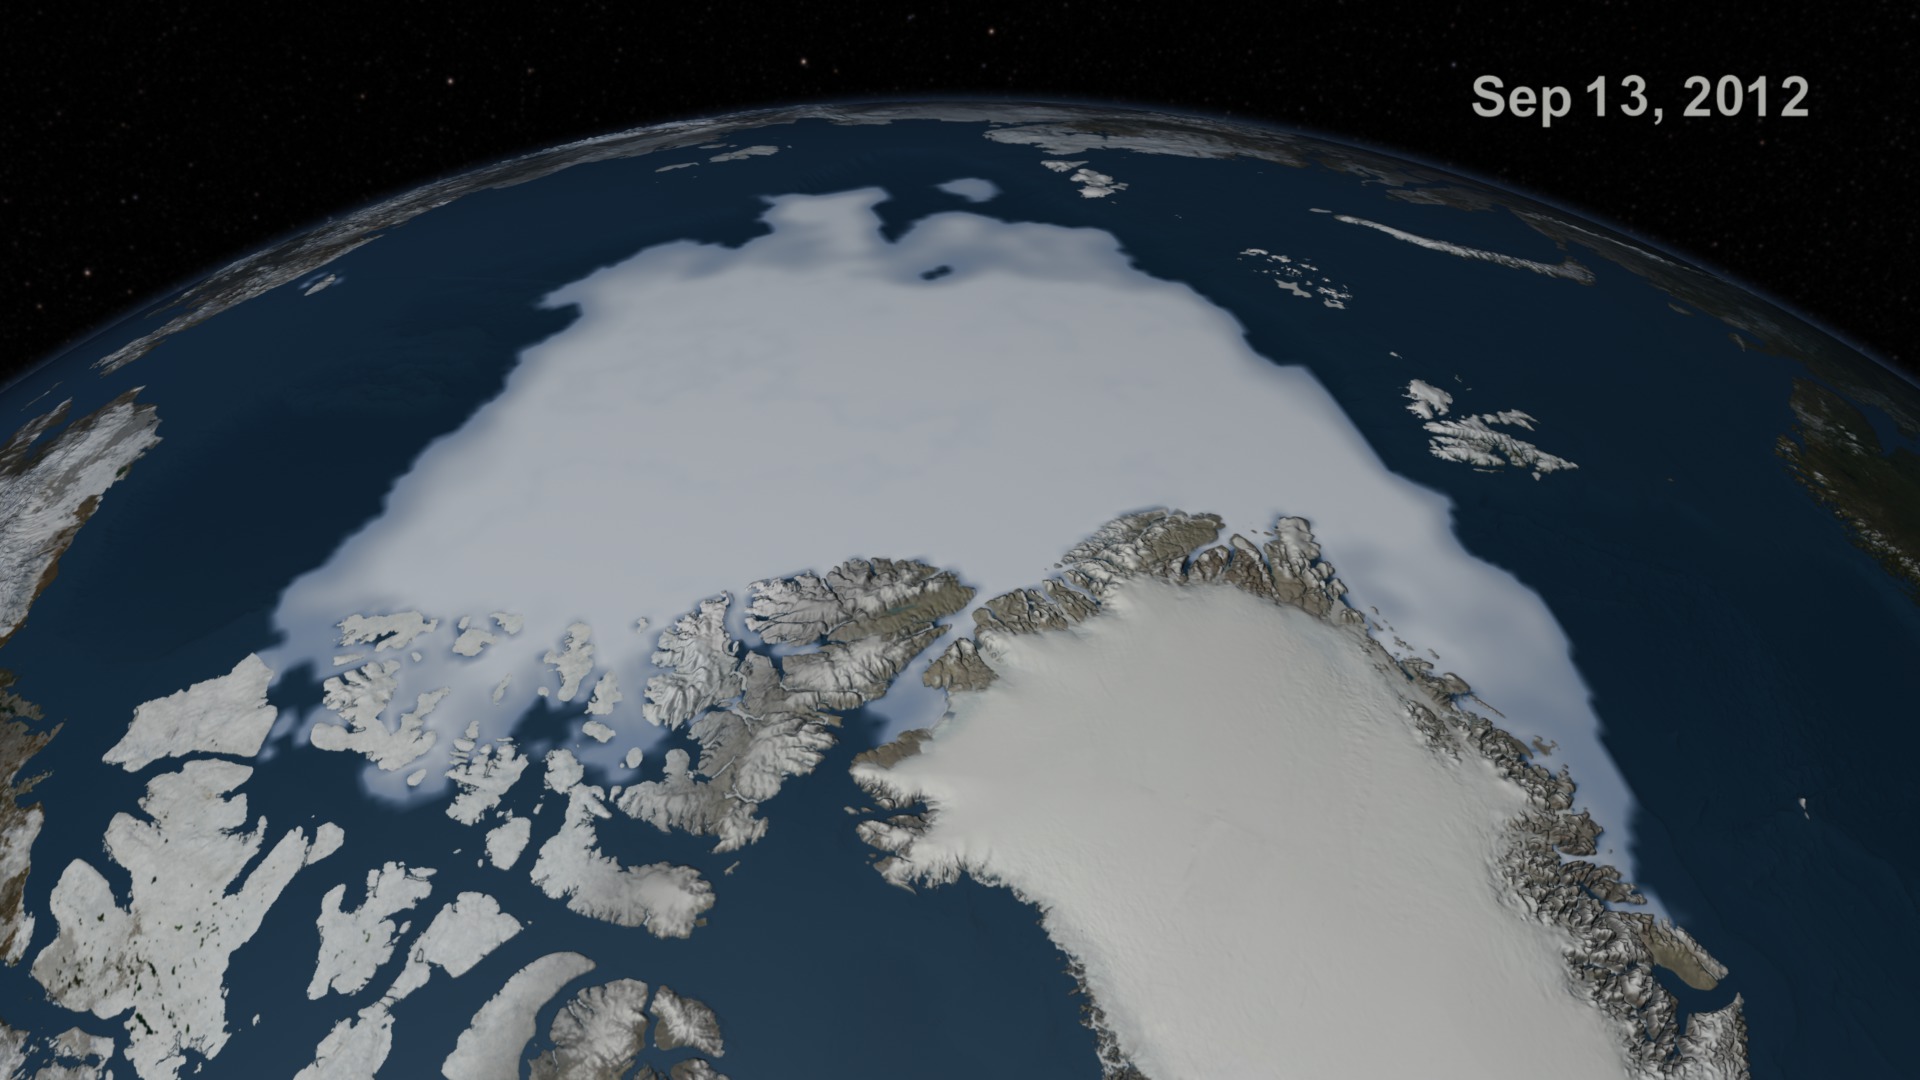
In 2007, Arctic summer sea ice reached its lowest extent on record - nearly 25% less than the previous low set in 2005. At the end of each summer, the sea ice cover reaches its minimum extent and what is left is what is called the perennial ice cover which consists mainly of thick multi-year ice floes. The area of the perennial ice has been steadily decreasing since the satellite record began in 1979, at a rate of about 10% per decade. But the 2007 minimum, reached on September 14, is far below the previous record made in 2005 and is about 38% lower than the climatological average. Such a dramatic loss has implications for ecology, climate and industry as new shipping lanes open.
This visualization shows 2007 daily Arctic sea ice from from 1 August through 19 September.
Arctic sea ice from 01 Aug 2007 to 19 Sept 2007
Overlay: dates that are match framed and can be overlaid on the ice image
Credits
Please give credit for this item to:
NASA/Goddard Space Flight Center Scientific Visualization Studio
Thanks to Rob Gerston (GSFC) for providing the data.
-
Animator
-
Greg Shirah
(NASA/GSFC)

-
Greg Shirah
(NASA/GSFC)
-
Visualizer
-
Cindy Starr
(Global Science and Technology, Inc.)
-
Cindy Starr
(Global Science and Technology, Inc.)
-
Scientist
- Josefino Comiso (NASA/GSFC)
Datasets used
-
[DMSP: SSM/I]
ID: 11Defense Meteorological Satellite Program Special Sensor Microwave Imager
See all pages that use this dataset -
Comiso's Daily Sea Ice Concentration
ID: 539
Note: While we identify the data sets used on this page, we do not store any further details, nor the data sets themselves on our site.
Newer Versions
- ID: 4052
Release date
This page was originally published on Wednesday, September 26, 2007.
This page was last updated on Wednesday, May 3, 2023 at 1:55 PM EDT.