Apollo 13 Moon View Using LRO Data
Path 75:02:00 − 80:01:50. The path of the Apollo 13 spacecraft near the Moon. The one-minute animation covers five hours of real time, at 10 seconds per frame. The view is centered on the lunar north pole, with the center of the near side facing the top of the frame. Versions both with and without the annotations in the bottom right are available, as are the separate components (Moon and path with alpha, starry background).
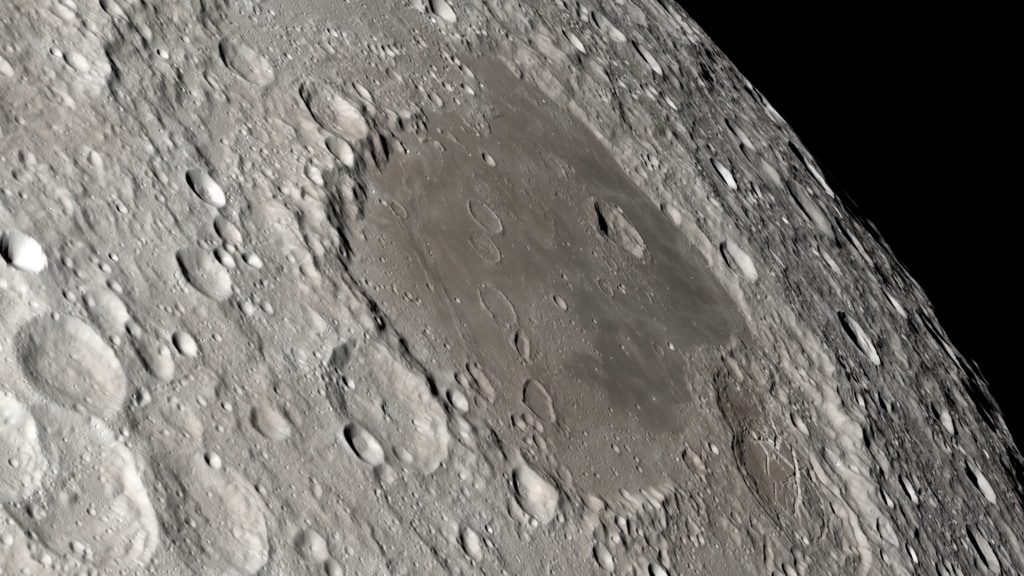
Using color and elevation maps from the Lunar Reconnaissance Orbiter (LRO) mission, these visualizations recreate with unprecedented fidelity what the crew of Apollo 13 could see as they flew around the far side of the Moon. Several Apollo 13 photographs are at the bottom of the page for comparison. These visualizations have been incorporated into the multimedia recreation of the entire Apollo 13 mission in real time at apolloinrealtime.org.
Apollo 13 would have been the third lunar landing mission in the Apollo program. But 56 hours into the flight, an explosion in the Service Module changed the flight into a rescue mission. The crew was forced to use the Lunar Module as a lifeboat, and rather than landing on the Moon, they were limited to observing and photographing it from hundreds of kilometers above the surface.
Recreating what they saw requires not only excellent maps but also knowledge of the spacecraft's flight path — all of the animations on this page are views from the position of the spacecraft at specific times during their flight behind the Moon, using the same focal lengths as the lenses on board.
The trajectory used for these visualizations was derived from the position and speed at pericynthion (closest point to the Moon) listed in Table 4-III of the Apollo 13 Mission Report. The inclination and nodes were found using a second point on the path from Table 4-II — the center of the Moon and two points on the path are sufficient to define the orbit plane. The resulting orbital elements are:
| Perifocal Distance | 1988.8 km |
| Eccentricity | 1.4462 |
| Inclination | 173.7° |
| Longitude of the Ascending Node | -150.74° |
| Argument of Periapsis | 28.7° |
| Mean Anomaly at Epoch | 0° |
| Epoch | April 15, 1970 00:33:57 UT |
| Gravitational Parameter | 4904.87 km3/s2 |
See also a slightly different and more complete reconstruction by Daniel Adamo in the Journal of Guidance, Control, and Dynamics (Adamo 2008).
The time ranges shown in the captions refer to Ground Elapsed Time (GET), the number of hours and minutes since liftoff, which occurred on April 11, 1970 at 1:13 p.m. Houston time. The Path and Perilune animations cover five hours of flight in a single minute of running time, but the rest of the animations cover five or ten minutes of flight in one or two minutes, speeding up time by a factor of only 5. When played back at 6 fps, the animations run at real-time speed.
Perilune 75:02:00 − 80:01:50. A nadir view of the Moon from the position of the Apollo 13 spacecraft. This covers the same time span as the Path animation and is available both with and without the annotations in the bottom right.
LOS 77:04:00 − 77:09:00. The Earth appears to set behind the Moon, which is illuminated solely by earthshine (sunlight reflected from Earth). Loss of signal (LOS) occurs when the Moon blocks the Earth from the point of view of the spacecraft. Radio communication between the crew and Mission Control in Houston is cut off until the spacecraft emerges from behind the Moon about 25 minutes later. The separate elements (Earth and Moon, starfield) are also available.
Sunrise 77:16:00 − 77:26:00. Apollo 13 emerges from the lunar night and begins to see sunlit terrain up close for the first time.
Chaplygin 77:26:00 − 77:31:00. Looking south, the astronauts can see the craters Keeler, Chaplygin, Marconi, and near the horizon, Gagarin and Isaev.
Tsiolkovskiy 77:31:00 − 77:36:00. To the south is the large Tsiolkovskiy crater, one of the few areas of dark mare basalt on the far side. The bright central peak creates a stark contrast.
Earthrise 77:32:40 − 77:37:40. The Earth emerges above the lunar horizon, and the crew can once again communicate with Mission Control. The West Coast of North America is visible in daylight, while the Sun has set in Houston.
Moscoviense 77:36:00 − 77:41:00. Mare Moscoviense (Sea of Moscow
) lies to the north of the Apollo 13 trajectory.
Crisium 77:39:00 − 77:44:00. Minutes after AOS (acquisition of signal), the astronauts point out several lunar features to each other that are visible in this animation, including Mare Smythii and Mare Crisium.
Photographs
These are a few of the hundreds of photographs taken by Apollo 13. Compare them to the visualizations. Every Apollo 13 photo can be found in the Apollo Image Atlas maintained by the Lunar and Planetary Institute.

AS13-60-8606. The eastern limb of the Moon not long after Apollo 13 experienced sunrise.
AS13-62-8912. This photograph of Chaplygin crater (center-left) was taken through one of the Lunar Module windows using a camera intended for surface photography (note the plus-shaped Réseau markings). Blurry, dark, vertical stripes are out-of-focus scale marks on the LM window, used to judge angles and distances. The hatch on the Command Module is prominent in the foreground.
AS13-60-8626. Tsiolkovskiy crater photographed with the 250mm telephoto lens.
AS13-60-8648. Mare Moscoviense taken with the 250mm telephoto lens.
AS13-61-8740. Mare Smythii is near the center of the image. To its right (north) are Neper crater (lighter in the center) and Mare Marginis (partly obscured by the spacecraft). Mare Crisium is on the horizon, with the splotchy Mare Undarum to its left (south).
Credits
Please give credit for this item to:
NASA's Scientific Visualization Studio
-
Visualizer
-
Ernie Wright
(USRA)

-
Ernie Wright
(USRA)
-
Scientist
-
Noah Petro
(NASA/GSFC)
-
Noah Petro
(NASA/GSFC)
-
Producer
- David Ladd (USRA)
-
Technical support
- Laurence Schuler (ADNET Systems, Inc.)
- Ian Jones (ADNET Systems, Inc.)
Missions
This page is related to the following missions:Datasets used
-
DEM (Digital Elevation Map) [LRO: LOLA]
ID: 653 -
SLDEM2015 (DIgital Elevation Model) [LRO/SELENE: LOLA/TC]
ID: 948A digital elevation model of the Moon derived from the Lunar Orbiter Laser Altimeter and the SELENE Terrain Camera. See the description in Icarus. The data is here.
See all pages that use this dataset -
LROC WAC Color Mosaic (Natural Color Hapke Normalized WAC Mosaic) [Lunar Reconnaissance Orbiter: LRO Camera]
ID: 1015This natural-color global mosaic is based on the 'Hapke normalized' mosaic from LRO's wide-angle camera. The data has been gamma corrected, white balanced, and range adjusted to more closely match human vision.
See all pages that use this dataset
Note: While we identify the data sets used on this page, we do not store any further details, nor the data sets themselves on our site.
Related
- ID: 4989
 Visualization
 - ID: 4918
 Visualization
 - ID: 4883
 Visualization
 - ID: 4803
 Visualization
 - ID: 13575
 Produced Video
 - ID: 13537
 Produced Video
Used as a Source In
- ID: 13814
 Produced Video
Release date
This page was originally published on Monday, February 24, 2020.
This page was last updated on Sunday, February 2, 2025 at 10:46 PM EST.