Ten-Year Gap in Major Hurricanes Continues
Could the first tropical storm of the Atlantic hurricane season break the 10-year “hurricane drought” record?
It has been a decade since the last major hurricane, Category 3 or higher, has made landfall in the United States. This is the longest period of time for the United States to avoid a major hurricane since reliable records began in 1850. According to a NASA study, a 10-year gap comes along only every 270 years.
The National Hurricane Center calls any Category 3 or more intense hurricane a “major” storm. It should be noted that hurricanes making landfall as less than Category 3 can still cause extreme damage, with heavy rains and coastal storm surges. Such was the case with Hurricane Sandy in 2012.
Timothy Hall, a research scientist who studies hurricanes at NASA’s Goddard Institute for Space Studies, New York and colleague Kelly Hereid, who works for ACE Tempest Re, a reinsurance firm based in Connecticut, ran a statistical hurricane model based on a record of Atlantic tropical cyclones from 1950 to 2012 and sea surface temperature data.
The researchers ran 1,000 computer simulations of the period from 1950-2012 – in effect simulating 63,000 separate Atlantic hurricane seasons. They also found that there is approximately a 40% chance that a major hurricane will make landfall in the United States every year.
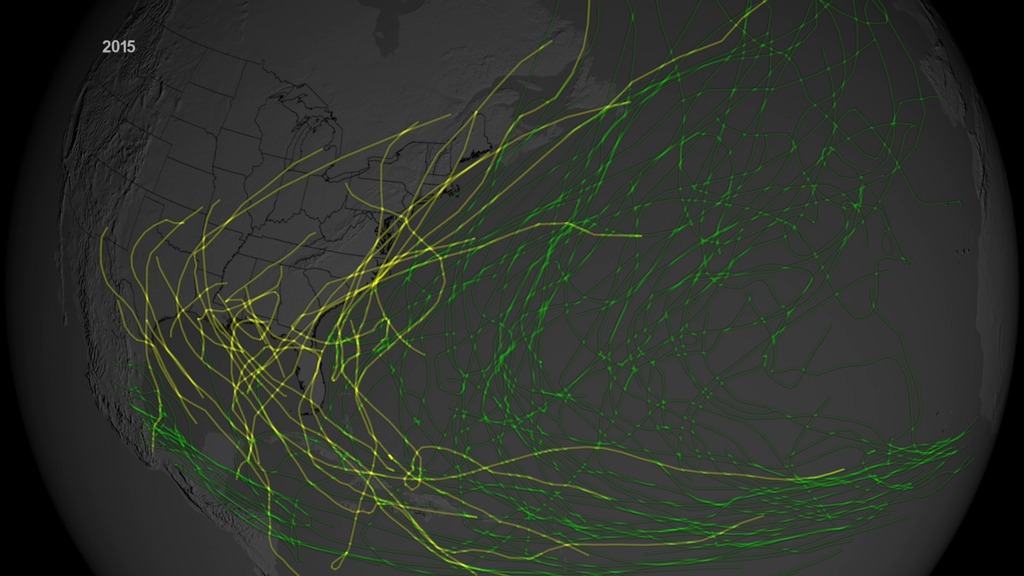
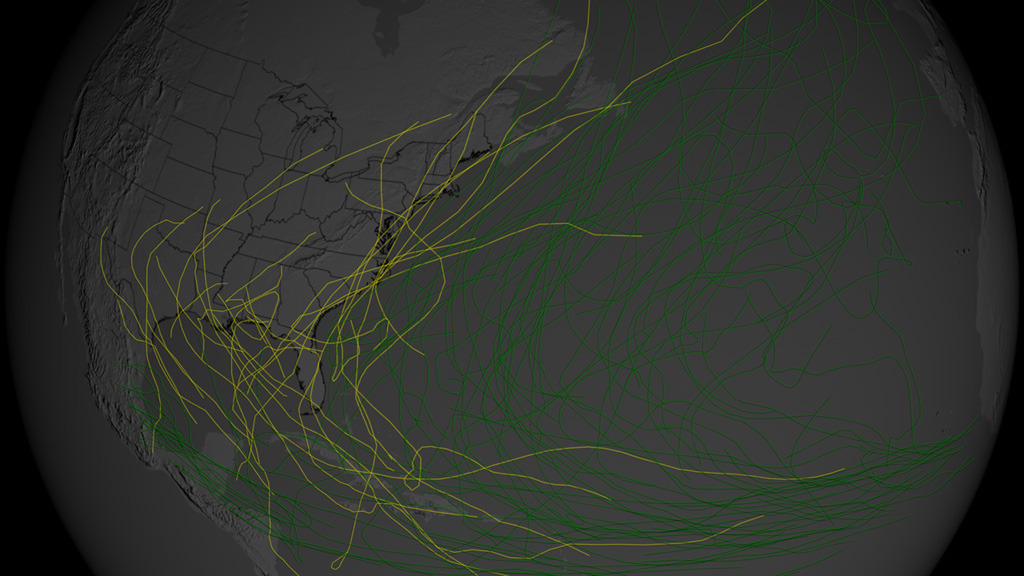
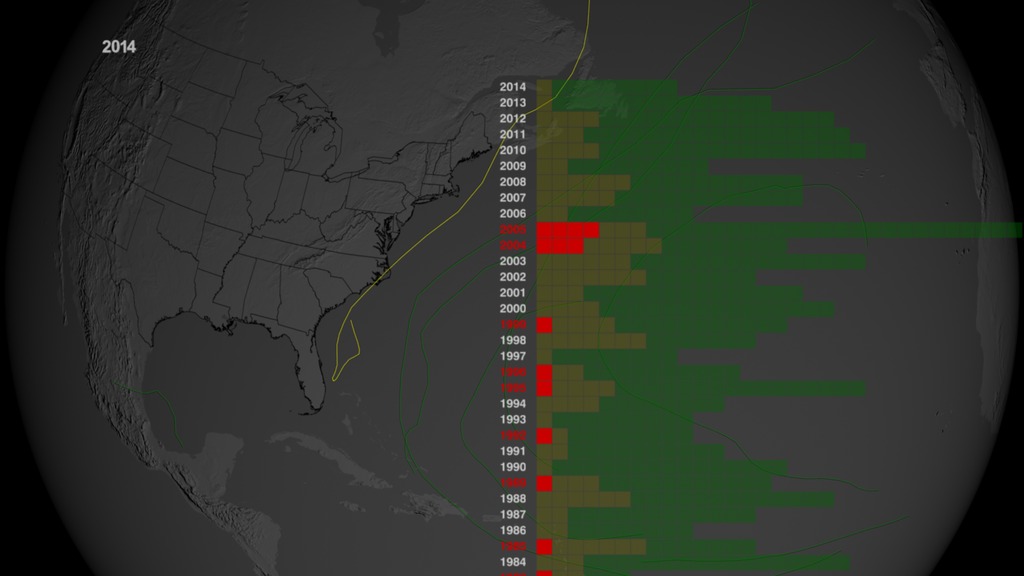
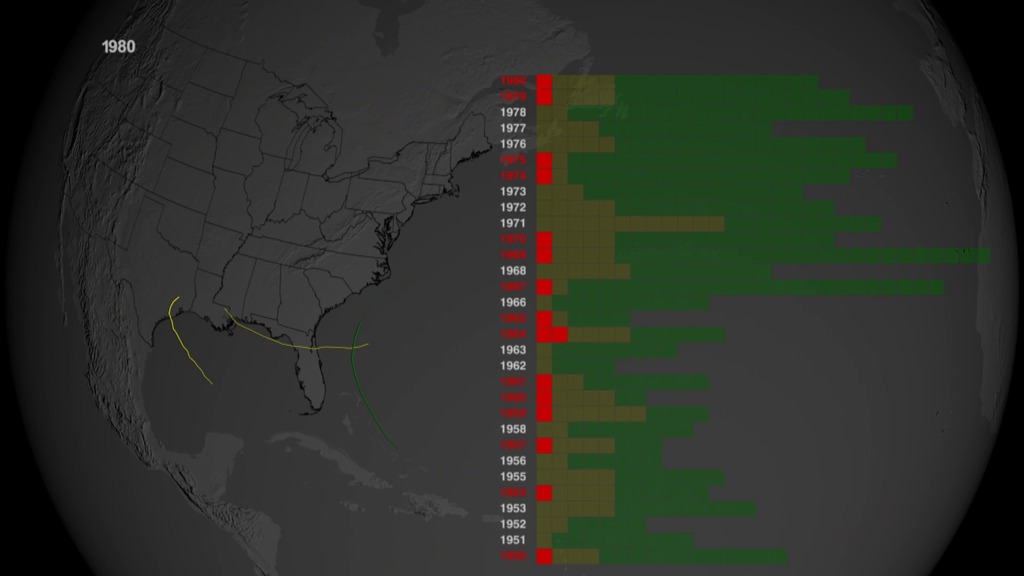
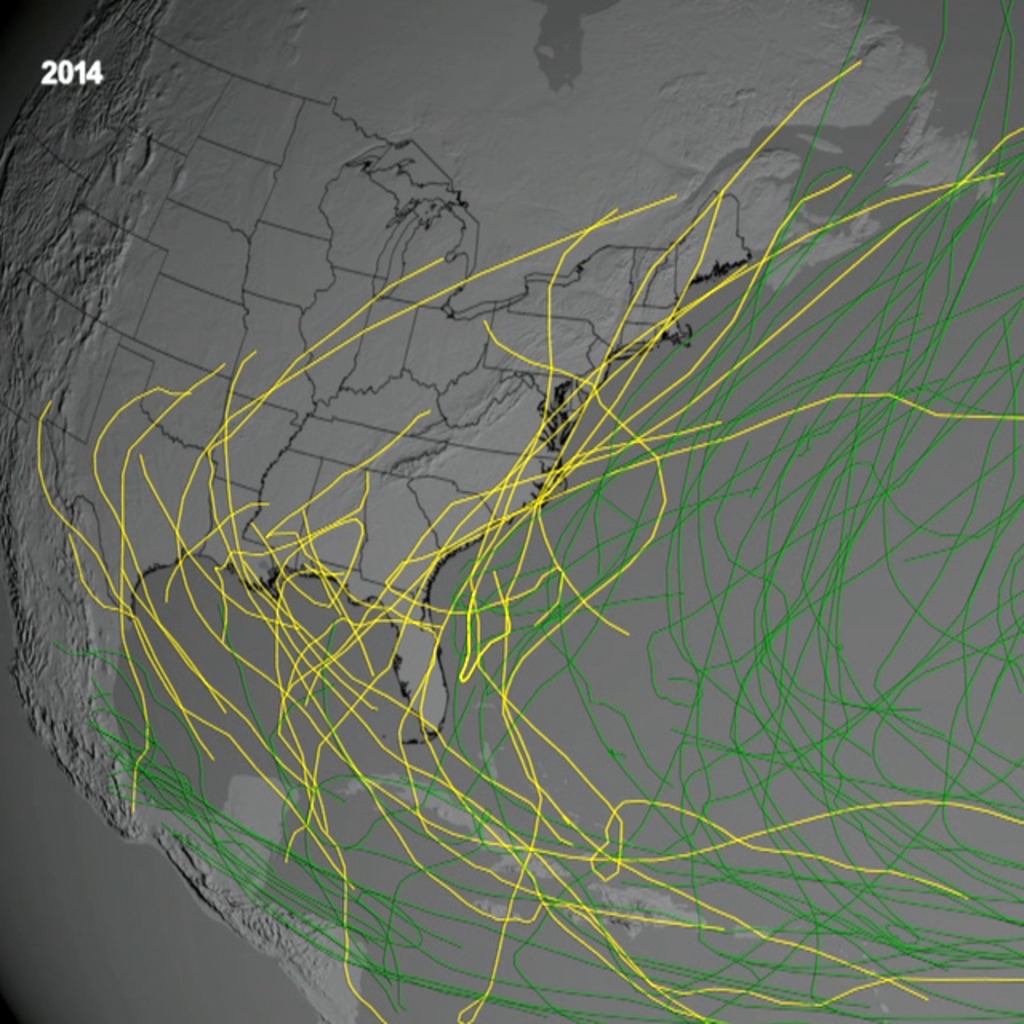
These visualizations show hurricane tracks from 1980 through 2015. Green tracks are storms that did not make landfall in the U.S.; yellow tracks are storms that made landfall but were not Category 3 or higher; and red tracks are Category 3 or higher hurricanes that did make landfall.
Research: The frequency and duration of U.S. hurricane droughts
Journal: Geophysical Research Letters, May 5, 2015
Complete transcript available.
Watch this video on the NASA Goddard YouTube channel.
Music credits: Climb the Ladder by Kurt Oldman in the KillerTracks Catalog
Hurricane tracks from 1980 through 2015. Green tracks did not make landfall in US; yellow tracks made landfall but were not Category 3 or higher hurricanes at landfall; red tracks made landfall and were Category 3 or higher. A corresponding chart on the right accumulates the number and types of storms for each year.
Tracks layer with alpha channel.
Dates layer wih alpha channel.
Table layer with alpha channel.
Accumulated tracks from 2006 through 2015 with alpha channel.

A background Earth layer.
For More Information
Credits
Please give credit for this item to:
NASA's Goddard Space Flight Center
-
Data visualizer
-
Greg Shirah
(NASA/GSFC)

-
Greg Shirah
(NASA/GSFC)
-
Scientists
- Timothy Hall (NASA/GSFC GISS)
- Kelly Hereid (ACE Tempest Reinsurance, Ltd.)
-
Producer
- Joy Ng (USRA)
-
Support
- Jefferson Beck (USRA)
- Ryan Fitzgibbons (USRA)
- Leslie McCarthy
Series
This page can be found in the following series:Related
- ID: 13216
![Complete transcript available.Music credits: “Northern Breeze” by Denis Levaillant [SACEM], “Stunning Horizon” by Maxime Lebidois [SACEM], Ronan Maillard [SACEM], “Magnetic Force” by JC Lemay [SACEM] from Killer TracksWatch this video on the NASA Goddard YouTube channel.This video can be freely shared and downloaded. While the video in its entirety can be shared without permission, some individual imagery provided by pond5.com is obtained through permission and may not be excised or remixed in other products. Specific details on stock footage may be found here. For more information on NASA’s media guidelines, visit https://www.nasa.gov/multimedia/guidelines/index.html.Notes on footage:• 0:03 - 0:17 provided by Pond5• 1:38 - 1.43 provided by Pond5• 1:49 - 1:52 provided by Pond5• 2:21 - 1:27 provided by Pond5](/vis/a010000/a013200/a013216/13216_NASA_Has_Eyes_On_The_Atlantic_Hurricane_Season_YouTube.00050_print.jpg) Produced Video
Produced Video - ID: 12269
- ID: 12206
 Produced Video
Older Versions
- ID: 11891
 Produced Video
 - ID: 4287
- ID: 11870
 Produced Video
 - ID: 11871
 Produced Video
Release date
This page was originally published on Friday, May 27, 2016.
This page was last updated on Wednesday, May 3, 2023 at 1:48 PM EDT.