Next Tape

Goddard TV Video Tape: G2007-001HD -- NASA's HD Climate Change Resource Tape


Movie

Title

This animation illustrates the dynamics of the network of subglacial lakes far beneath the ice streams of Antarctica. 
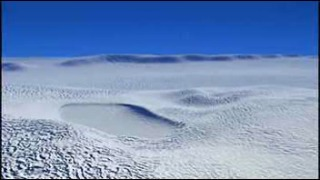
Antarctic Sub-glacial Lakes
This is the standard definition version MPEG of the Ice Albedo(clean ice case) Animation. 
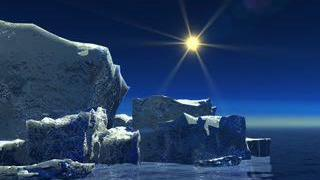
Ice Albedo: Bright White Reflects Light
This is the high definition version of the Ice Albedo-Global animation MPEG. 
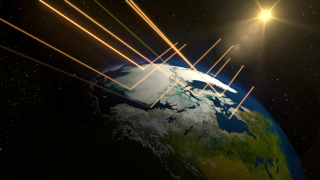
Ice Albedo - Global View
Animation zooms to view the ice shelf as seen from the northwest coastline and sequences through the satellite images showing the ice shelf breakup. An  overlay shows the date and time, the region of interest and the area of the ice shelf broken. 
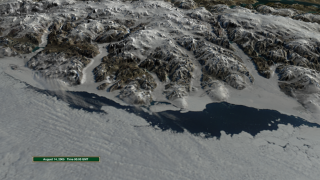
Ayles Ice Shelf Breakup Viewed from Northwest Coastline
This animation shows seasonal changes in landcover and Arctic sea ice from 2005-09-21 through 2006-09-20. 
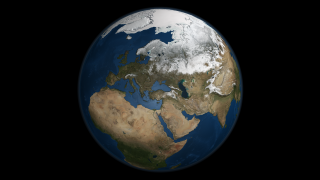
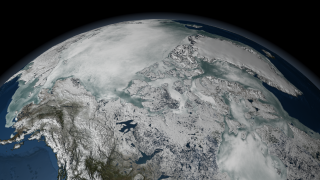
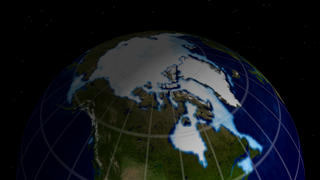
Global Rotation Showing Seasonal Landcover and Arctic Sea Ice
ICESat elevation data taken on June 2, 2006 is shown in orange. The underlying gray 'shadow' corresponds to where the elevation data lies on the surface.  The underlying MODIS data is a 3 day average taken in the month of December 2005. 
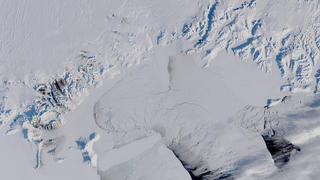
Antarctic Plumbing: Lake Englehardt's Subglacial Hydraulic System
This animation shows a 32-day moving average of SST data spanning July 4, 2002 to October 23, 2006.  The animation starts over Europe, pans across the Atlantic, and settles in over the Gulf Stream. 
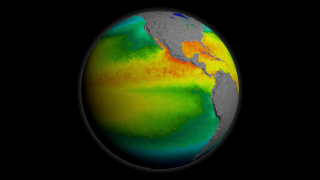
MODIS Sea Surface Temperature Highlighting the Gulf Stream (2002 to 2006)
This animation shows a 32-day moving average of SST data over the Pacific spanning July 4, 2002 to October 23, 2006.  This  product is available through our Web Map Service . MODIS Sea Surface Temperature from 2002 to 2006
This animation shows a 32-day moving average of global SeaWiFS data spanning from August 29, 1997 to October 23, 2006.  This  product is available through our Web Map Service . 
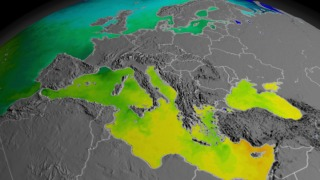
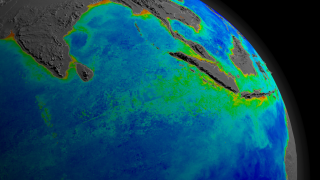
SeaWiFS Biosphere from 1997 to 2006
Arctic Sea ice from Sep 21, 1979 
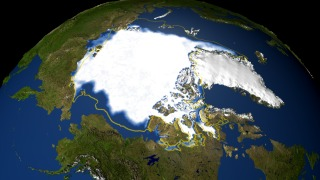
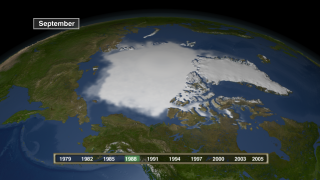
Arctic Sea Ice Minimum Concentration for 1979-2006
This animation shows the flow of the Jakobshavn glacier in 2000, followed by a time series of the glacier's retreat from 2001 through 2006.  A colored line and date marks the position of the glacier's calving front each year. 
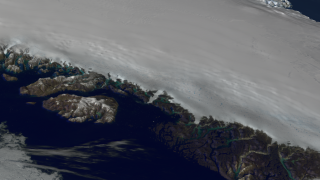
Jakobshavn Glacier Flow in the year 2000 and Calving Front Retreat from 2001 to 2006
This animation shows the seasonal advance and retreat of sea ice over the Arctic from 8/5/2005 through 8/4/2006. The yearly cycle is repeated three times while the camera circles the Arctic, providing a view of the sea ice from a wide range of viewpoints. 
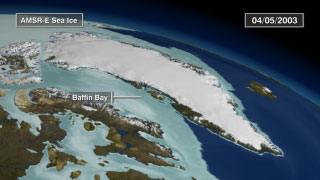
Loop of AMSR-E Daily Arctic Sea Ice from Aug 2005 to Aug 2006
This animation shows the three-year moving average September mean sea ice concentration in the northern hemisphere from 1979-1981 through 2003-2005. A date bar indicates the range of years averaged to compute the September mean shown. Three-Year Average September Minimum Sea Ice Concentration 1979 - 2005
This animation shows monthly average sea ice climatology from September through August displayed at a rate of two months per second.  The month is shown in the upper right corner. 
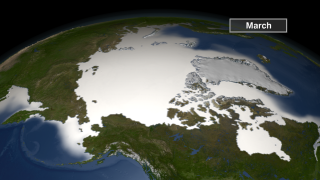
Arctic Monthly Average Sea Ice Climatology
Carbon Dioxide graph from 1980 to 2005 over global biosphere data 
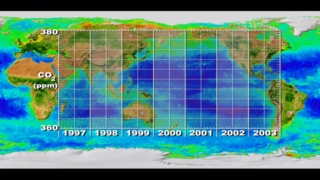
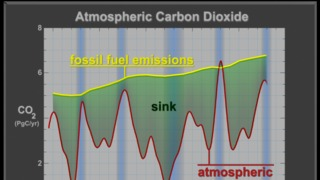
Missing Carbon: Global Biosphere with Carbon Dioxide Growth Overlaid
Graph with fossil fuel emissions, atmospheric increase, sink, and ENSO bars Atmospheric Carbon Dioxide from 1980 to 2005
Carbon Dioxide graphs from the last 400,000; 1000; and 25 year ranges 
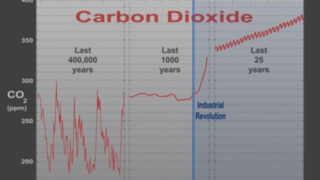
Missing Carbon: CO2 Growth in the last 400,000 Years
The B-15a iceberg on Oct. 27, 2005 
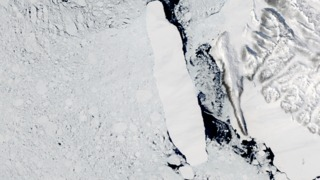
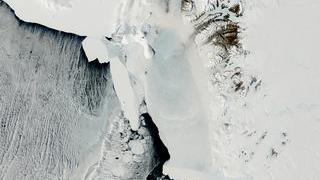
Antarctic Iceberg Breaks Apart
VIDEO WITH NARRATION AND NO CAPTIONS    Complete transcript  available. A Tour of the Cryosphere
November 9, 2004 Iceberg Slows Shipping Lanes to McMurdo Station
Aura passing over Europe collecting (simulated) OMI data. 
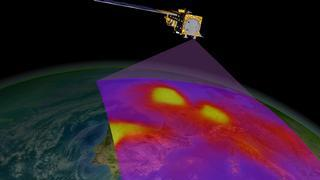
Simulated Aura/OMI Data Collection
Print Resolution Image of North Pole Sea Ice Polar Sea Ice in the 1990s
September 22, 2002 Seasonal Ice Flow Backed Up