Loop of AMSR-E Daily Arctic Sea Ice from Aug 2005 to Aug 2006
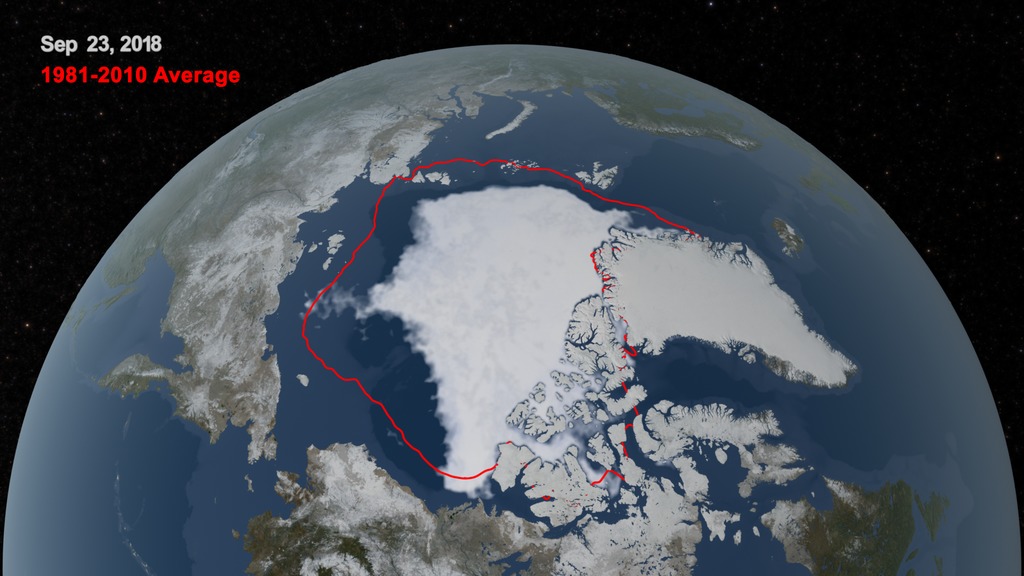
Sea ice is frozen seawater floating on the surface of the ocean. Some sea ice is permanent, persisting from year to year, and some is seasonal, melting and refreezing from season to season. Sea ice is almost always in motion, reacting to ocean currents and to winds. The AMSR-E instrument on the Aqua satellite acquires high resolution measurements of the 89 GHz brightness temperature near the poles. Because this is a passive microwave sensor and independent of atmospheric effects, this sensor is able to observe the entire polar region every day, even through clouds and snowfalls. This animation of AMSR-E 89 GHz brightness temperature in the northern hemisphere during late 2005 and early 2006 clearly shows the dynamic motion of the ice as well as its seasonal expansion and contraction. This animation shows the seasonal advance and retreat of sea ice over the Arctic from 8/5/2005 through 8/4/2006. The false color of the sea ice, derived from the AMSR-E 6.25 km 89 GHz brightness temperature, highlights the fissures in the sea ice by showing warmer areas of ice in a deeper blue and colder areas of sea ice in a brighter white. The sea ice extent is defined by a three-day moving average of the AMSR-E 12.5 km sea ice concentration, showing as ice all areas having a sea ice concentration greater than 15%.
This animation shows the seasonal advance and retreat of sea ice over the Arctic from 8/5/2005 through 8/4/2006. The yearly cycle is repeated three times while the camera circles the Arctic, providing a view of the sea ice from a wide range of viewpoints.

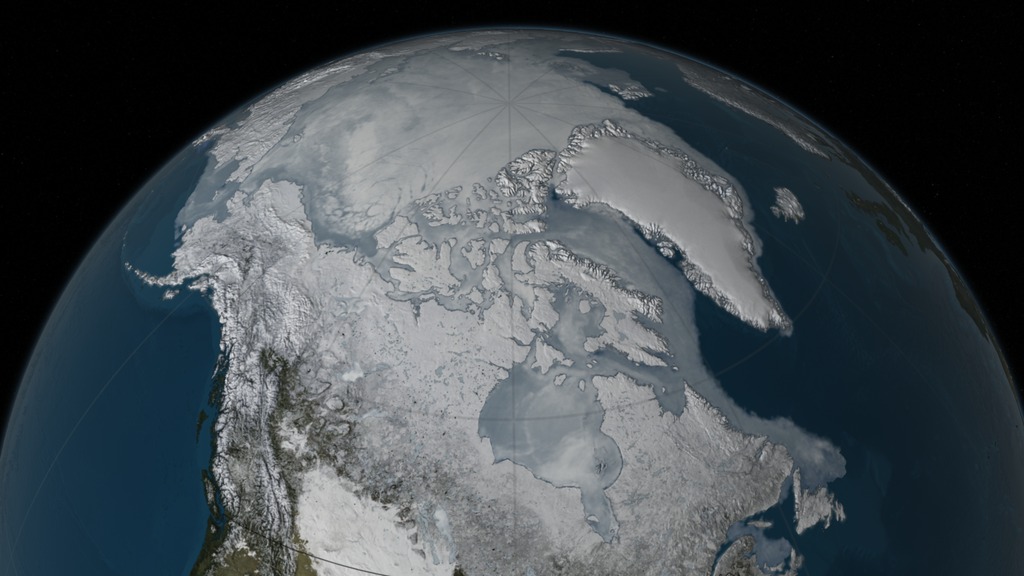
This image shows the sea ice above North America on 04/26/2006.
This image shows the Arctic sea ice north of Russia on 10/09/2005, as viewed from over the East Siberian Sea.
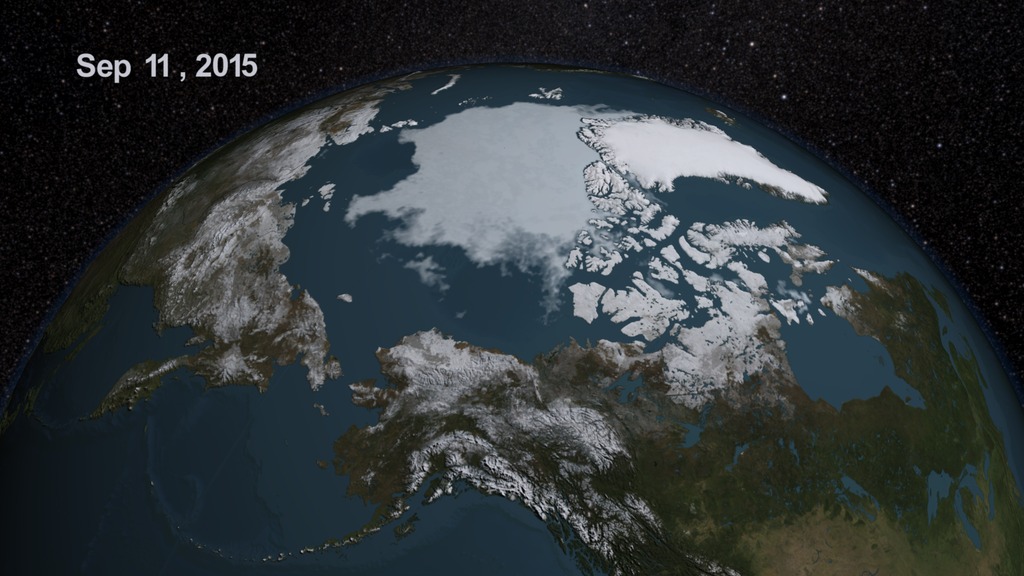
This image shows the Arctic sea ice above North America on 09/27/2005, viewed over the Beaufort Sea.
This image shows the Arctic sea ice north of Russia on 09/27/2005, as viewed from over the East Siberian Sea.
This image shows the Arctic sea ice on 12/01/2005 as viewed from the Bering Strait.

This image shows the color bar applied to the AMSR-E brightness temperature data.
Credits
Please give credit for this item to:
NASA/Goddard Space Flight Center Scientific Visualization Studio
The Blue Marble data is courtesy of Reto Stockli (NASA/GSFC).
-
Visualizer
-
Cindy Starr
(Global Science and Technology, Inc.)

-
Cindy Starr
(Global Science and Technology, Inc.)
-
Animators
-
Alex Kekesi
(Global Science and Technology, Inc.)
- Ryan Boller (NASA/GSFC)
- Stuart A. Snodgrass (Global Science and Technology, Inc.)
-
Alex Kekesi
(Global Science and Technology, Inc.)
-
Scientists
- Waleed Abdalati (NASA/GSFC)
- Walt Meier (NSIDC)
Missions
This page is related to the following missions:Series
This page can be found in the following series:Datasets used
-
[Terra: MODIS]
ID: 116 -
Daily L3 6.25 km 89 GHz Brightness Temperature (Tb) [Aqua: AMSR-E]
ID: 236 -
Sea Ice Concentration (Daily L3 12.5km Tb, Sea Ice Concentration, and Snow Depth) [Aqua: AMSR-E]
ID: 237
Note: While we identify the data sets used on this page, we do not store any further details, nor the data sets themselves on our site.
Related
- ID: 4684
 Visualization
 - ID: 4440
 Visualization
 - ID: 4355
 Visualization
Release date
This page was originally published on Saturday, September 30, 2006.
This page was last updated on Wednesday, May 3, 2023 at 1:55 PM EDT.