A newer version of this visualization is available.
Three-Year Average September Minimum Sea Ice Concentration 1979 - 2005
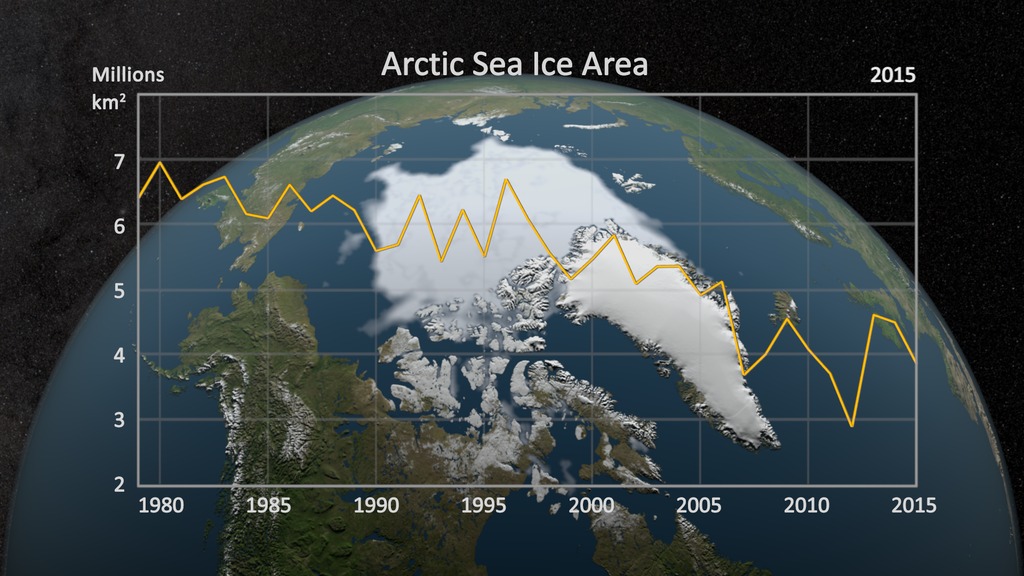
Sea ice is frozen seawater floating on the surface of the ocean. Some sea ice is permanent, persisting from year to year, and some is seasonal, melting and refreezing from season to season. Because the extent of the sea ice is important both for the Arctic marine ecology and for the role it plays in the Earth's climate, understanding the variation of this extent during the year and from year-to-year is vital. Each year, the minimum sea ice extent in the northern hemisphere occurs at the end of summer, in September. By comparing the extent of the sea ice in September over many successive years, long term trends in the polar climate can be assessed. This animation shows the three-year moving average September mean sea ice concentration in the northern hemisphere from 1979-1981 through 2003-2005. Since 1999, this minimum has shown an ice extent that is consistently 10% to 15% smaller than the average extent over the past 20 years.
This animation shows the three-year moving average September mean sea ice concentration in the northern hemisphere from 1979-1981 through 2003-2005. A date bar indicates the range of years averaged to compute the September mean shown.
This element is the three-year moving average September mean sea ice concentration in the northern hemisphere from 1979-1981 through 2003-2005 without the date bar overlay.
This element contains the overlay date bar that indicates the range of years averaged to compute the September mean along with a month label in the upper left corner.
This animation dissolves between the 1979-1981 average September mean sea ice concentration and the 2003-2005 average September mean sea ice concentration.

This still image shows the September mean sea ice concentration computed from the years 2003 through 2005.
Credits
Please give credit for this item to:
NASA/Goddard Space Flight Center Scientific Visualization Studio
The Blue Marble data is courtesy of Reto Stockli (NASA/GSFC).
-
Visualizer
-
Cindy Starr
(Global Science and Technology, Inc.)

-
Cindy Starr
(Global Science and Technology, Inc.)
-
Animators
-
Greg Shirah
(NASA/GSFC)
- Stuart A. Snodgrass (Global Science and Technology, Inc.)
-
Greg Shirah
(NASA/GSFC)
-
Scientists
- Waleed Abdalati (NASA/GSFC)
- Walt Meier (NSIDC)
Series
This page can be found in the following series:Datasets used
-
[DMSP: SSM/I]
ID: 11Defense Meteorological Satellite Program Special Sensor Microwave Imager
See all pages that use this dataset -
NSIDC SSMI-derived September Minimum Sea Ice Concentration
ID: 277Date: 2004
See all pages that use this dataset
Note: While we identify the data sets used on this page, we do not store any further details, nor the data sets themselves on our site.
Newer Versions
- ID: 4435
 Visualization
Release date
This page was originally published on Wednesday, September 27, 2006.
This page was last updated on Wednesday, May 3, 2023 at 1:55 PM EDT.