Landsat
Overview
Since 1972, Landsat satellites have consistently gathered data about our planet for the benefit of the U.S. and the world. The Landsat data archive is the longest continuous remotely sensed global record of Earth’s surface, with all the data free and available to the public. The Landsat satellite missions, jointly managed by NASA and the U.S. Geological Survey, are a central pillar of our national remote sensing capability and established the U.S. as a leader in land imaging.
Landsat 9 is the next satellite in the program, and will add more than 700 scenes a day to this invaluable archive. As Earth’s population approaches 8 billion, Landsat 9 will extend our ability to detect and characterize land surface changes, and will do so at a scale where researchers can differentiate between natural and human-induced change.
Land cover and land use are changing globally at rates unprecedented in human history. These changes bring profound consequences for weather, ecosystems, resource management, the economy, carbon storage and emissions, human health, and other aspects of society. Landsat datasets are a critical tool in monitoring and managing essential resources in a changing world.
Below are highlights of Landsat videos and graphics. Follow this link to see the entire collection of Landsat multimedia.
How It Works
- ID: 14903
 Produced Video
 - ID: 14848
 Produced Video
 - ID: 14712
 Produced Video
 - ID: 14565

- ID: 14526
 Produced Video
 - ID: 14478
 Produced Video
 - ID: 14403
- ID: 14262
 Produced Video
 - ID: 14336

- ID: 14291
 Produced Video
 - ID: 14086
![The data from Landsat 9 is available for anyone to download from the USGS data archive. Launched on Sept. 27, 2021, the new satellite and its instruments went through testing and calibration by the mission team. Now, with both Landsat 9 and Landsat 8 in orbit, there will be high-quality, medium-resolution images of Earth’s landscapes and coastal regions every eight days.Music: Amazing Discoveries by Damien Deshayes [SACEM], published by KTSA Publishing [SACEM] available from Universal Production Music; The Troubleshooter by Anders Johan Greger Lewen [STIM], published by Primetime Productions, Ltd [PRS]; Bright Patterns by Gregg Lehrman [ASCAP] and John Christopher Nye [ASCAP], published by Soundcast Music [SESAC]Complete transcript available.Watch this video on the NASA Goddard YouTube channel.](/vis/a010000/a014000/a014086/14086_Landsat9_data-print.jpg) Produced Video
Produced Video - ID: 13987
 Produced Video
 - ID: 13890
 Produced Video
 - ID: 13946
 Produced Video
 - ID: 13259
 Produced Video
 - ID: 20322
 Animation
 - ID: 4745
 Visualization
 - ID: 11481
 Produced Video
 - ID: 11491
 Produced Video
 - ID: 12754
 Produced Video
 - ID: 13712
 Produced Video
 - ID: 13917
 Produced Video
 - ID: 11051
 Produced Video
 - ID: 13329
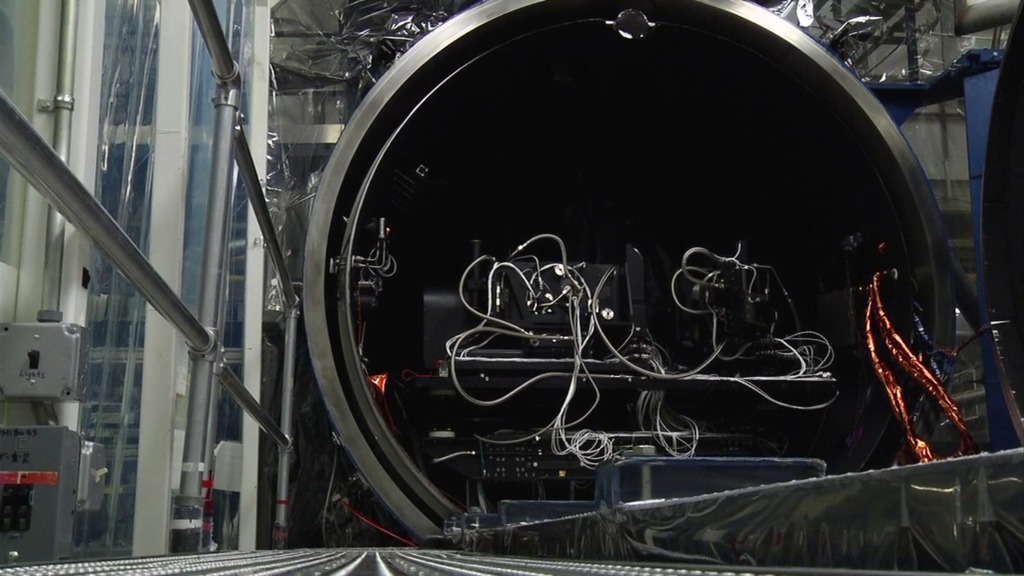
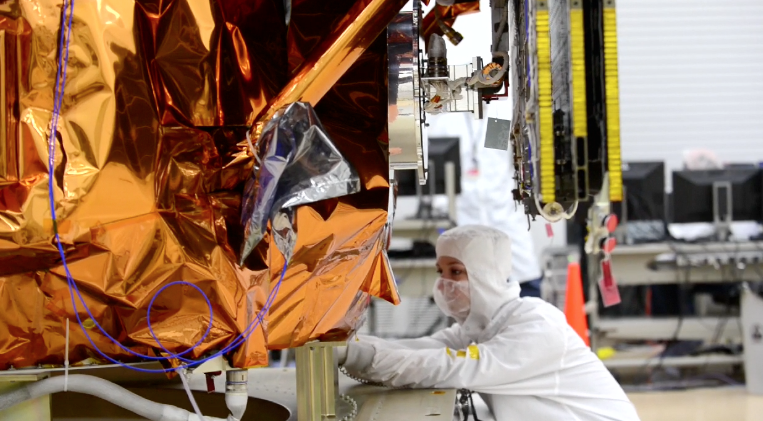
![The Operational Land Imager 2, or OLI-2, will detect visible and infrared light from Earth's surface, providing data on our changing planet. OLI-2 was built and tested at Ball Aerospace in Boulder, Colorado. Landsat 9, a partnership between NASA and the U.S. Geological Survey, is a series of satellites that began with Landsat 1 in 1972.Music: Bit Streaming, composed by David Edwards [ASCAP], published by Soundcast Music [SESAC] Complete transcript available.](/vis/a010000/a013300/a013329/13329_OLI-2_Ships_still.jpg) Produced Video
Produced Video - ID: 13292
![The Thermal Infrared Sensor 2 (TIRS-2) has passed its tests at NASA's Goddard Space Flight Center and traveled across the country to be integrated onto Landsat 9.Music: Last Outpost by Lennert Busch [PRS], published by Sound Pocket Music [PRS]Complete transcript available.Watch this video on the NASA Goddard YouTube channel.](/vis/a010000/a013200/a013292/TIRS-2_shipping_20190813-28_print.jpg) Produced Video
Produced Video 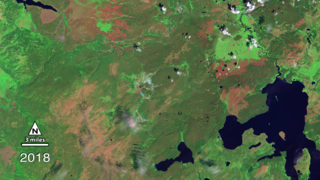 Section
- ID: 11166
 Produced Video
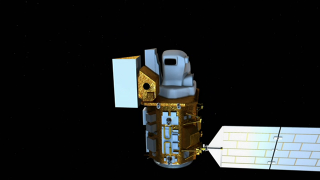
- ID: 10859
 Produced Video
Benefits to Society
- ID: 13889
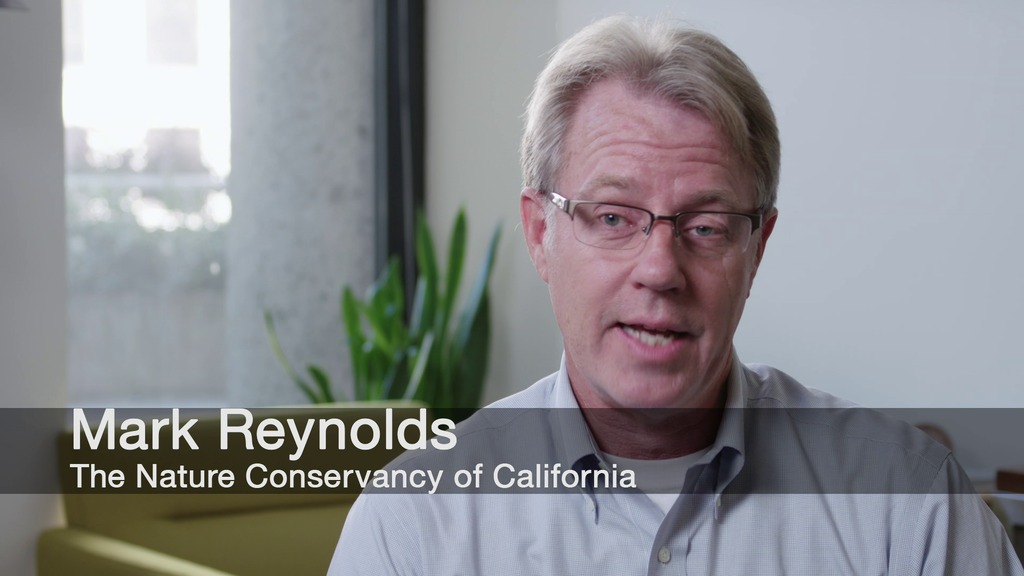
![Landsat 9, launching September 2021, will collect the highest quality data ever recorded by a Landsat satellite, while still ensuring that these new measurements can be compared to those taken by previous generations of the Earth-observing satellite. Landsat 9 will enable or improve measurements of water quality, glacial ice velocity, crop water usage, and much more.Music: The Waiting Room by Sam Dodson [PRS], Afterglow by Christopher Timothy White [PRS], both published by Atmosphere Music Ltd [PRS]; and Inner Strength by Brava/Dsilence/Input/Output [SGAE], published by El Murmullo Sarao [SGAE] and Universal Sarao [SGAE]. Available from Universal Production Music. Complete transcript available.Watch this video on the NASA Goddard YouTube channel.](/vis/a010000/a013800/a013889/13889_Landsat9_at_Work_print.png) Produced Video
Produced Video - ID: 13800
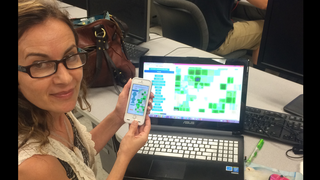
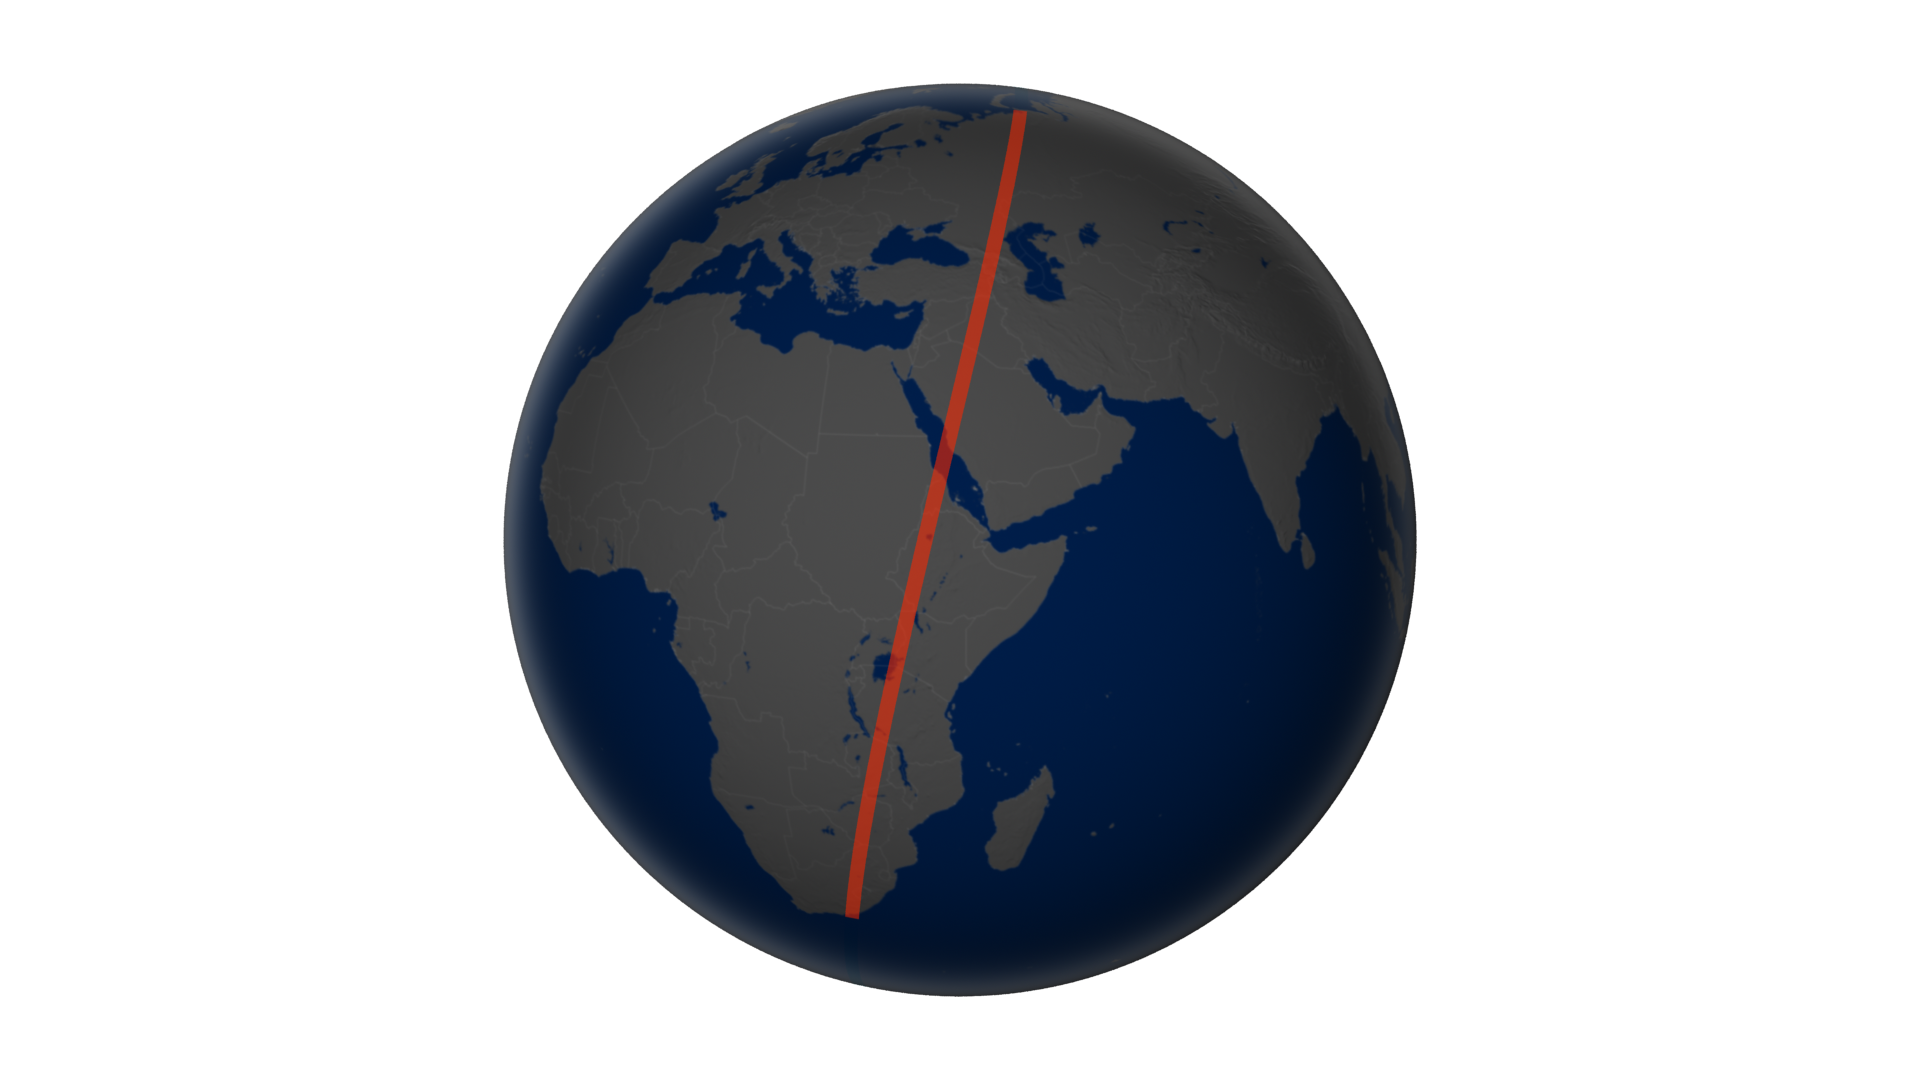
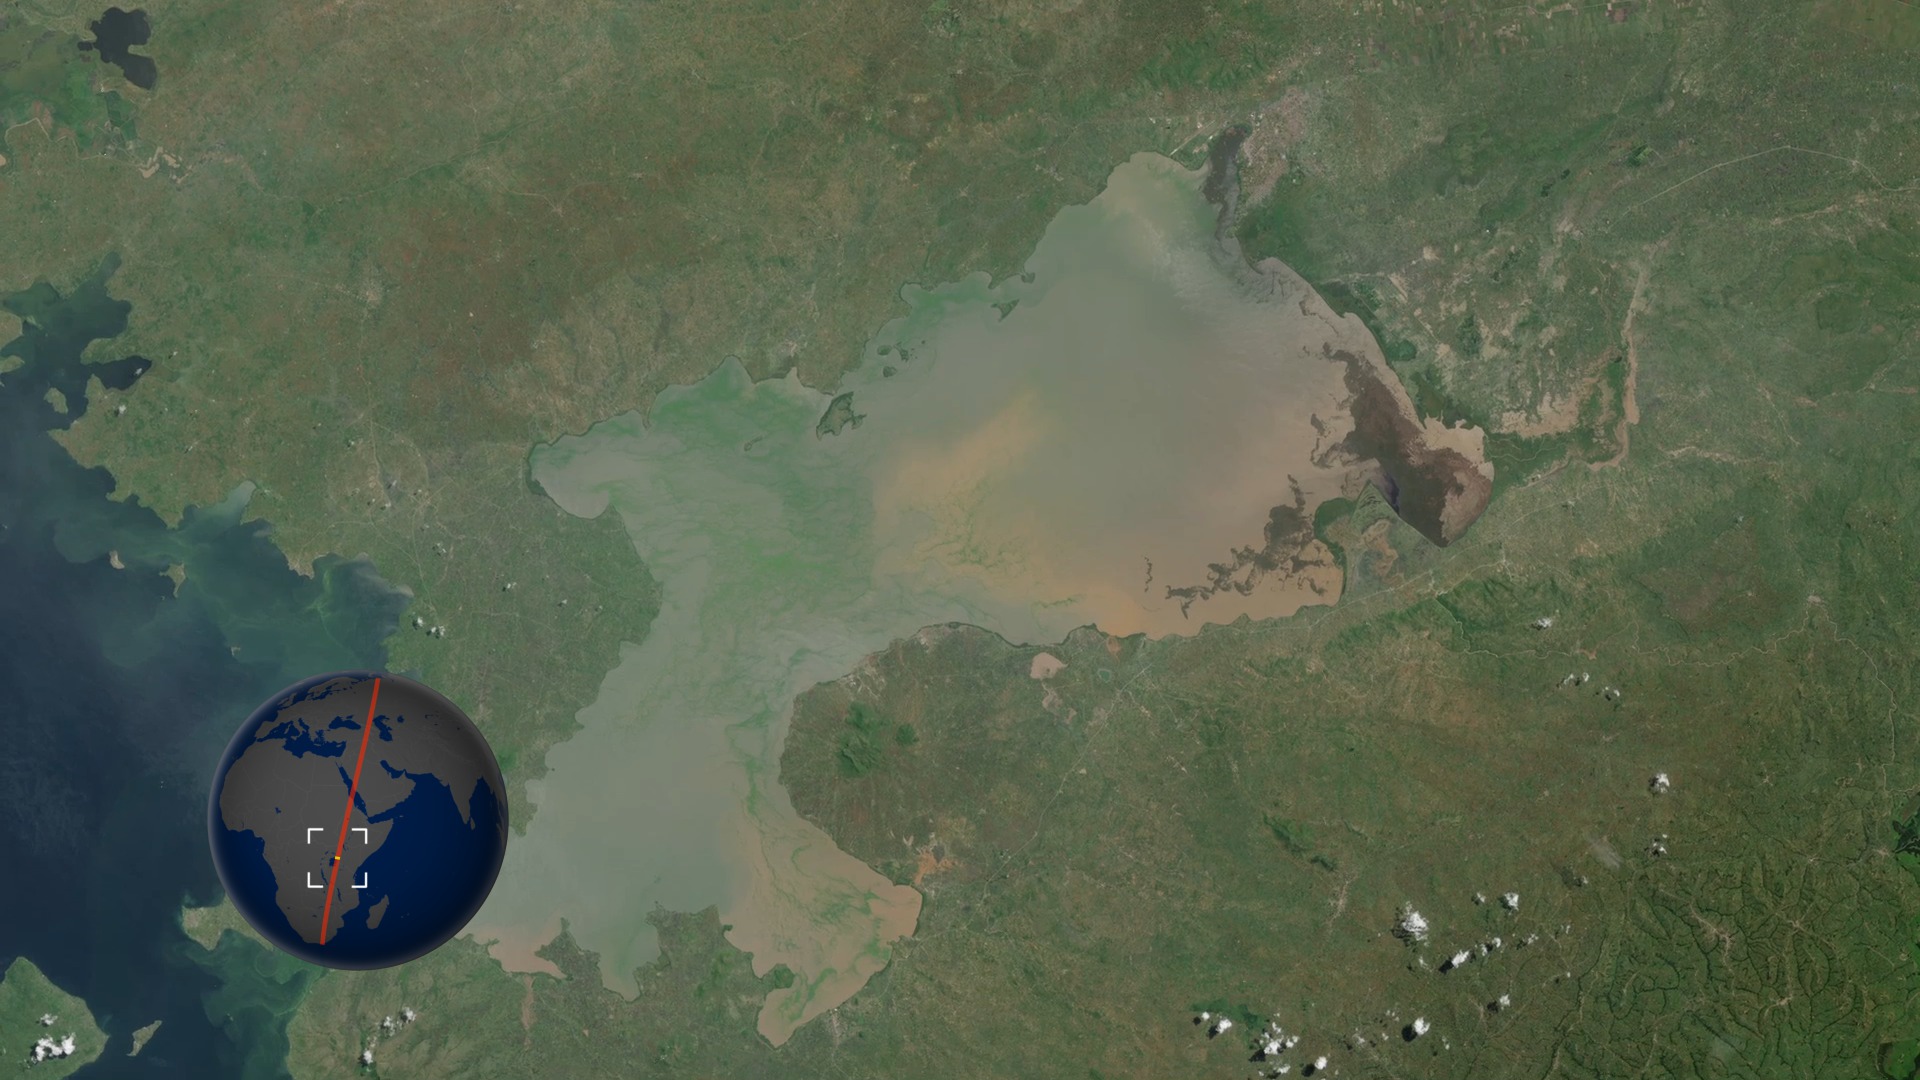
![From space, satellites including the NASA and U.S. Geological Survey’s (USGS) Landsat 8 can help scientists identify lakes where an algal bloom has formed. It’s a complicated data analysis process, but one that researchers are automating so resource managers around the country can use the satellite data to identify potential problems.Music: Light From Dark by Adam Salkedi, Neil Pollard [PRS], published by Atmosphere Music Ltd.; Experimental Design by Laurent Dury [SACEM], published by Koka Media; Against The Wall by Benjamin Peter McAvoy [PRS], published by Sound Pocket Music; Brainstorming by Laurent Dury[SACEM], published by Koka Media; Together As One by Le Fat Club [SACEM], Olivier Grim [SACEM]; published by Koka Media.Complete transcript available.Watch this video on the NASA Goddard YouTube channel.](/vis/a010000/a013800/a013800/13800_aquatic_reflection_poster.png) Produced Video
Produced Video - ID: 13734
![In a constantly changing world, the protection of our planet’s endangered species and ecosystems is a priority for ecologists. Recently, a group of researchers at the University of Idaho have worked to combine their extensive on-the-ground research of the endangered Yuma Ridgway’s rail with Landsat’s vast archive, to create a habitat suitability model that can be used by land managers. By using this model, it gives land managers the tools and data to make decisions of how to best carry out conservation for the Yuma Ridgway’s rail on a year to year basis. With the success of this initial model, it’s hypothesized that this tool will be able to help additional species in the area and others down the road.https://sites.google.com/view/habitatsuitability-yrr/homeComplete transcript available.Music:-Throwing Light, by Paul Werner [BMI], Published by Ingenious Music Publishing Ltd. [PRS]-Into the Atmosphere, by Sam Joseph Delves [PRS], published by Koka Media [SACEM]
-Beauty Ritual, by Aurelien Riviere [PRS], published by Koka Media [SACEM]
Watch this video on the NASA Goddard YouTube channel.](/vis/a010000/a013700/a013734/13734_habitat_rail_poster_print.jpg) Produced Video
Produced Video - ID: 13907
![During the summer of 1975, Jacques Cousteau and his divers helped NASA determine if Landsat could measure the depth of shallow ocean waters. The story of this NASA-led satellite bathymetry experiment unfolds through the photography and expedition documents preserved by David Lychenheim, the expedition’s communications engineer. Research done during that expedition determined that in certain conditions Landsat could measure depths up to 22 meters (72 feet), which gave birth to the field of satellite-derived bathymetry. This new technology enabled charts in clear water areas around the world to be revised, helping boats and deep-drafted supertankers avoid running aground on hazardous shoals or seamounts.Music: “Science of Life,” “Moving In Thought,” and “The Right Move” by Andrew Michael Britton [PRS] & David Stephen Goldsmith [PRS], “Midsummer” by Uwe Buschkotter [GEMA], “The Grand Opening” by Laurent Dury [SACEM], “Drifting Satellite” by Théo Boulenger [SACEM], “Man and Machine” by Larry Groupe [BMI], “A Little Optimism 1” by Joel Goodman [ASCAP], “Easy Does It” by Alchemist [SIAE], “Variations” by Stephan Sechi [ASCAP], “Bright and Playful” by Oscar Lo Brutto [PRS]; via Universal Production MusicComplete transcript available.Watch this video on the NASA Goddard YouTube channel.](/vis/a010000/a013900/a013907/13907_Landsat_Cousteau_poster.png) Produced Video
Produced Video - ID: 13723
![Data from NASA/USGS Landsat satellites show that during 1985-2016, vegetation in the arctic tundra showed a 38% increase in greenness – representing plants growing more, becoming denser, and/or shrubs encroaching on typical tundra grasses and moss.Complete transcript available.Music: The Rework, by Josslin Bordat [SACEM], published by Koka Media [SACEM], available from Universal Production Music](/vis/a010000/a013700/a013723/13723_ArcticGreening-468.jpg) Produced Video
Produced Video - ID: 13585
![Temperature data from the Landsat 8 satellite is used by scientists at University of Wisconsin-Madison to predict bird biodiversity in winter months. Turns out, having a habitat with pockets of different temperatures – like a grove of trees in an open field, or a nest or snow burrow – is especially important for small-bodied bird species and those threatened by climate change. Music: Life Cycles by Theo Golding [PRS], published by Atmosphere Music Ltd [PRS]Complete transcript available.Watch this video on the NASA Goddard YouTube channel.](/vis/a010000/a013500/a013585/13585_Bird_Temp_poster.png) Produced Video
Produced Video - ID: 13543
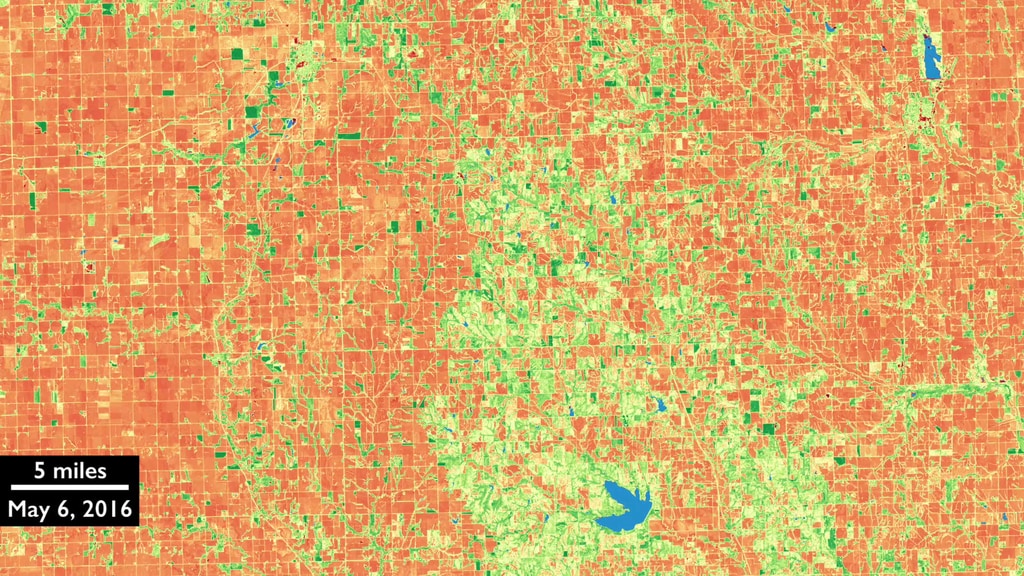
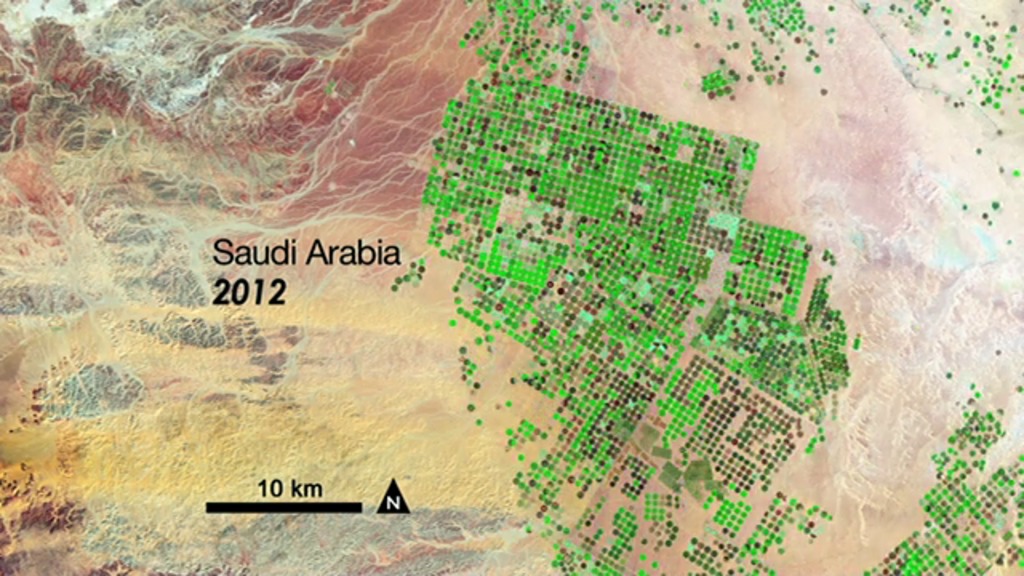
![Landsat satellites have been gathering data for 48 years, equipping scientists and farmers to answer big questions about how to improve agriculture around the world. From tracking crop production, assessing crop health, and monitoring water use, Landsat data provides tangible benefits to the USA and the world. Landsat satellites are built and lauched by NASA, and operated by USGS. Complete transcript available.Music: "Lines of Enquiry" by Theo Golding [PRS], published by Atmosphere Music [PRS]Watch this video on the NASA Goddard YouTube channel.](/vis/a010000/a013500/a013543/LandsatAg-Thumbnail.png) Produced Video
Produced Video - ID: 12026
 Produced Video
 - ID: 12013
 Produced Video
 - ID: 11973
 Produced Video
 - ID: 11818
 Produced Video
 - ID: 10280
- ID: 11202
 Produced Video
 - ID: 11097
 Produced Video
 - ID: 11506
 Produced Video
 - ID: 11004
 Produced Video
 - ID: 10774
 Produced Video
 - ID: 10773
 Produced Video
 - ID: 10484
 Produced Video
 - ID: 10634
 Produced Video
Animations
- ID: 13259 Produced Video
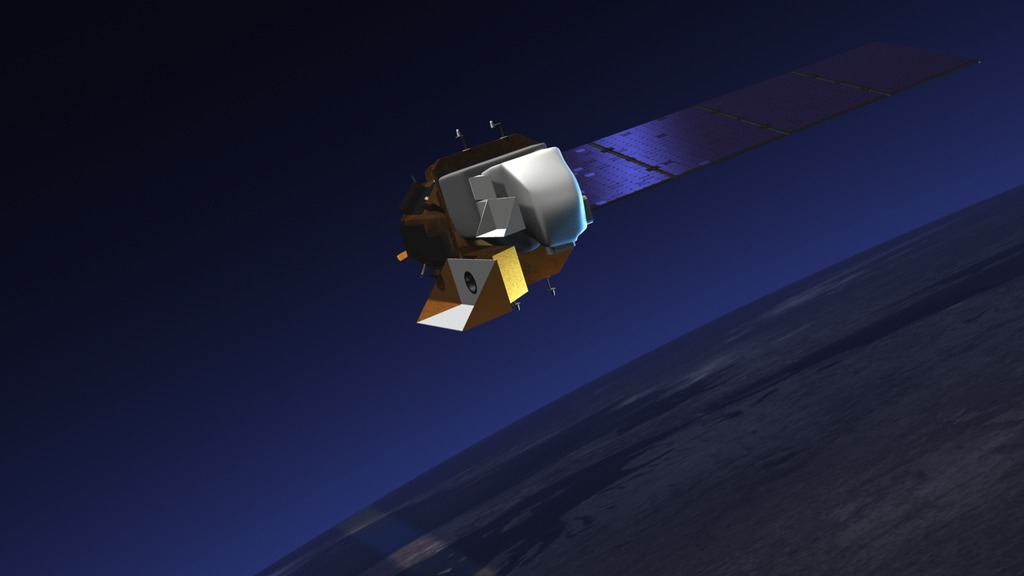
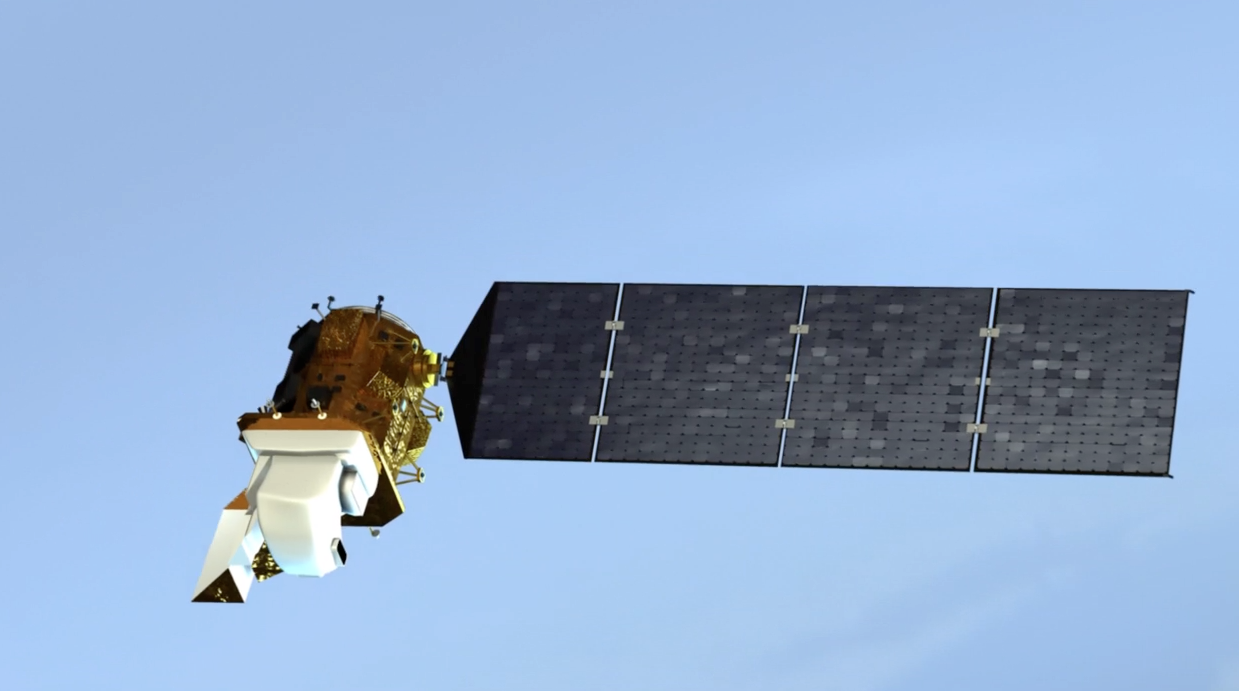
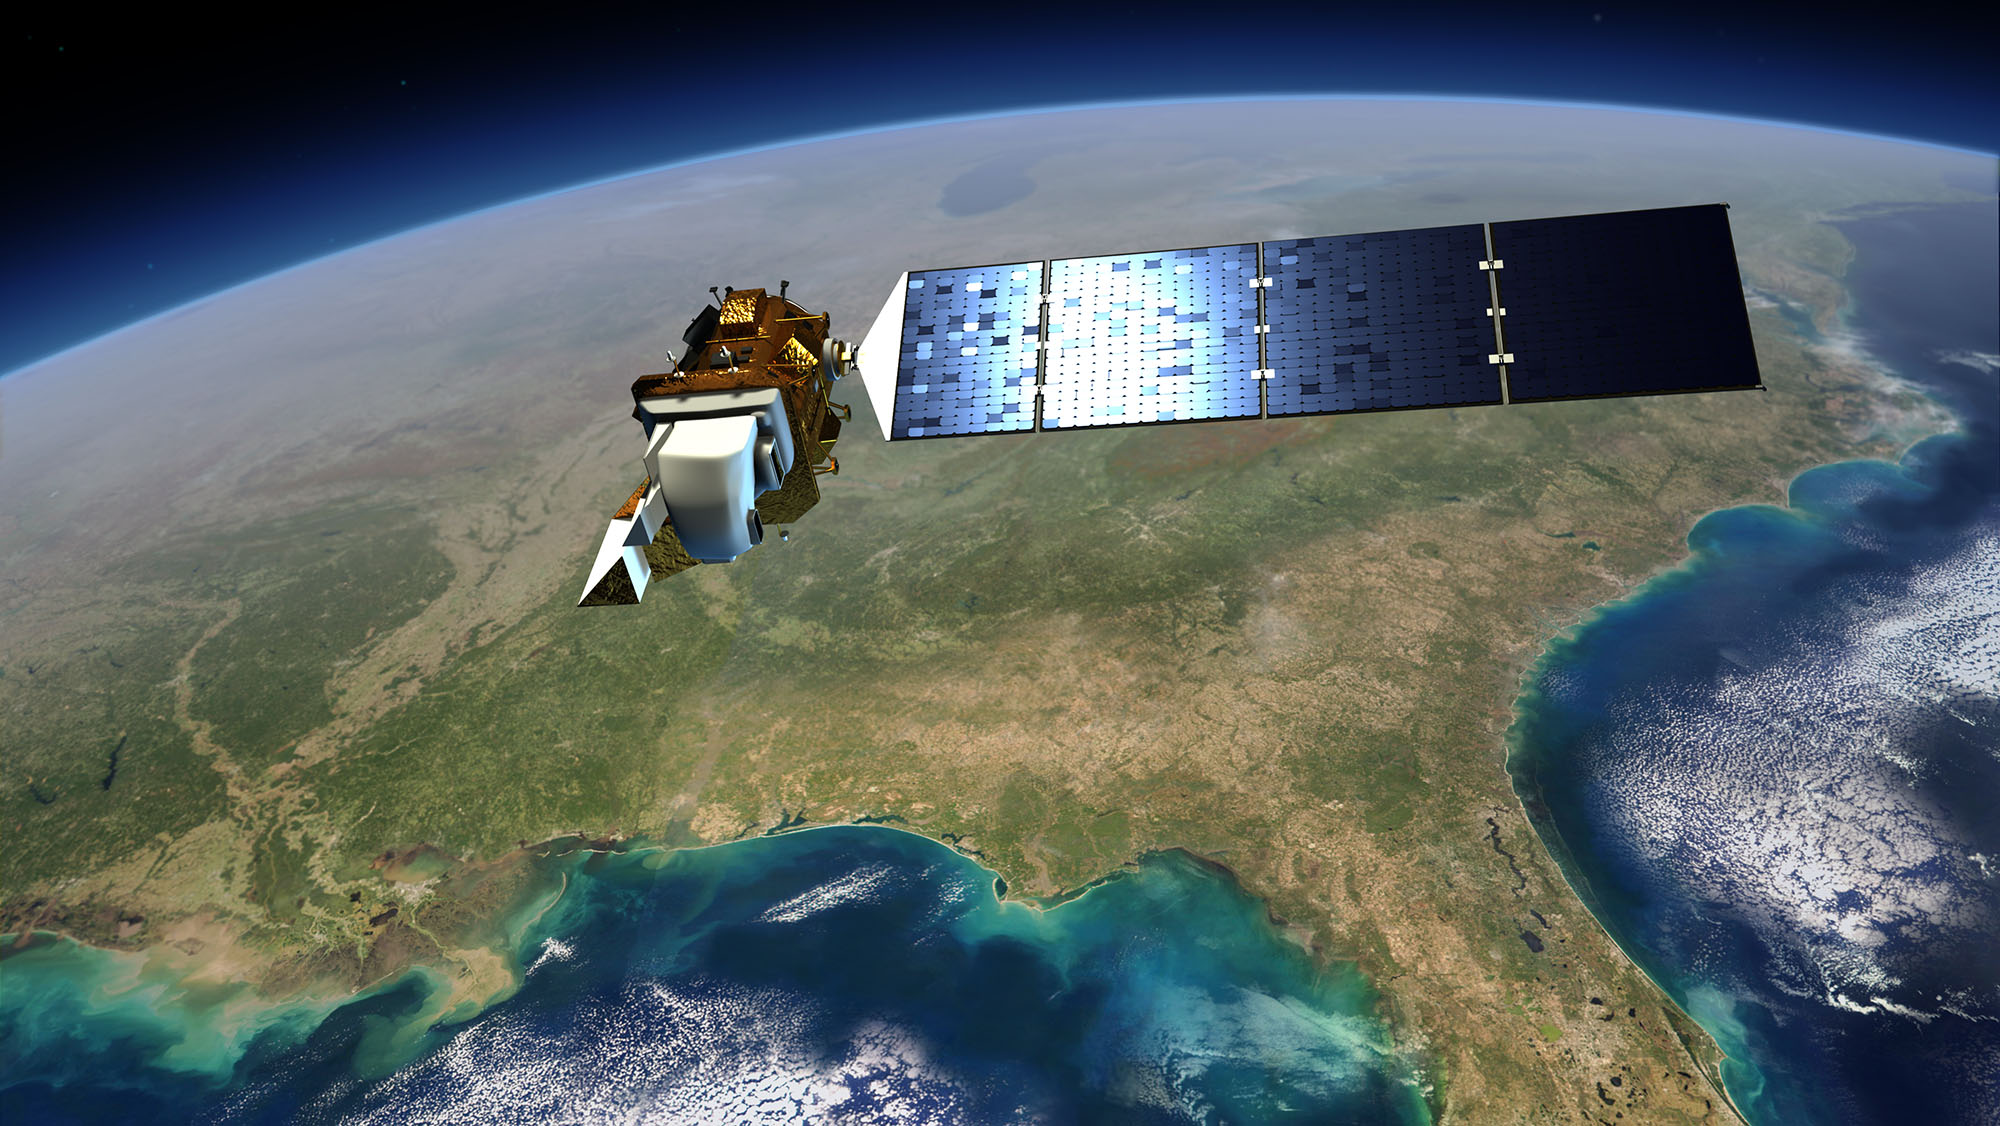
Landsat 9 Spacecraft Animations and Stills
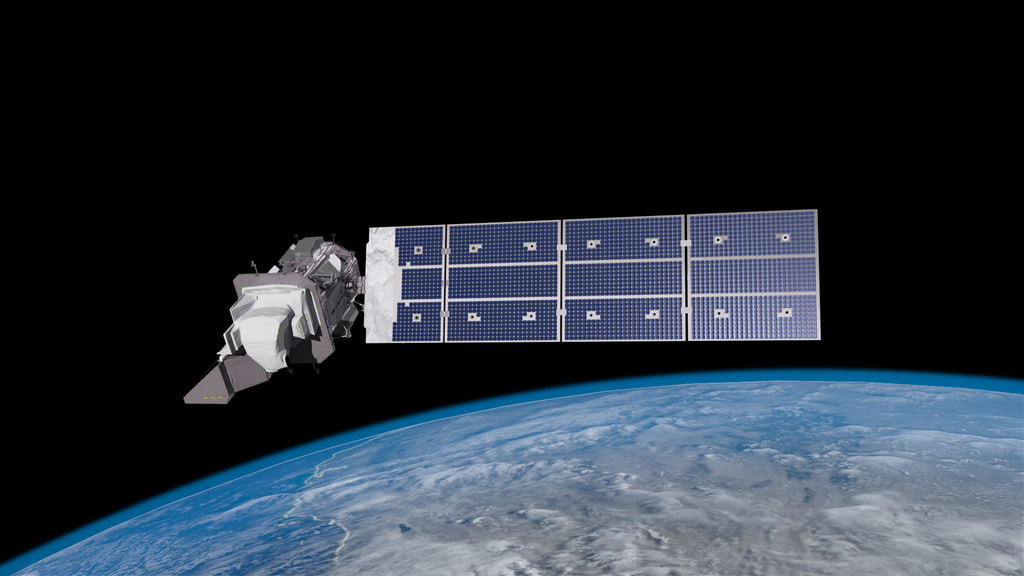
Go to this pageLandsat 9 is a collaboration between NASA and the U.S. Geological Survey, and will continue the Landsat program’s critical role in monitoring, understanding and managing the land resources needed to sustain human life. The mission will provide moderate-resolution (15 meter to 100 meter, depending on spectral frequency) measurements of the Earth's terrestrial and polar regions in visible, near-infrared, short wave infrared, and thermal infrared wavelengths. There are two instruments on the spacecraft, the Thermal InfraRed Sensor 2 (TIRS-2) and the Operational Land Imager 2 (OLI-2).Landsat 9 will provide continuity with the nearly 50-year long Landsat land imaging data set. In addition to widespread routine use for land use planning and monitoring on regional to local scales, support of disaster response and evaluations, and water use monitoring, Landsat measurements directly serve NASA research in the focus areas of climate, carbon cycle, ecosystems, water cycle, biogeochemistry, and Earth surface/interior.The Landsat program is the only U.S. satellite system designed and operated to repeatedly observe the global land surface at a moderate scale that shows both natural and human-induced change. ||
- ID: 20322 Animation
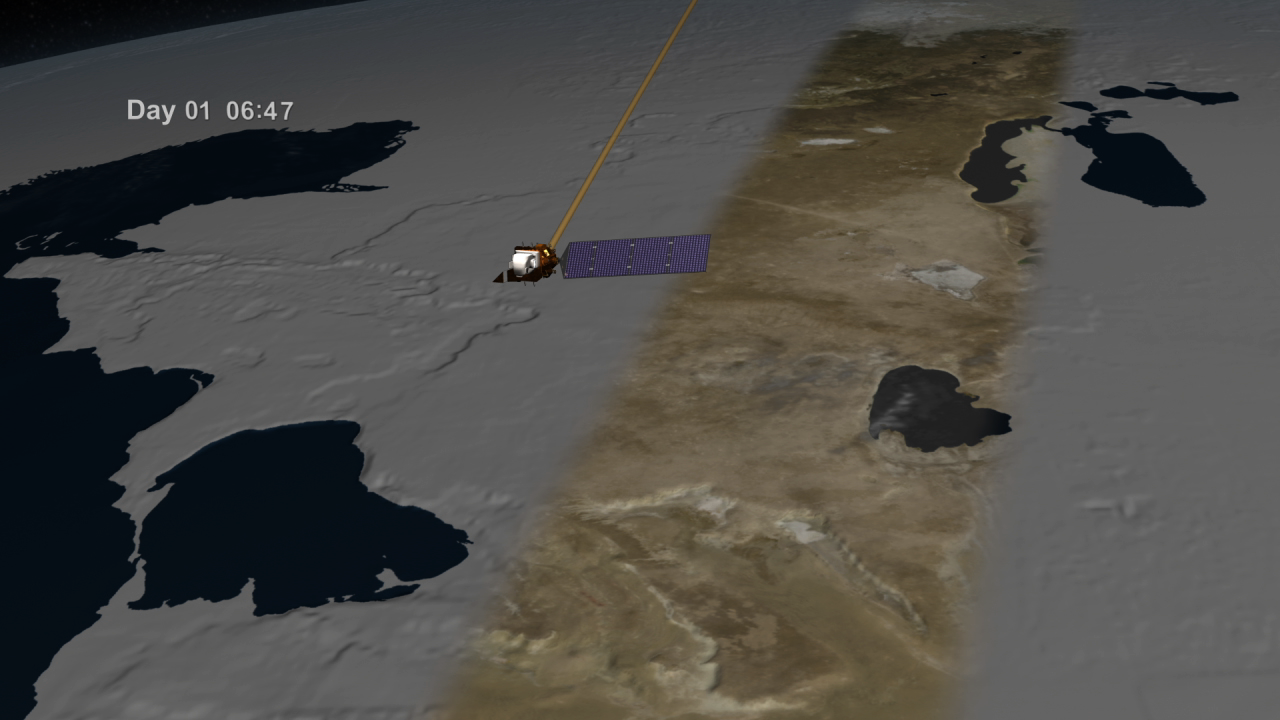
Landsat Lightpath Animations
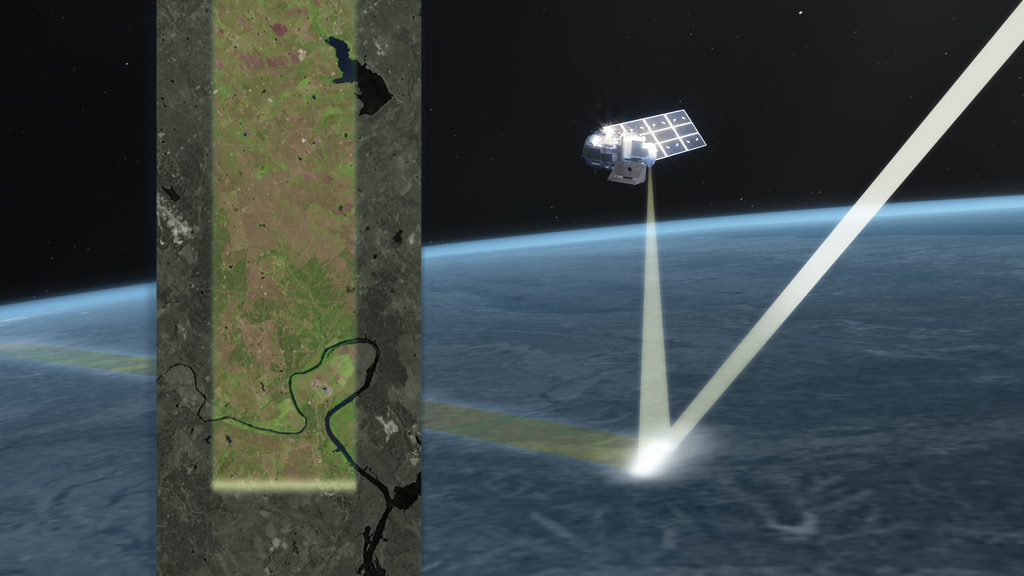
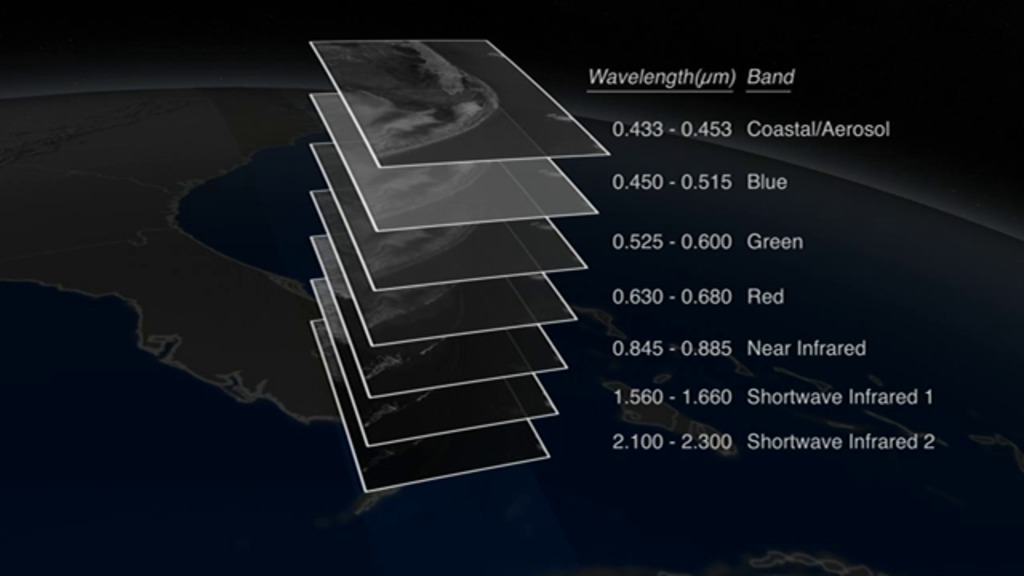
Go to this pageFor nearly half a century, the Landsat mission has shaped our understanding of Earth. Since the launch of the first Landsat satellite in 1972, the mission has gathered and archived more than 8 million images of our home planet’s terrain, including crop fields and sprawling cities, forests and shrinking glaciers. These data-rich images are free and publicly available, leading to scientific discoveries and informed resource management.Landsat 9 will carry two instruments that largely replicate the instruments on Landsat 8: the Operational Land Imager 2 (OLI-2) and the Thermal Infrared Sensor 2 (TIRS-2). OLI-2 and TIRS-2 are optical sensors that detect 11 wavelengths of visible, near infrared, shortwave infrared, and thermal infrared light as it is reflected or emitted from the planet’s surface. Data from these instruments are processed and stored at the USGS Earth Resources Observation and Science (EROS) Center in Sioux Falls, South Dakota—where decades worth of data from all of the Landsat satellites are stored and made available for free to the public.The Landsat mission, a partnership between NASA and the U.S. Geological Survey (USGS), has provided the longest continuous record of Earth’s land surfaces from space. The consistency of Landsat’s land-cover data from sensor to sensor and year to year makes it possible to trace land-cover changes from 1972 to the present, and it will continue into the future with Landsat 9. With better technology than ever before, Landsat 9 will enhance and extend the data record to the 50-year mark and beyond. ||
- ID: 20340 Animation
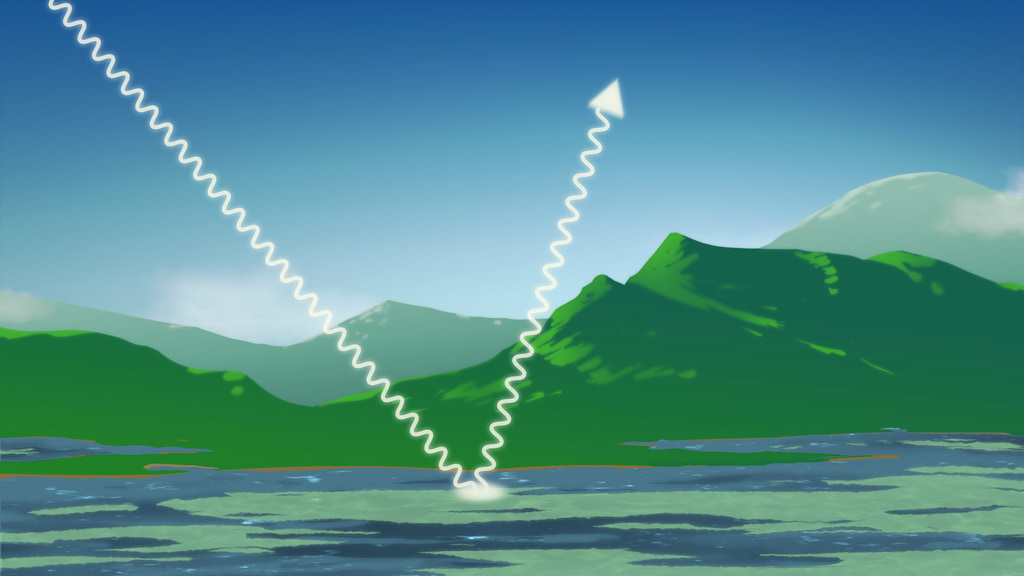
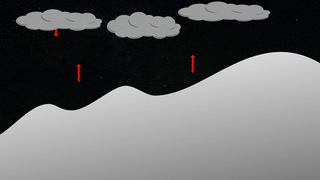
Landsat 9 Atmospheric Correction
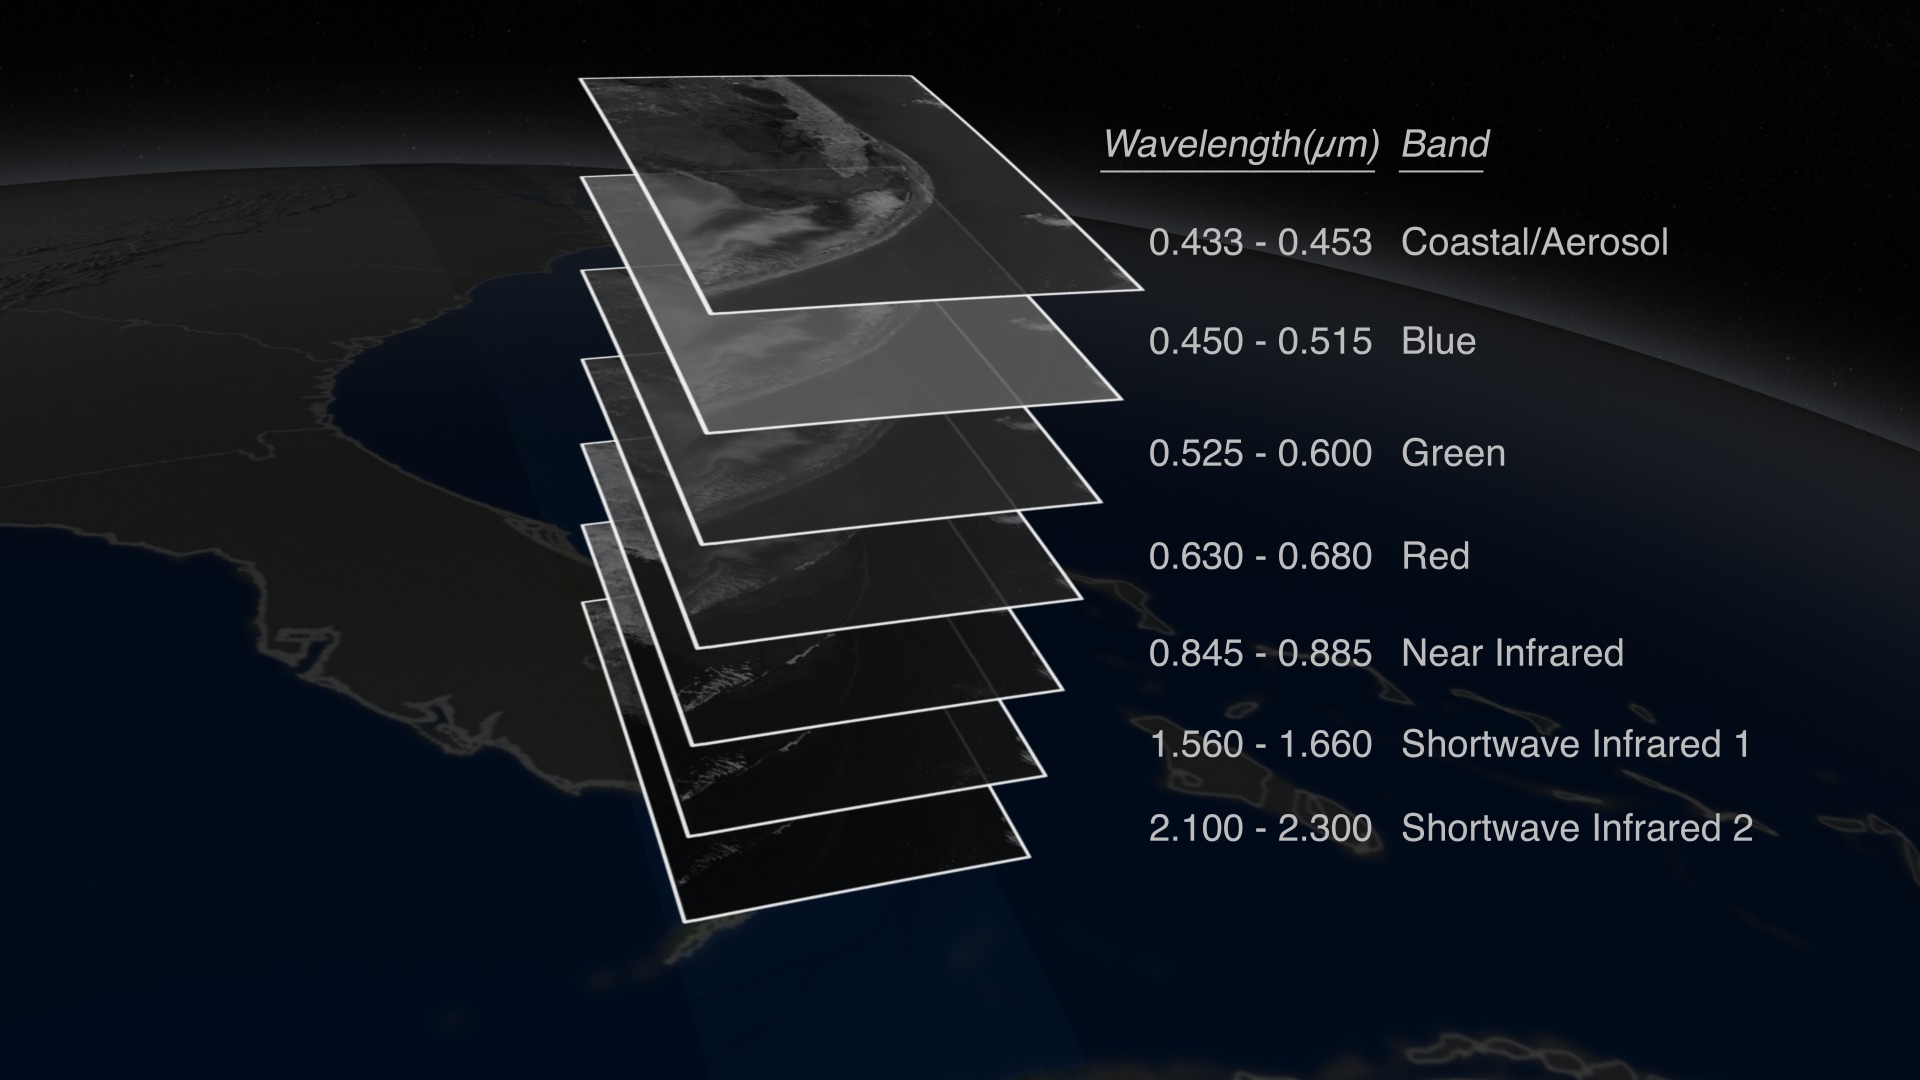
Go to this pageLandsat collects light in visible and infrared wavelengths. Sunlight reflects off Earth’s surface, and scientists identify the land cover based on which wavelengths are reflected strongly or weakly.But sunlight is also reflected by particles in the atmosphere, which distorts the data and can lead to what looks like a haze in the imagery. Using basic principles of physics, and knowing the meteorological conditions, scientists can determine the effects of the scattering and absorption as light passes through the atmosphere. This atmospheric correction is essential to determining exactly how much of each wavelength reflected of the features of the surface, and having quantifiable data.The videos below show different examples of atmospheric scattering which need to be accounted for when doing atmospheric correction of satellite data. In these cases, it is for observations over water. The resulting atmospheric corrections are part of the process for the new Landsat Aquatic Reflectance data product. Landsat’s highly calibrated data products, free to download and use, are making detailed Earth-observation data more accessible to users and bringing a greater benefit to society. ||
- ID: 10926 Produced Video
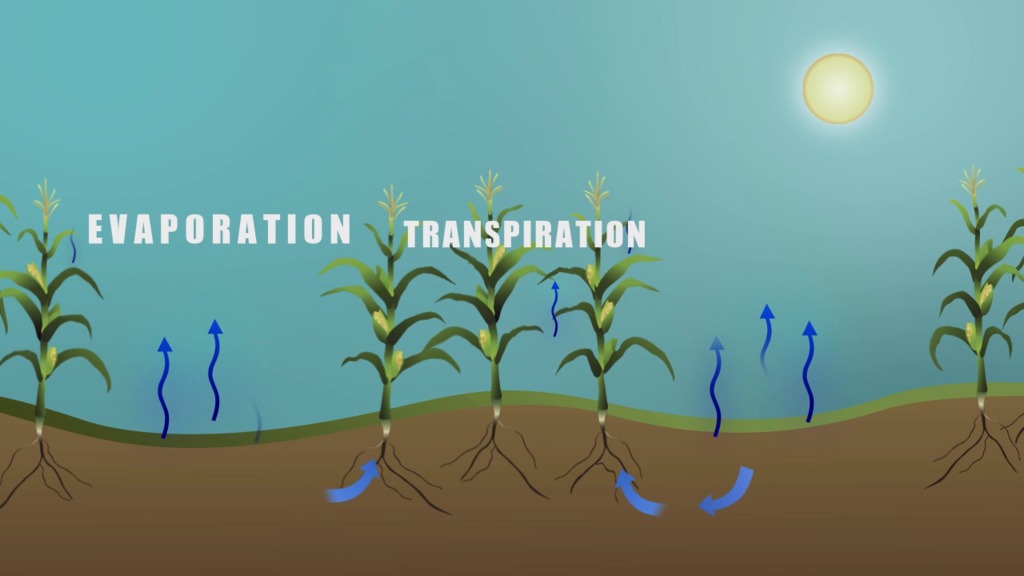
Evaporation and Transpiration
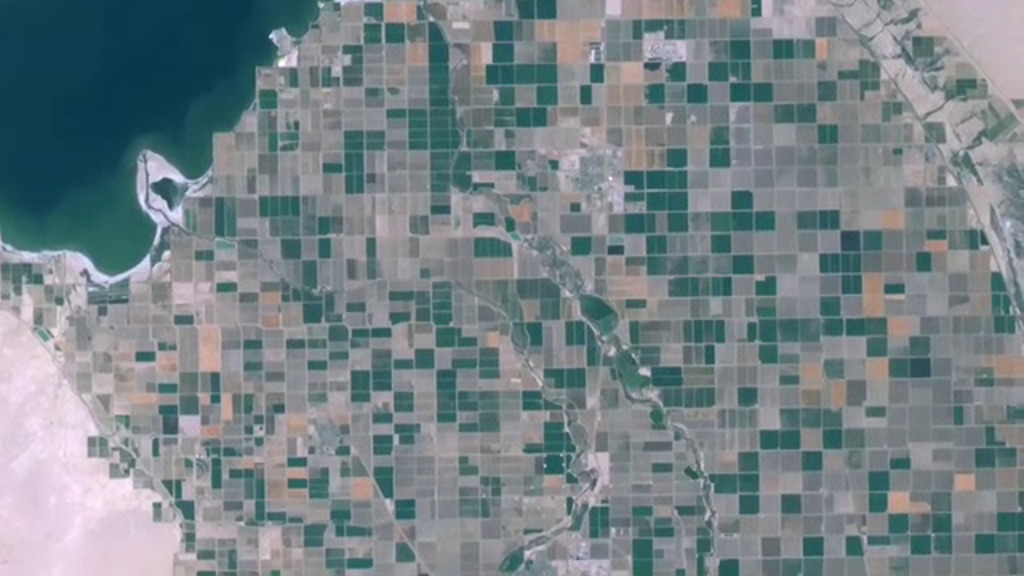
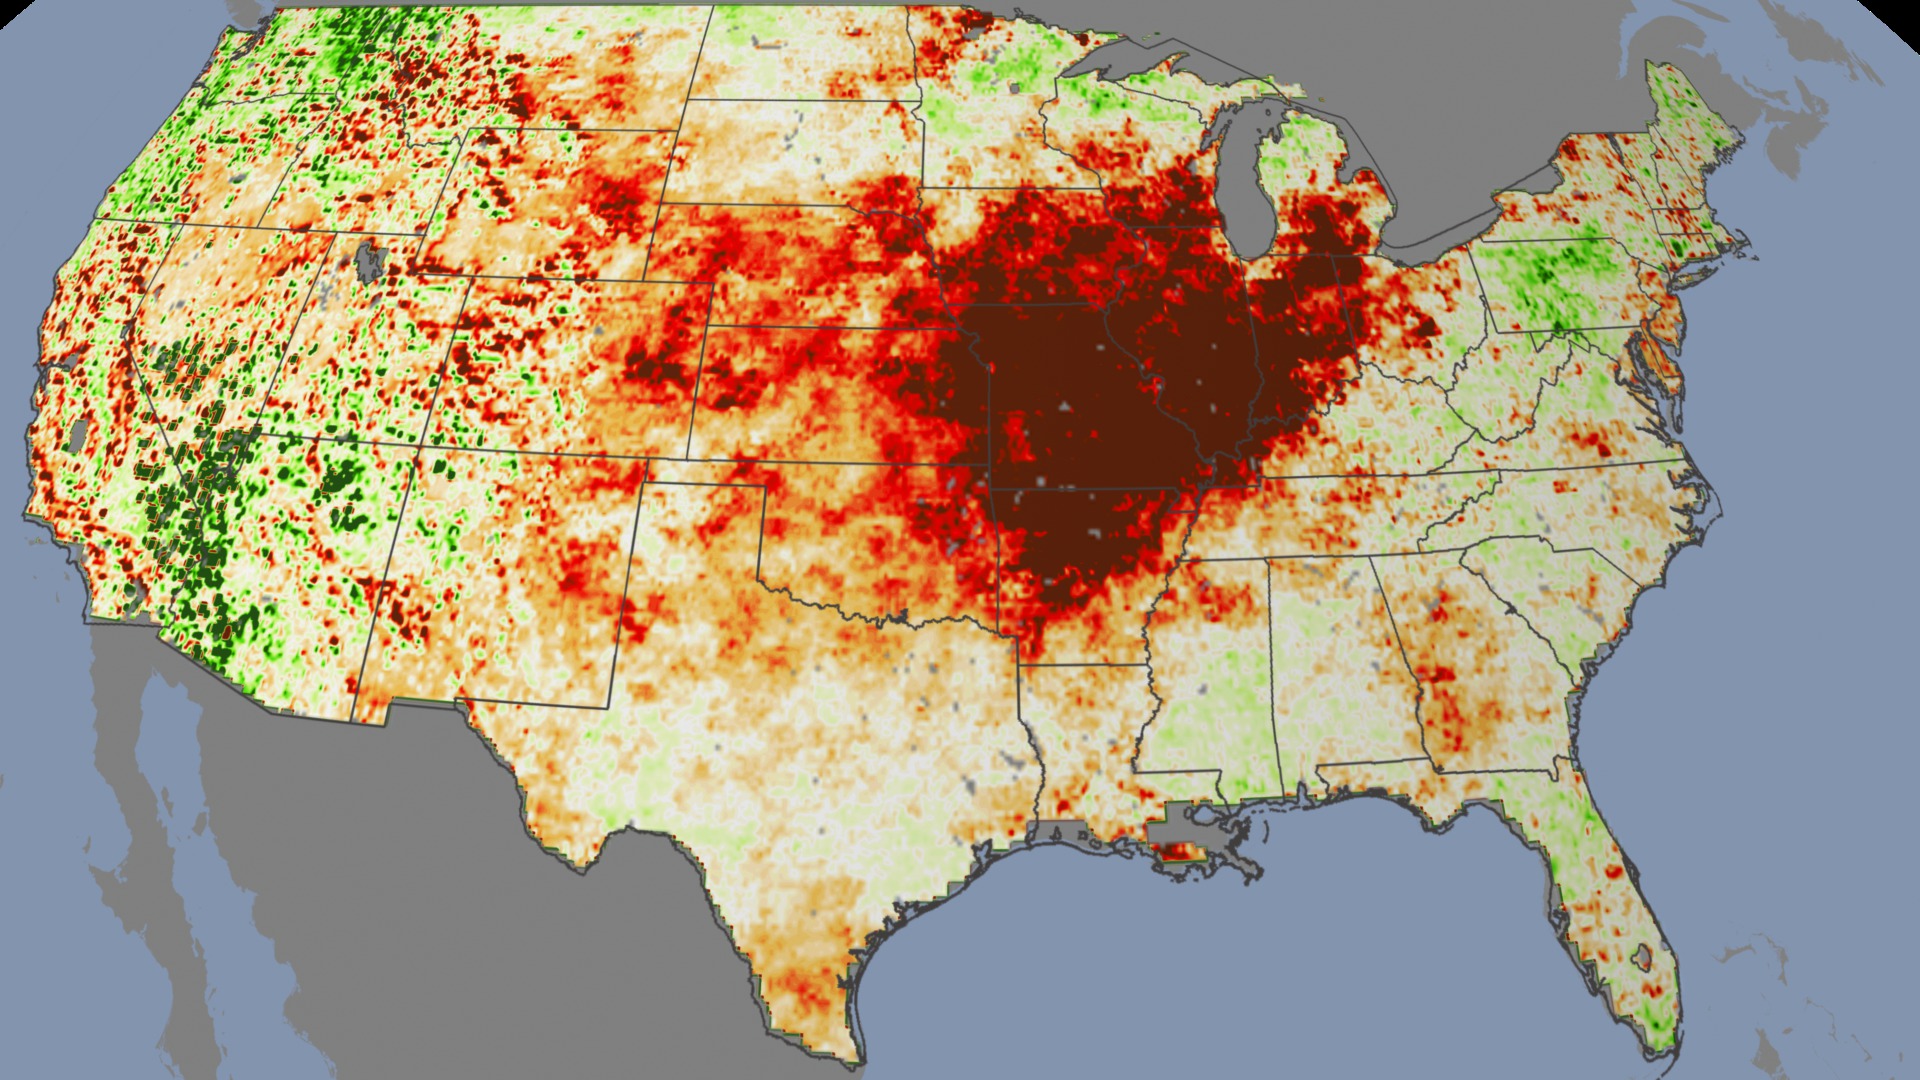
Go to this pageMuch of the water that soaks into the soil from irrigation or rain ultimately returns the the atmosphere as water vapor through direct evaporation from the surface or by transpiration through plant leaves as the plants use the water for growth and seed production. This loss cools the surface and plant canopy just like the evaporation of sweat cools our skin. A cool field in an arid area indicates water use by irrigation. Using the surface temperatures measured by satellites, and some additional information, water resource managers can determine the rate at which water is used in a farm field. ||
- ID: 3632 Visualization

Evapotranspiration from Landsat
Go to this pageInstruments on the Landsat satellites capture images in the visible spectrum, but they also take images in wavelengths invisible to the naked eye. Landsat's thermal imager captures land surface temperature data. As farmers irrigate fields, water evaporates from the soil and transpires from plants' leaves. The combined process is called evapotranspiration. Evapotranspiring water absorbs energy, so farm fields consuming more water appear cooler in the thermal band. Landsat-based evapotranspiration measurements provide an objective way for water managers to assess on a field-by-field basis how much water agricultural growers are using. The measurements have even been used to help settle water rights conflicts in court. ||
- ID: 11005 Produced Video
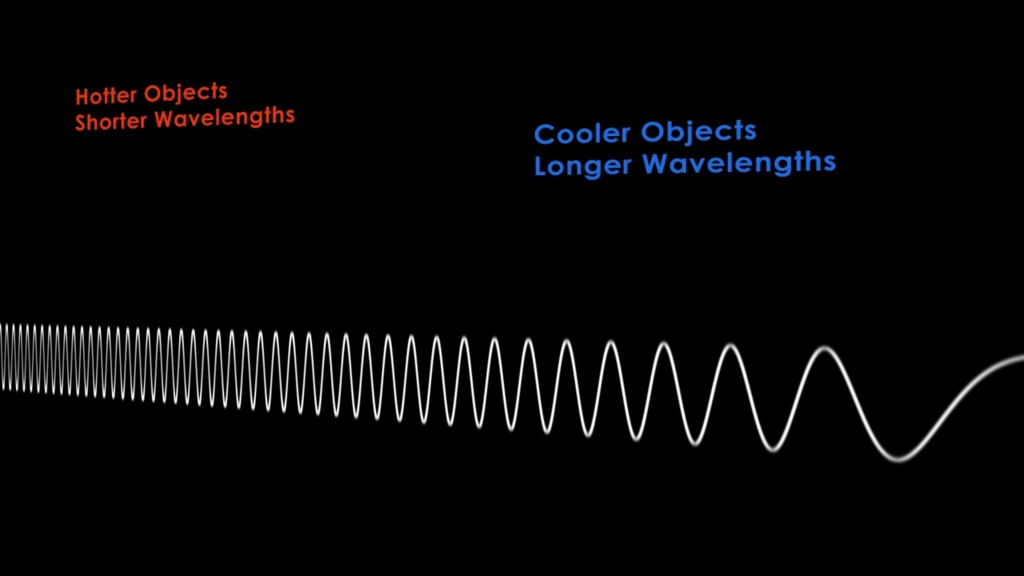
Thermal Radiation and the Electromagnetic Spectrum
Go to this pageA short animation illustrating the relationship of temperature and wavelength. Hotter objects have a shorter wavelength and cooler objects have a longer wavelength. The animation also compares the wavelengths of visible light and thermal infrared radiation. ||
- Section
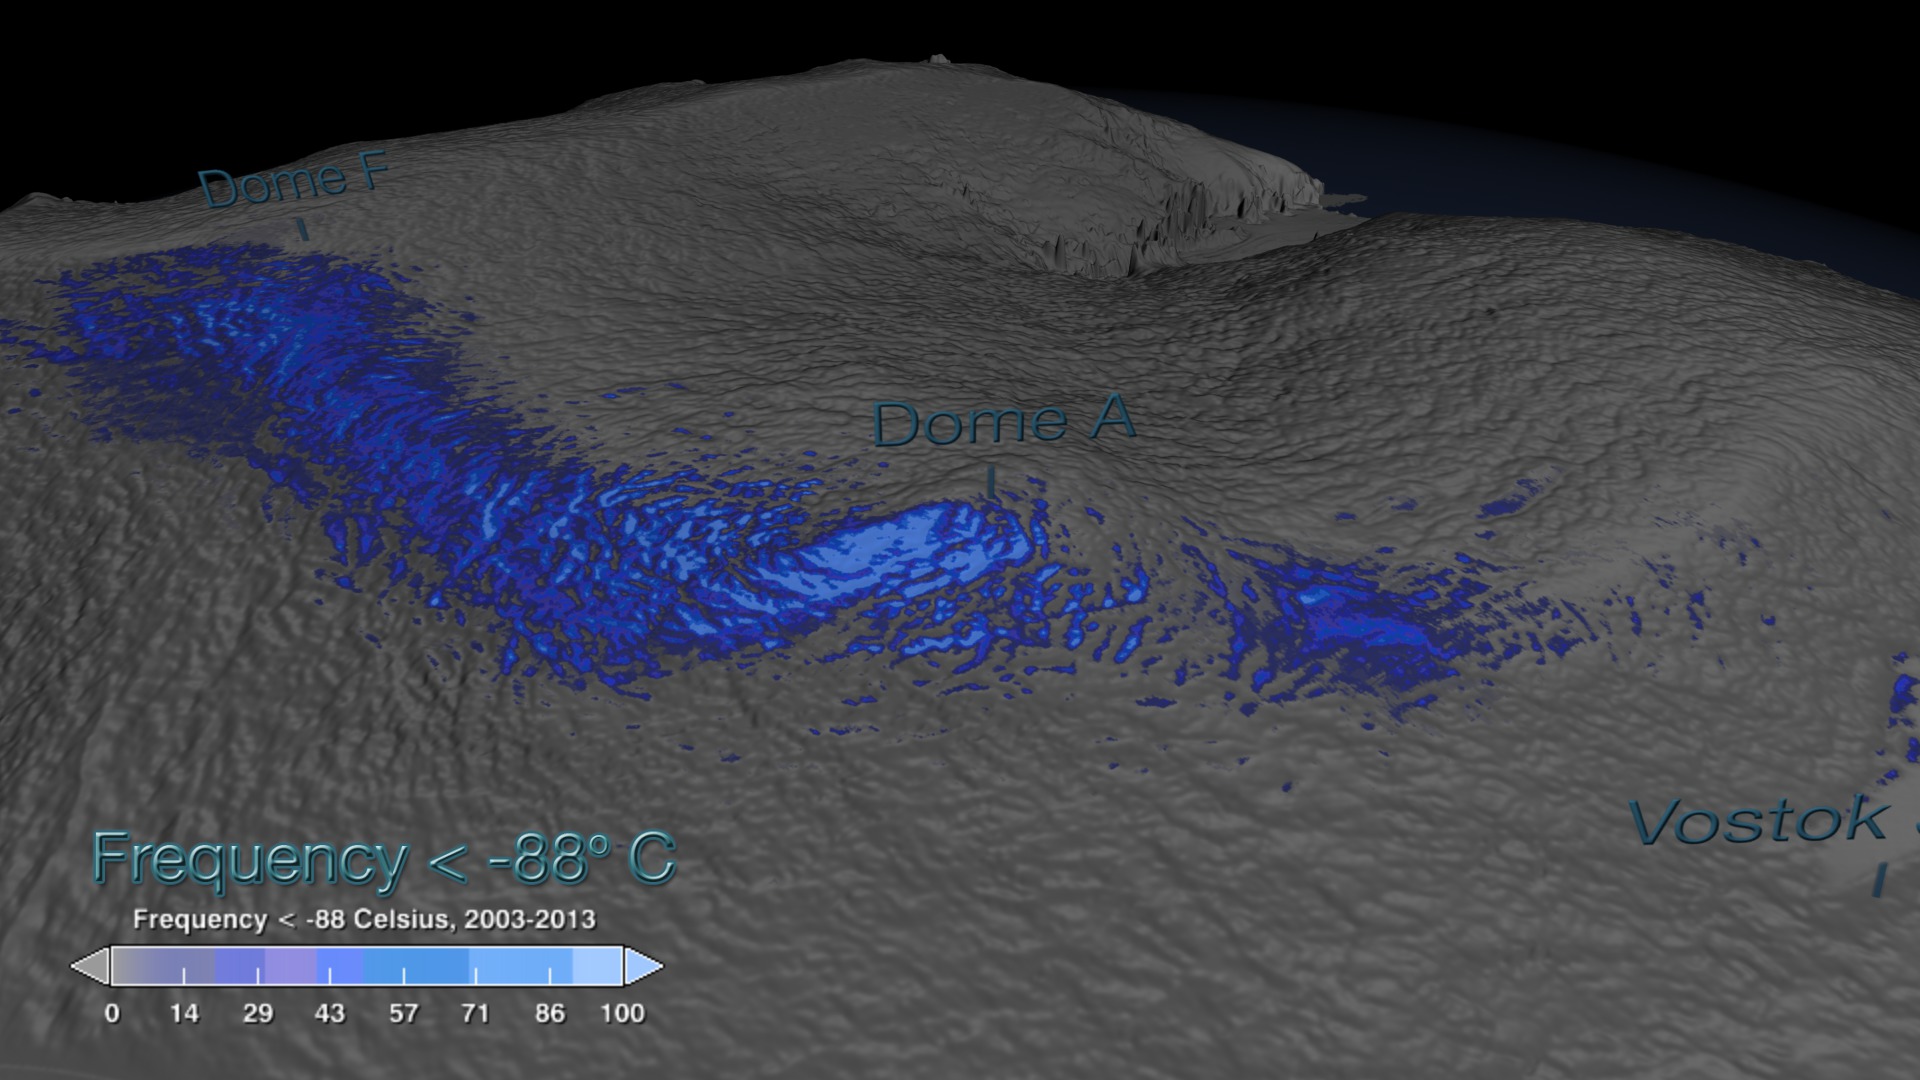
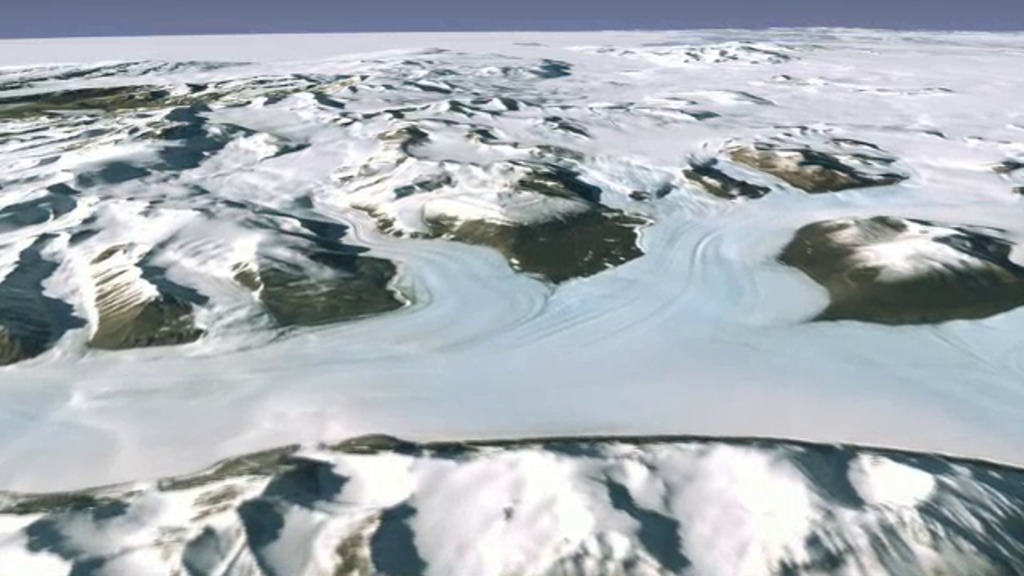
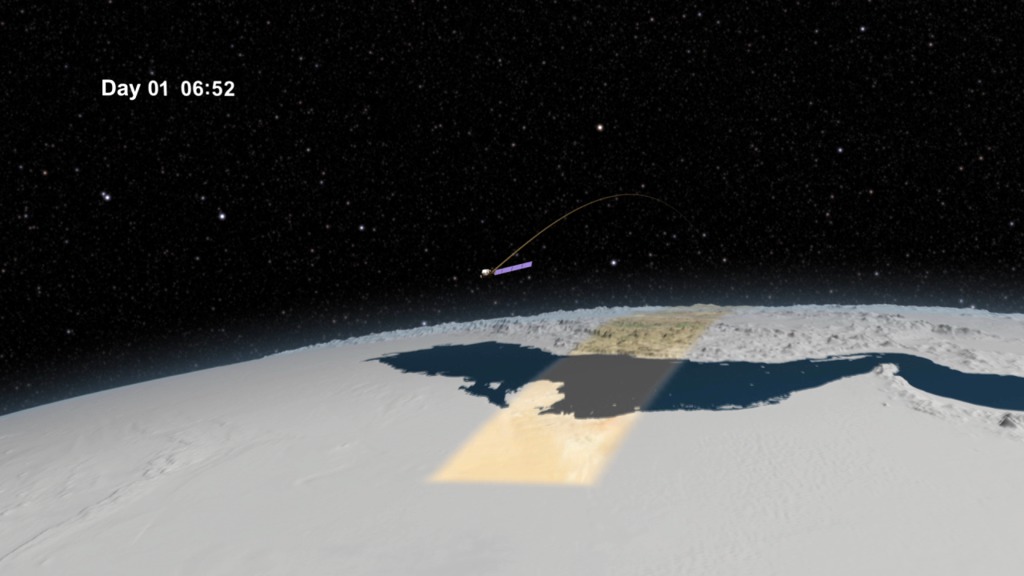
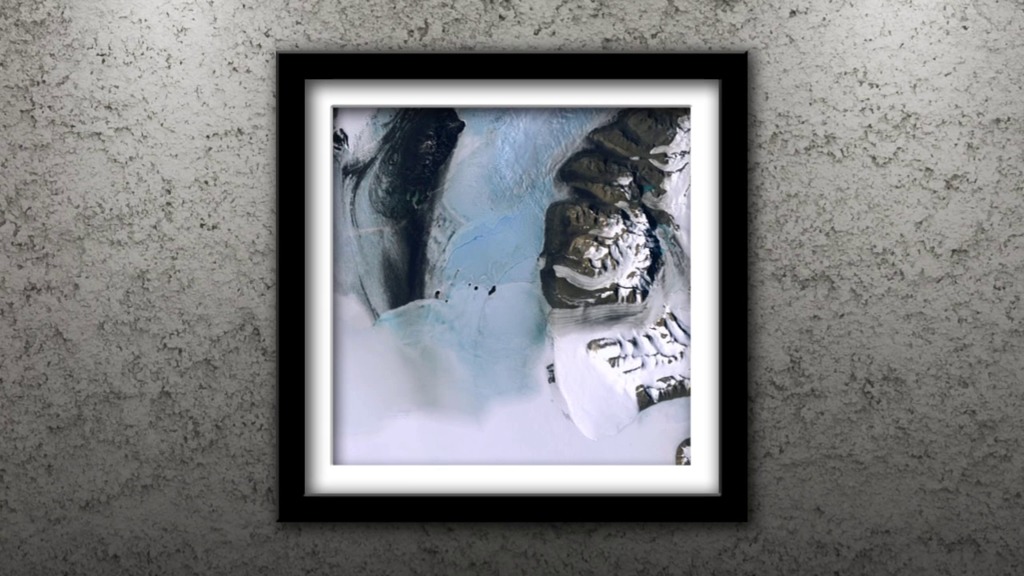
Briefing Materials: Taking Landsat to the Extreme
Go to this sectionWhat is the coldest place in the world? It is a high ridge in Antarctica on the East Antarctic Plateau where temperatures in several hollows can dip below minus 133.6° Fahrenheit (minus 92° Celsius) on a clear winter night – colder than the previous recorded low temperature. Narrated animation showing the process by which the coldest place on earth develops its extreme low temperatures.
- ID: 10812 Produced Video
Landsat 8 (aka LDCM) Spacecraft Animations and Still Images
Go to this pageLandsat 8 (formerly known as LDCM, the Landsat Data Continuity Mission), a collaboration between NASA and the U.S. Geological Survey, will provide moderate-resolution (15 meter - 100 meter, depending on spectral frequency) measurements of the Earth's terrestrial and polar regions in the visible, near-infrared, short wave infrared, and thermal infrared. There are two instruments on the spacecraft, the Thermal InfraRed Sensor (TIRS) and the Operational Land Imager (OLI). Landsat 8 continues the nearly 50-year long Landsat land imaging data set. In addition to widespread routine use for land use planning and monitoring on regional to local scales, support of disaster response and evaluations, and water use monitoring, Landsat 8 measurements directly serve NASA research in the focus areas of climate, carbon cycle, ecosystems, water cycle, biogeochemistry, and Earth surface/interior. ||
- ID: 10519 Produced Video
Landsat 7 Spacecraft Animations
Go to this pageThe seventh satellite in the long-running Landsat program was launched on April 15, 1999 and is the most accurately calibrated Earth-observing satellite, i.e., its measurements are extremely accurate when compared to the same measurements made on the ground. Landsat 7's sensor has been called "the most stable, best characterized Earth observation instrument ever placed in orbit." Landsat 7's rigorous calibration standards have made it the validation choice for many coarse-resolution sensors.Created for the 10th anniversary of the launch of Landsat 7. ||
Data Visualizations
- ID: 4834
- ID: 4745Visualization
- ID: 3939
 Visualization
 - ID: 4040
 Visualization
 - ID: 40420
 Gallery
 - ID: 4399
- ID: 4381
 Visualization
 - ID: 11779
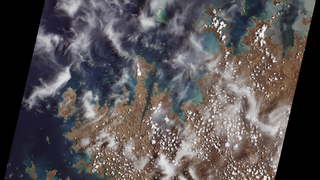
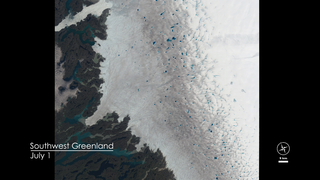
![The Operational Land Imager (OLI) on Landsat 8 acquired this unbroken swath of images on June 21, 2014—the summer solstice—when the Sun stays above the horizon of the Arctic for at least 24 hours. While much of the region is still frozen in June, the ice is in various stages of melting.For complete transcript, click here.Watch this video on the NASA Earth Observatory YouTube channel.Music: Thin Ice Mining by Chris Constantinou [PRS], Paul Frazer [PRS] Melting Glacier by Chris Constantinou [PRS], Paul Frazer [PRS] Undiscovered Oceans by Aaron Yeddidia [BMI], Chris Lang [BMI], Eric Cunningham [BMI] Another Sleep by Chris Constantinou [PRS], Paul Frazer [PRS]](/vis/a010000/a011700/a011779/G2015-015_Arctic_Swath_MASTER_youtube_hq_print.jpg) Produced Video
Produced Video - ID: 4271
 Visualization
 - ID: 11249
 Produced Video
 - ID: 4076
 Visualization
 - ID: 4013
- ID: 4012
- ID: 4209
- ID: 4452
- ID: 4528
 Visualization
 - ID: 4126
 Visualization
 - ID: 4015
 Visualization
 - ID: 4032
 Visualization
 - ID: 3791
 Visualization
 - ID: 3953
- ID: 3964
- ID: 3967
 Visualization
 - ID: 3433
 Visualization
 - ID: 3806

- ID: 10416
 Produced Video
Still Graphics
- ID: 11433 Produced Video
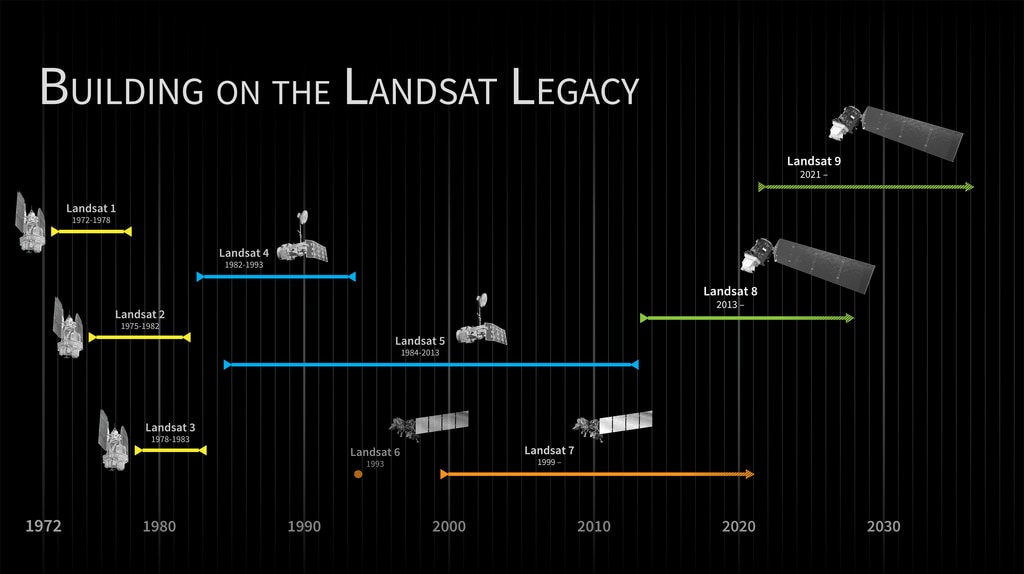
Landsat Program Timeline
Go to this pageThe Landsat program offers the longest continuous global record of the Earth’s surface; it continues to deliver visually stunning and scientifically valuable images of our planet. This short video highlights Landsat’s many benefits to society.In 1975, NASA Administrator Dr. James Fletcher predicted that if one space age development would save the world, it would be Landsat and its successor satellites. Since the early 1970s, Landsat has continuously and consistently archived images of Earth; this unparalleled data archive gives scientist the ability to assess changes in Earth’s landscape.For over 40 years, the Landsat program has collected spectral information from Earth’s surface, creating a historical archive unmatched in quality, detail, coverage, and length.“It was the granddaddy of them all, as far as starting the trend of repetitive, calibrated observations of the Earth at a spatial resolution where one can detect man’s interaction with the environment,” Dr. Darrel Williams, the Landsat 7 Project Scientist, states about Landsat.Landsat sensors have a moderate spatial-resolution. You cannot see individual houses on a Landsat image, but you can see large man-made objects such as highways. This is an important spatial resolution because it is coarse enough for global coverage, yet detailed enough to characterize human-scale processes such as urban growth, deforestation, agriculture water use, and more. ||
 Link
LinkVisible Earth
Find all Landsat images published by the award-winning NASA Earth Observatory here. Beautifully annotated (and unannotated) images collected throughout Landsat’s long history are featured along with detailed descriptions and scientific explanations. All of the images are in the public domain and may be used with attribution.
Go to this link Link
LinkNASA Image & Video Library
All content tagged for Landsat 9 in the NASA Image and Video Library, which allows users to search, discover and download a treasure trove of more than 140,000 NASA images, videos and audio files from across the agency’s many missions in aeronautics, astrophysics, Earth science, human spaceflight, and more.
Go to this link Link
LinkEarth As Art
Satellites capture an incredible variety of views of Earth. In addition to their scientific value, many satellite images are simply lovely to look at. In these collections from the U.S. Geological Survey, see the mesmerizing beauty of river deltas, mountains, and other sandy, salty, and icy landscapes. Some might even remind you of actual famous works of art!
Go to this link Link
LinkWorld of Change
See for yourself how our planet is changing at the World of Change gallery featured on NASA’s Earth Observatory. Via time series satellite images, you can witness the unfolding transformation of Earth’s surface. Many different satellite data sets are featured on this site. As you’ve probably guessed, you can find Landsat—with its nearly five-decade archive—in heavy rotation here.
Go to this link- ID: 11458 Produced Video
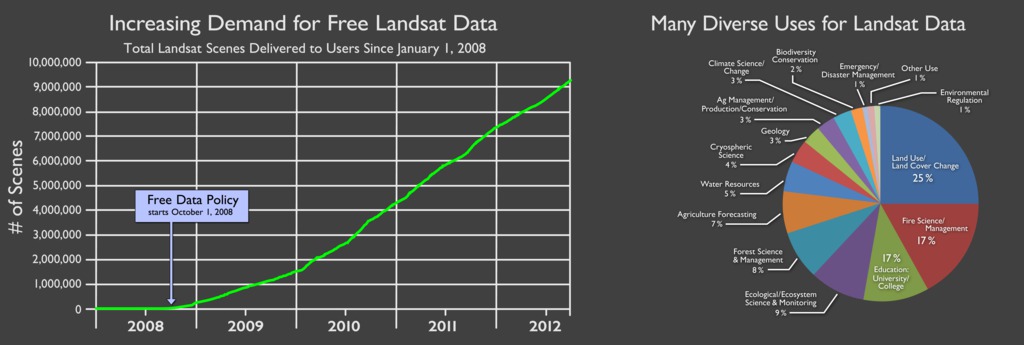
Landsat Downloads and Use Data
Go to this pageGraph showing the total number of Landsat scenes downloaded since October 1, 2008, when the USGS instituted their policy to distribute Landsat data for free. In the five years since, over 11 million scenes have been downloaded from the Landsat archive. ||
- ID: 11315 Produced Video
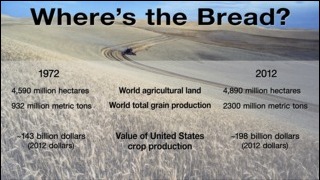
Landsat and Agriculture
Go to this pageThe Landsat program has been running since 1972, having successfully launched 7 satellites into orbit. (Landsat 6, owned by a private company, failed at launch and never reached orbit.) Since 1972, Landsat satellites have been regularly collecting data about the Earth's land surface to help monitor our natural resources and study how land cover and land use are changing. || Landsat_timeline_5x3wall.png (6830x2304) [1.2 MB] || Landsat_timeline_5x3wall_web.jpg (317x107) [9.1 KB] || Landsat_timeline_5x3wall.png.hwshow [177 bytes] ||
- ID: 10873 Produced Video
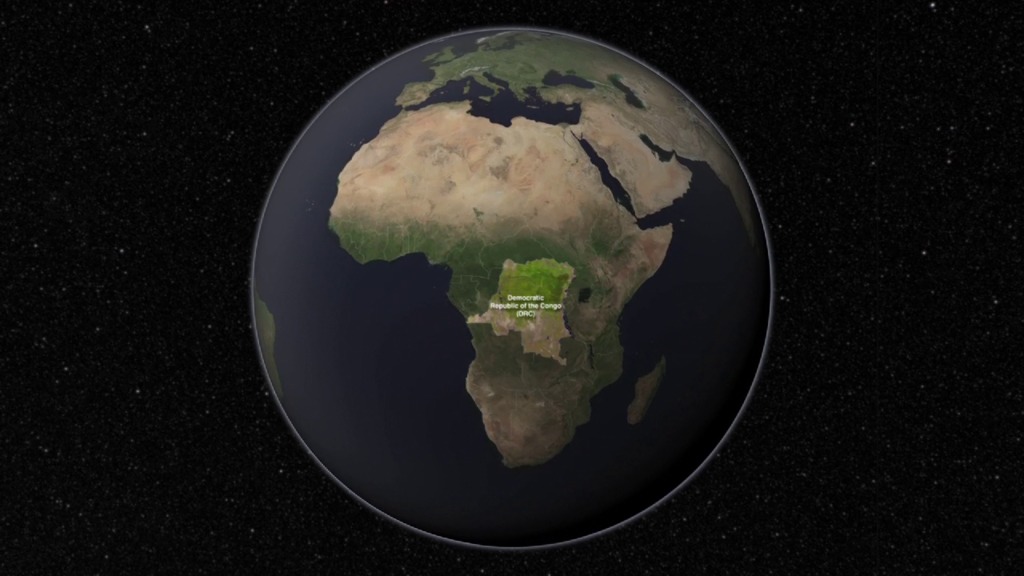
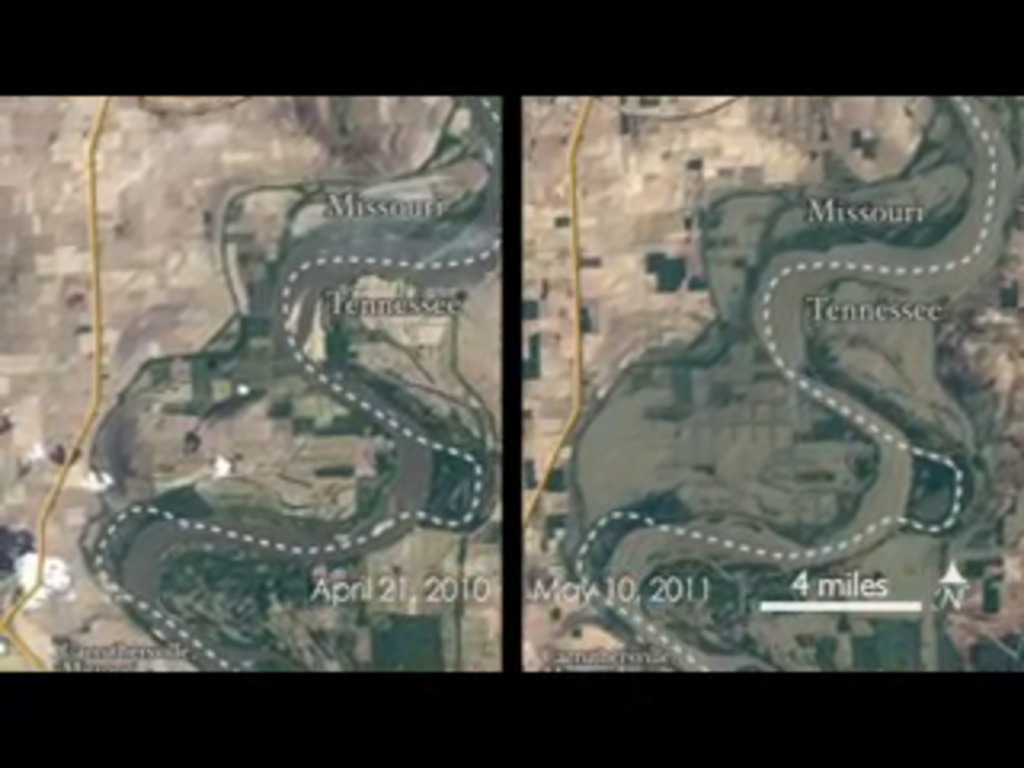
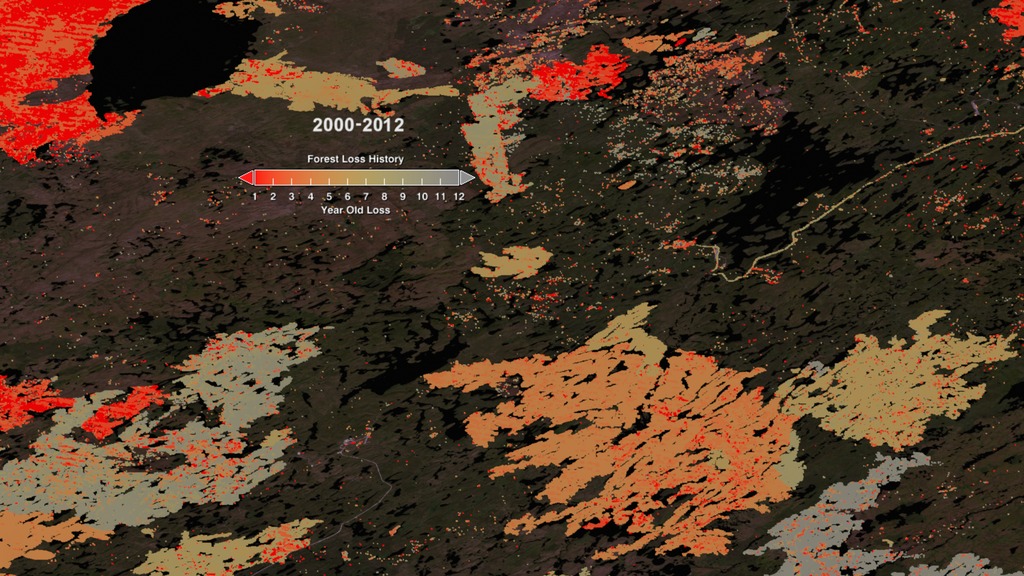
Global Rate of Deforestation 2011
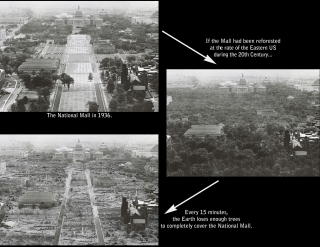
Go to this pageEarth's forests are of incalculable value; they are a vital component of the climate system - controlling gas, energy and water exchange between the surface and atmosphere; the tropical forests alone contain half of all biological species - diversity that underpins human and environmental wellbeing; they are a major source of revenue - timber, non-timber forest products and mineral reserves and they are the primary source of energy for over 2 billion people. Forests have never been under more pressure. Demand for their natural wealth and a hunger for land causes forest clearance at alarming rates. The UN Food and Agriculture Organization (FAO) estimates that the Earth loses an area about the size of a football field every 3 seconds - in the time it takes to make a sandwich an area equivalent to the National Mall in Washington, D.C., is cleared... somewhere on Earth trees are falling every second of every day. Based on a systematic sample of Landsat imagery at 4,016 locations around the tropical belt the European Commission's TREES 3 project is making estimates of forest cover change for the years 1990, 2000, 2005 and 2010 with new levels of precision. Preliminary results emphasize just how relentless the pressure on our planet is. Using archived and recent Landsat imagery we have measured dramatic changes to the African Continent for example. Since the 1970s natural vegetation (forests and savannas) have been converted to agricultural land at a tremendous pace. Around 50,000 sq. km per year are cleared - an area twice the size of Vermont. With the fastest growing population in the world such land cover conversions are unlikely to slow down any time soon, nor should the measuring programs. Landsat 8 and its European counterpart, Sentinel 2, are not being launched any sooner than they are needed. ||
 Link
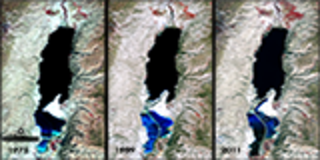
LinkNASA Sees New Salt in an Ancient Sea
The expansion of massive salt evaporation projects on the Dead Sea are clearly visible in this time series of images taken by Landsat satellites operated by NASA and the U.S. Geological Survey. This false-color image was captured by the Landsat 1, 4 & 7 satellites.
Go to this link
Change Over Time
- ID: 13694
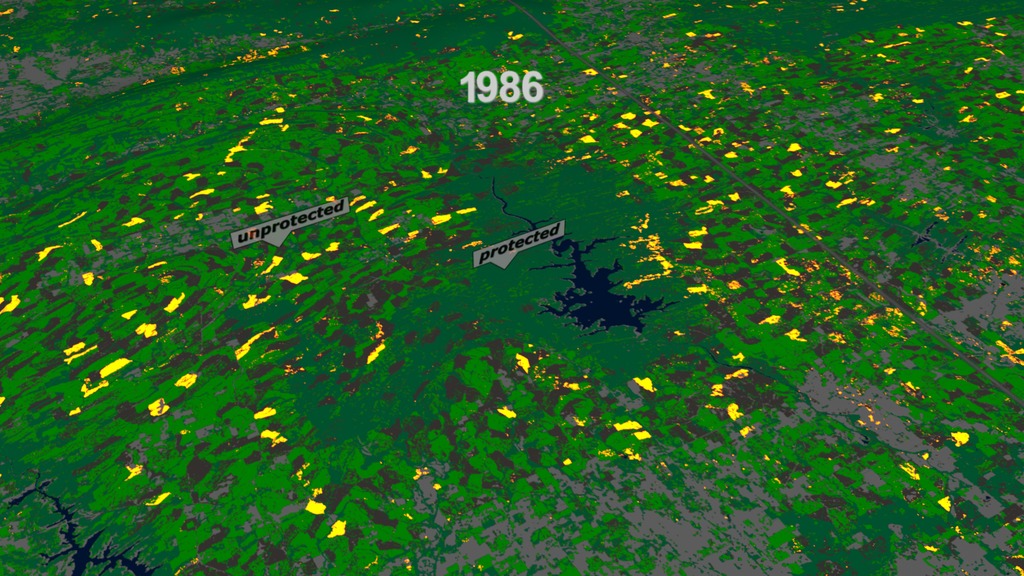
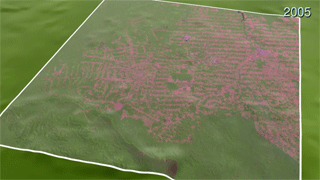
![The Amazon is the largest tropical rainforest in the world, nearly as big as the continental United States. But every year, less of that forest is still standing. Today's deforestation across the Amazon frontier is tractors and bulldozers clearing large swaths to make room for industrial-scale cattle ranching and crops. Landsat satellite data is used to map land cover in Brazil with a historical perspective, going back to 1984.Music: Organic Circuit by Richard Birkin [PRS]; Into the Atmosphere by Sam Joseph Delves [PRS]; Ethereal Journey by Noé Bailleux [SACEM]; Wildfires by Magnum Opus [ASCAP]; Letter For Tomorrow by Anthony d’Amario [SACEM].Complete transcript available.Watch this video on the NASA Goddard YouTube channel.](/vis/a010000/a013600/a013694/Amazon_clearing_poster.jpg) Produced Video
Produced Video - ID: 13614
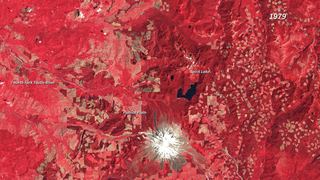
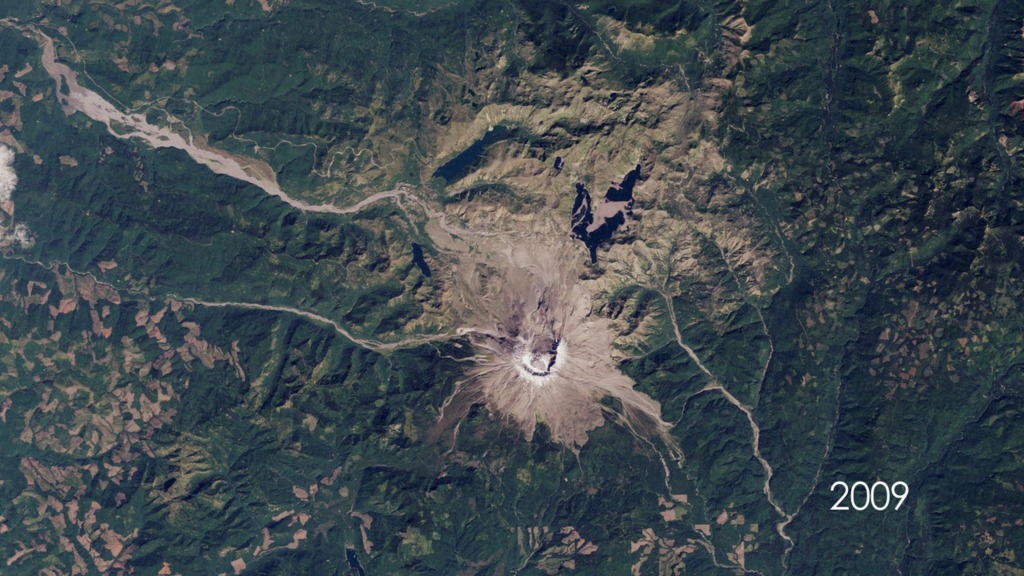
![The long record of Landsat data (since 1972) is helping scientists Sean Healey and Zhiqiang Yang of the Rocky Mountain Research Station (U.S. Forest Service) study the long-term impact of the May 18, 1980, eruption of Mount St. Helens. With Landsat data for 8 years before the eruption, and 40 years since, they have calculated the percent tree cover for each year, watching as vegetation grows back.Music: The Waiting Room by Sam Dodson [PRS], published by Atmosphere Music Ltd [PRS]; Inner Strength by Brava [SGAE], Dsilence [SGAE], Input [SGAE] , Output [SGAE], published by El Murmullo Sarao [SGAE], Universal Sarao [SGAE], Some Assembly by Kyle Fredrickson [ASCAP] and Taylor Alexander Locke [BMI], published by Killer Tracks [BMI], Soundcast Music [SESAC], and Light From Dark by Adam Salkeld [PRS] and Neil Pollard [PRS], published by Atmosphere Music Ltd [PRS], all available from Universal Production Music.
Complete transcript available.Watch this video on the NASA Goddard YouTube channel.](/vis/a010000/a013600/a013614/13614_Mt_St_Helens_print.png) Produced Video
Produced Video - ID: 13492
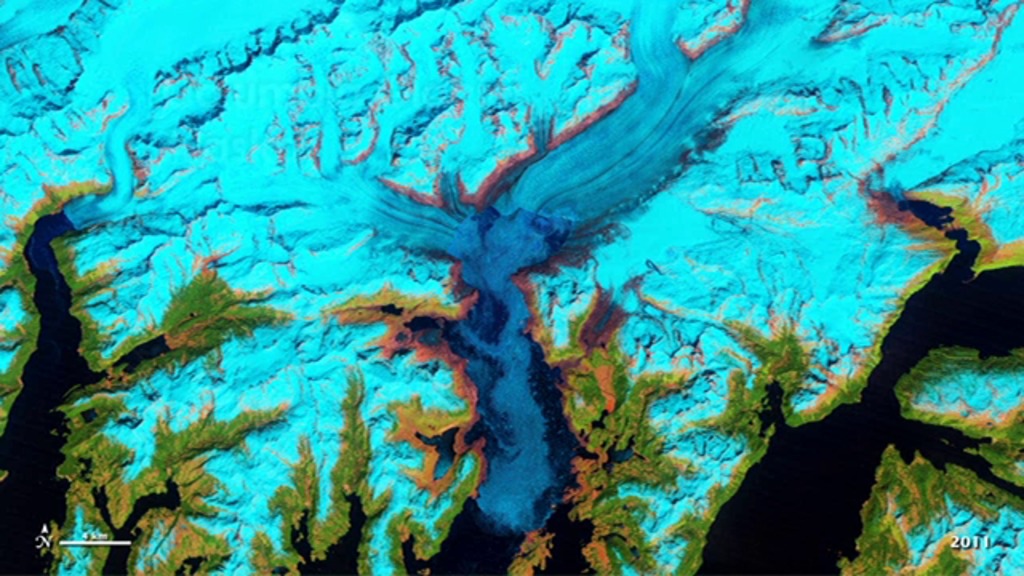
![Mark Fahnestock, a scientist with the Geological Institute of the University of Alaska Fairbanks, has assembled annual mosaics of all the glaciers in Alaska and the Yukon using Landsat images going back to 1972. Using these mosaics, Mark is able to study glacier motion and speed.All music published by Atmosphere Music Ltd [PRS]: Inducing Waves, composer Ben Niblett [PRS] Jon Cotton [PRS]; Critical Pathway, composer Rik Carter [PRS]; Emerging Discovery, composer Rik Carter [PRS]Complete transcript available.Watch this video on the NASA Goddard YouTube channel.](/vis/a010000/a013400/a013492/13492_Alaska_Glaciers_mosaic_print.jpg) Produced Video
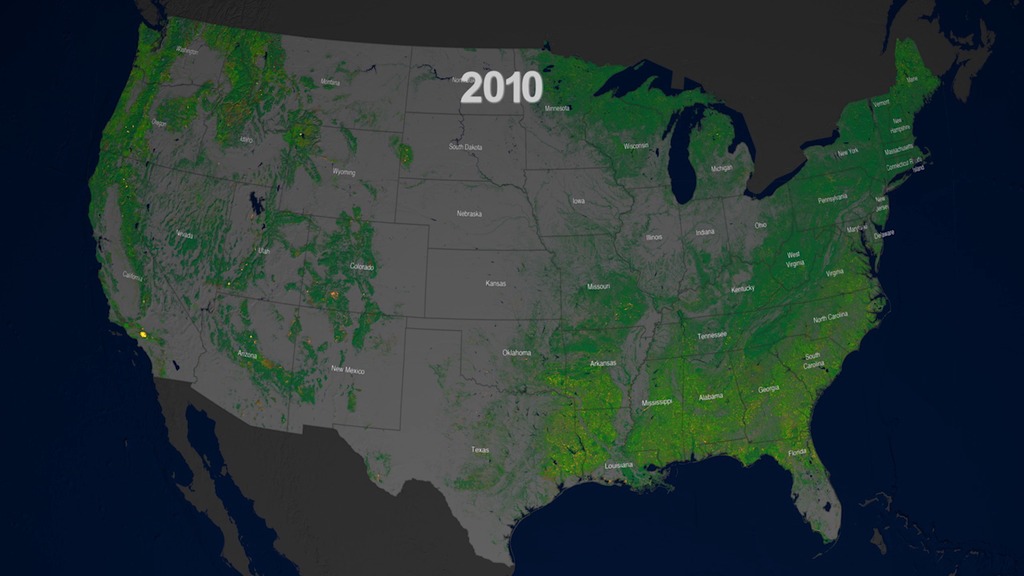
Produced Video - ID: 13417
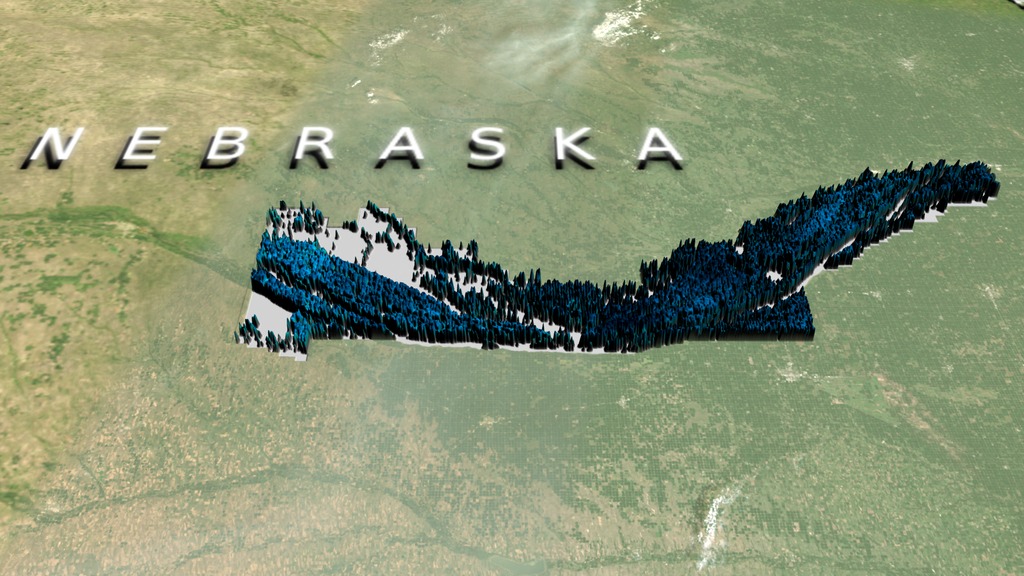
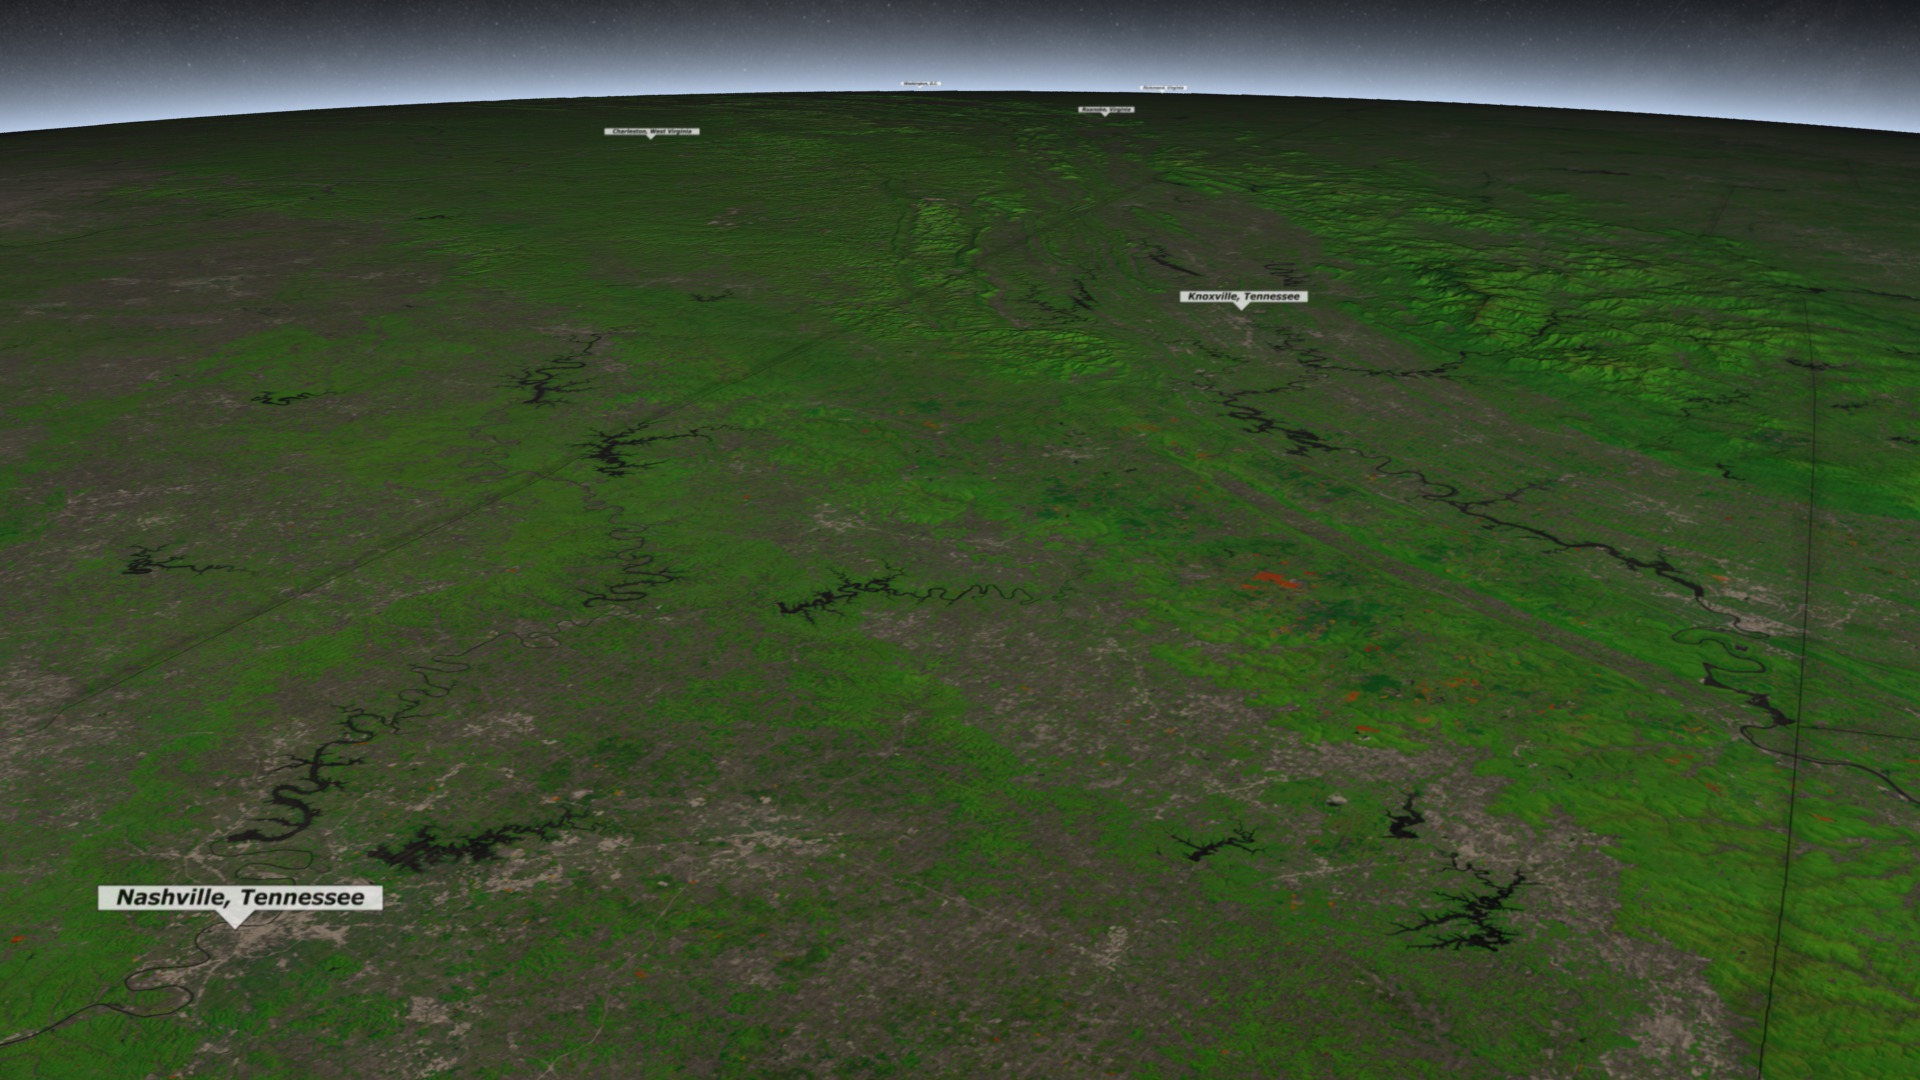
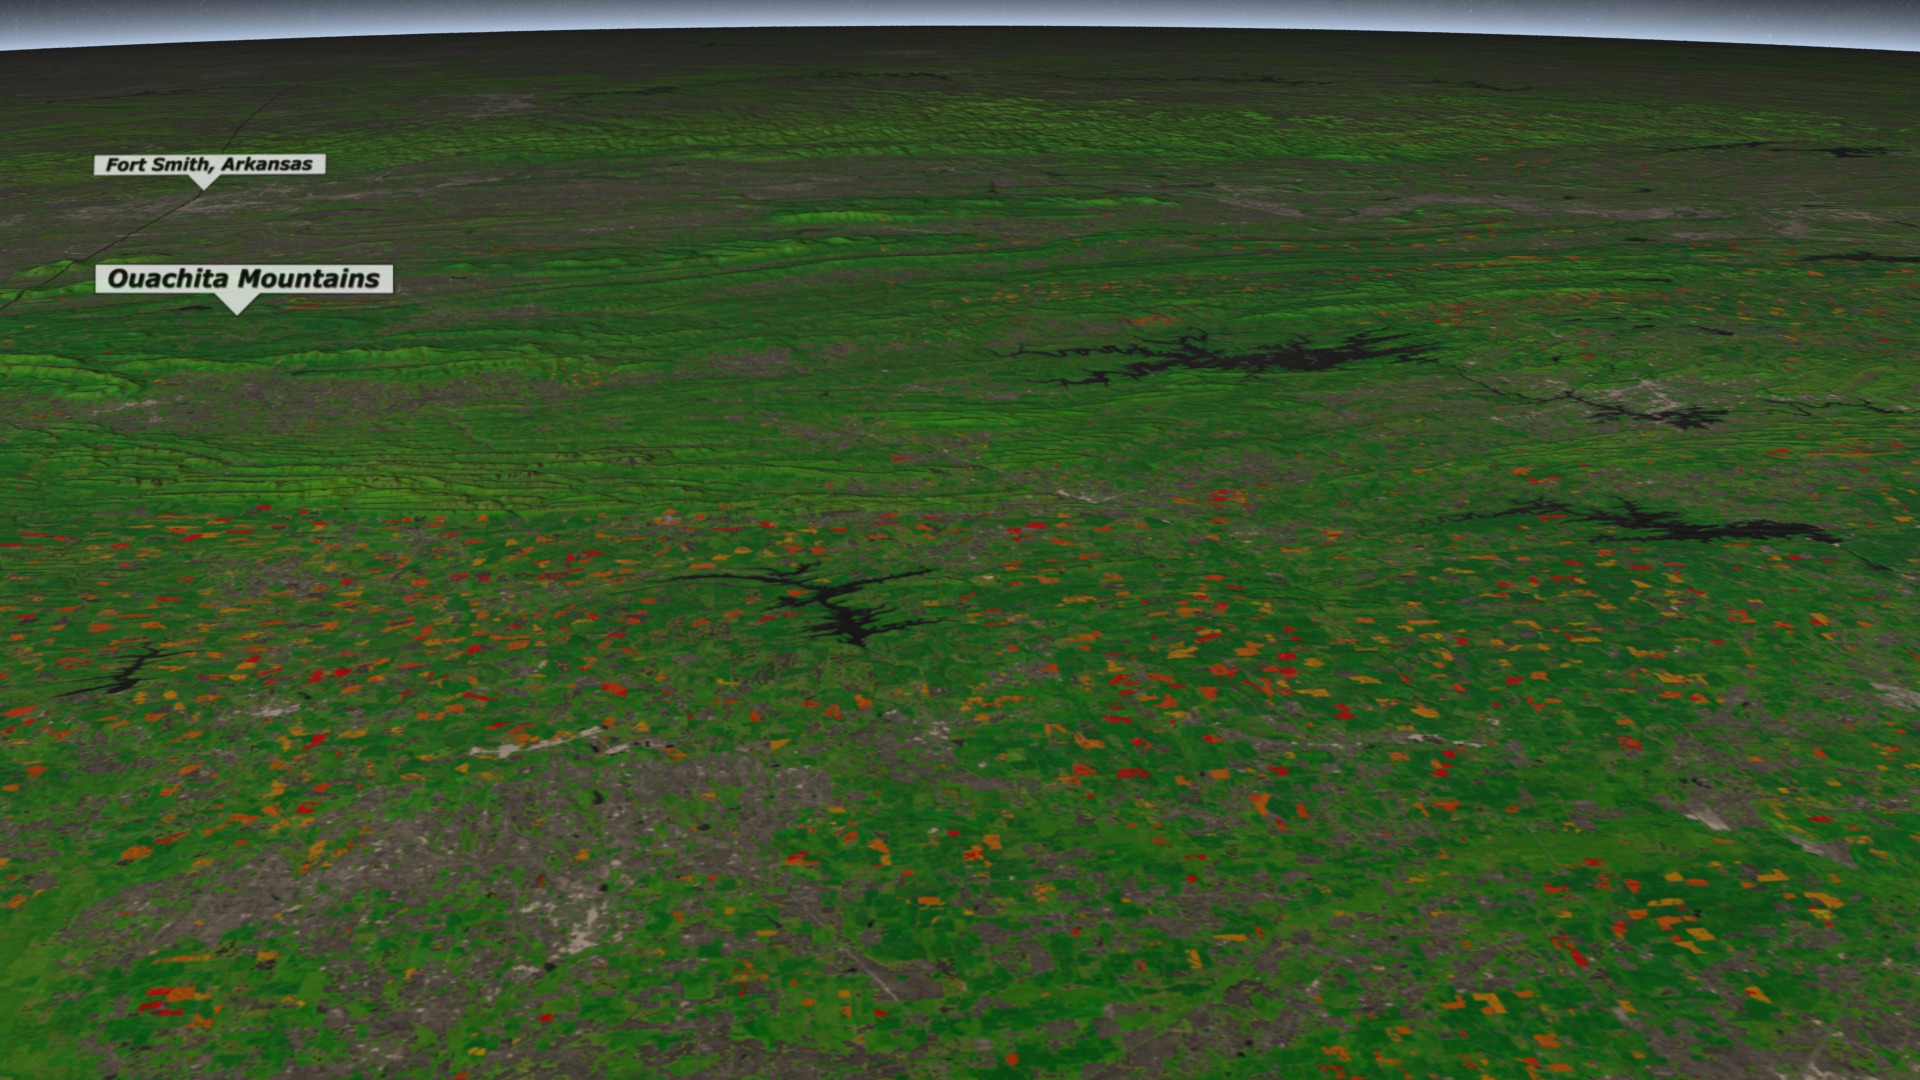
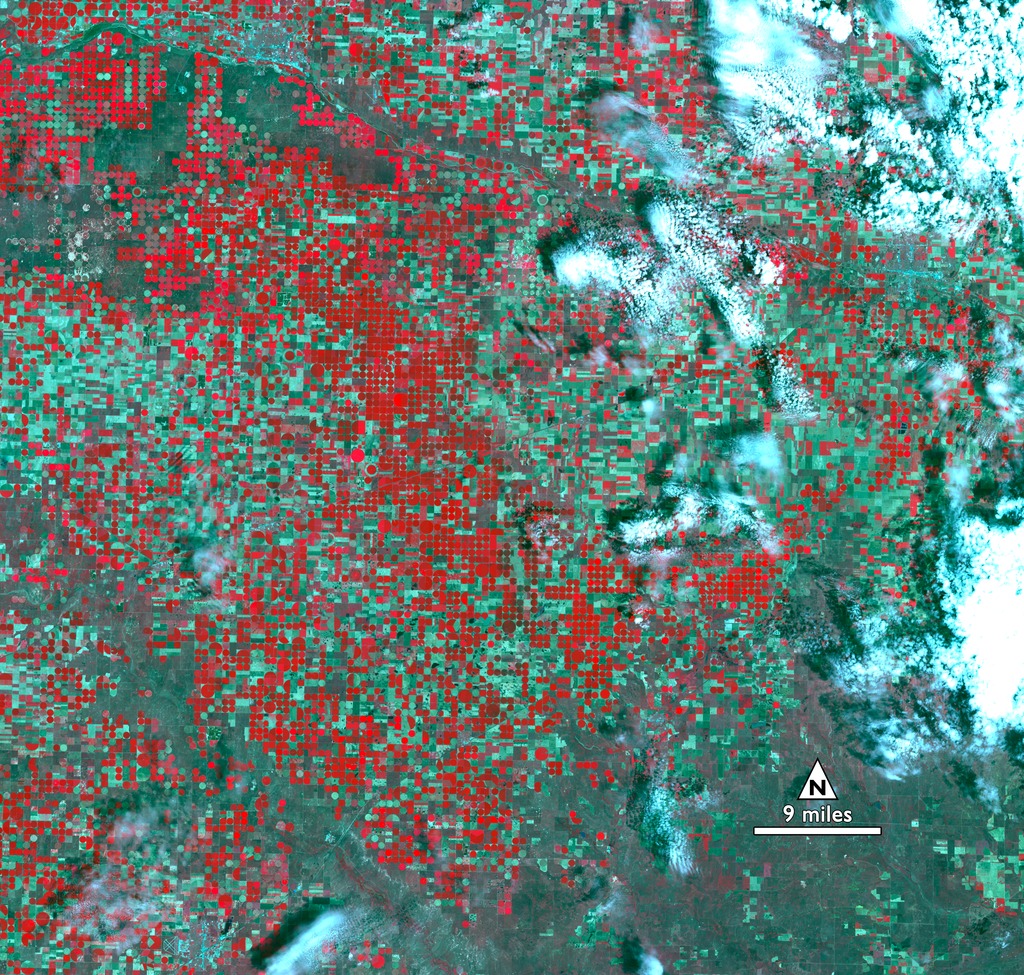
![The U.S. Department of Agriculture tracks how many acres and the annual yield for every crop produced. One method used to estimate crop acreage and yield is remote-sensing data from the NASA-USGS Landsat satellite program. The program started in 1997,with North Dakota, and by 2008 covered the entire lower 48 states and the District of Columbia. Music: "Downloading Landscapes" by Andrew Michael Britton [PRS] and David Stephen Goldsmith [PRS]. Published by Atmosphere Music Ltd [PRS].Complete transcript available.Watch this video on the NASA Goddard YouTube channel.](/vis/a010000/a013400/a013417/13417_Landsat_Croplands_print.jpg) Produced Video
Produced Video - ID: 12051
 Produced Video
 - ID: 12770
 Produced Video
 - ID: 11761
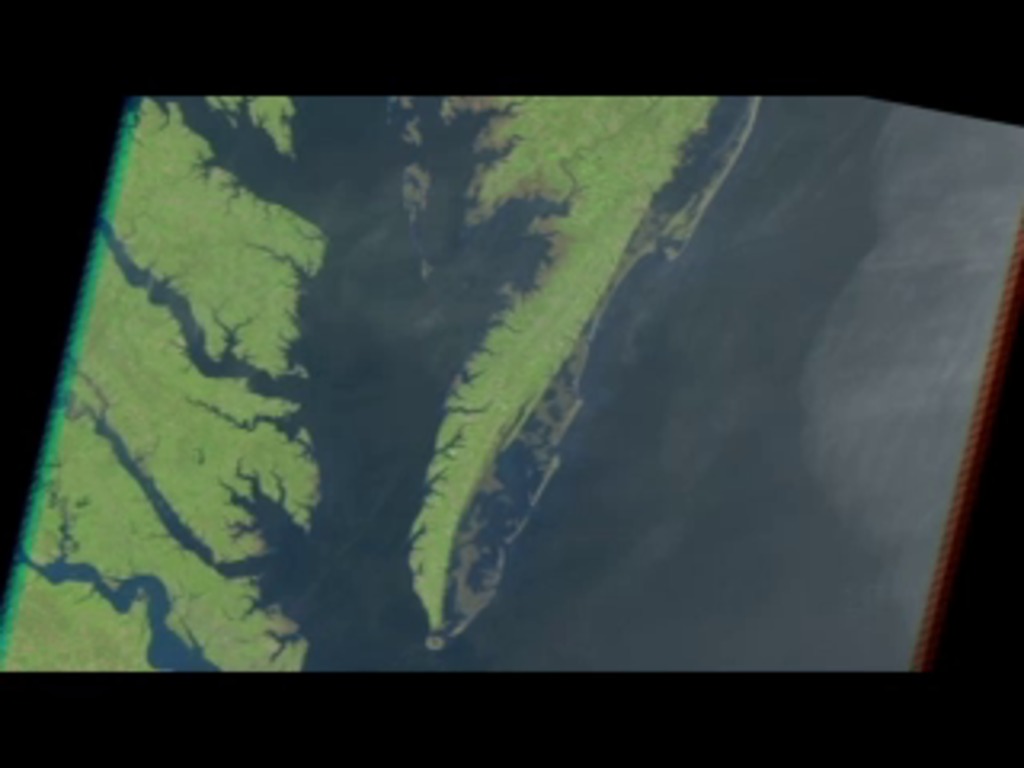
![Since 1972, Landsat satellites have orbited our home planet, collecting data about the land surface we rely on. This video shows footage of the launch of the first Landsat satellite, on July 23, 1972, and a timelapse of the changing coastal wetlands in Atchafalaya Bay, Louisiana.Music credit: Step By Step, by Gresby Race Nash [PRS]](/vis/a010000/a011700/a011761/11761_Atchafalaya_Delta_Landsat45th_large.00385_print.jpg) Produced Video
Produced Video - ID: 12612
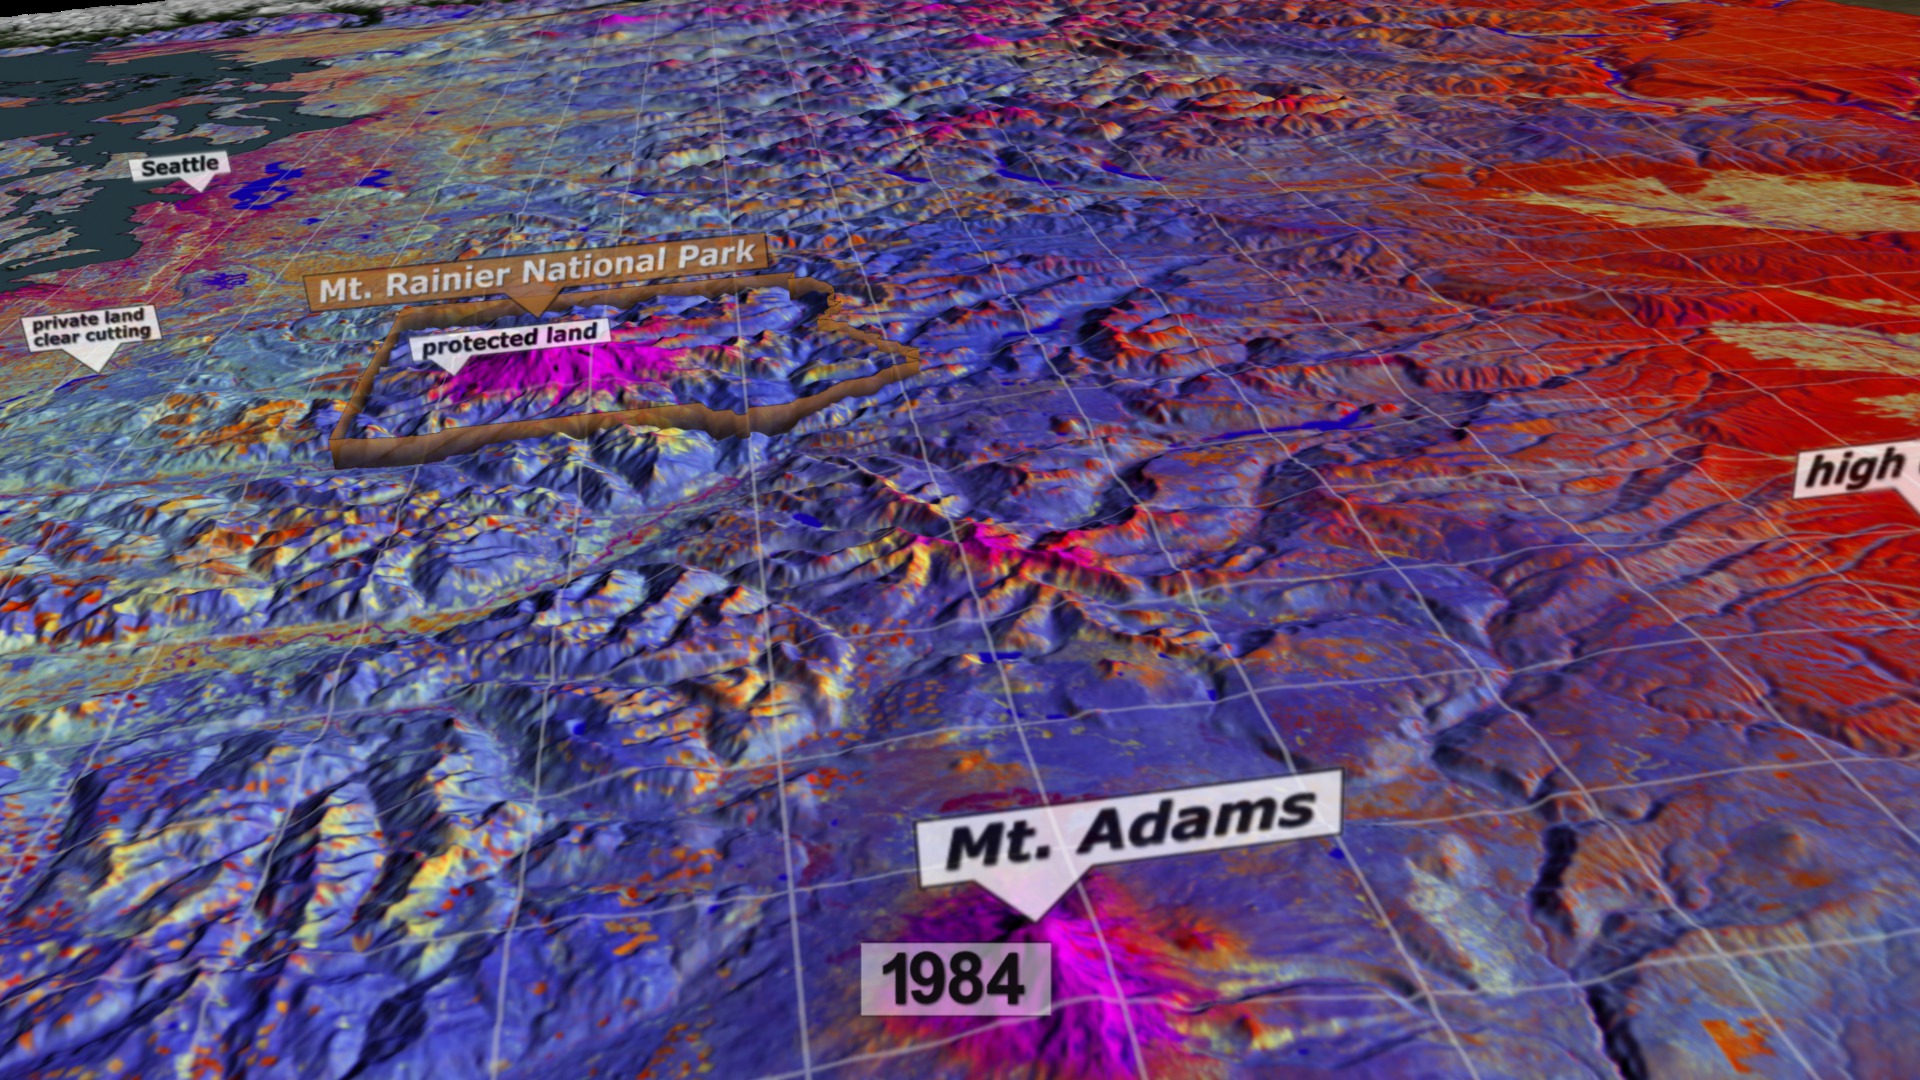
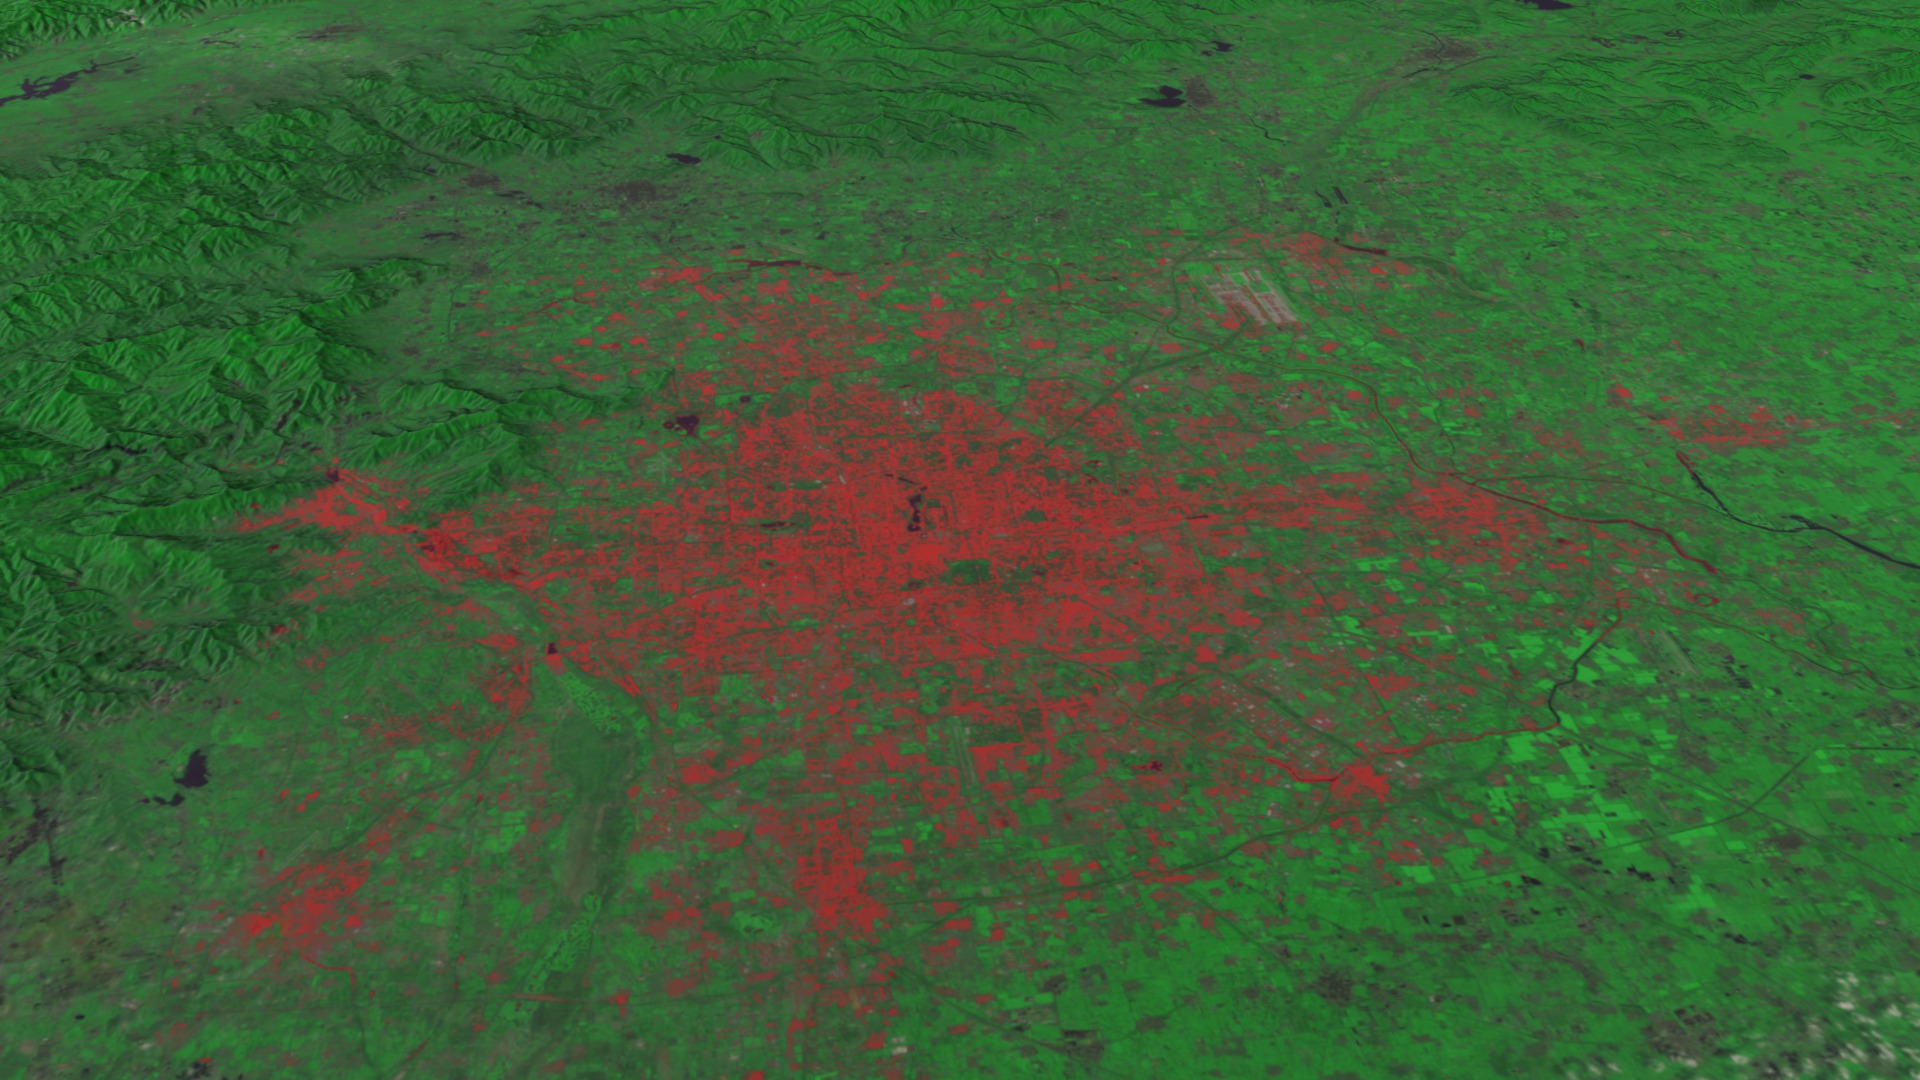
![In 1980, Mount St. Helens roared back into major activity with a massive eruption that leveled surrounding forest, blasted away over a thousand feet of the mountain's summit, and claimed 57 human lives.This short video shows the catastrophic eruption - and the amazing recovery of the surrounding ecosystem - through the eyes of the Landsat satellites, which have been imaging our planet for almost forty years. By observing red, near-infrared, and green wavelengths of light reflected off the surface, it is possible to distinguish healthy vegetation (in green) from bare ground (in magenta).Music: Running by Dirk Ehlert [BMI], Guillermo De La Barreda [BMI]Watch this video on the NASA Goddard YouTube channel.](/vis/a010000/a012600/a012612/12612-Mt-St-Helens-timelapse-print.jpg) Produced Video
Produced Video - ID: 30162
 Hyperwall Visual
 - ID: 12444
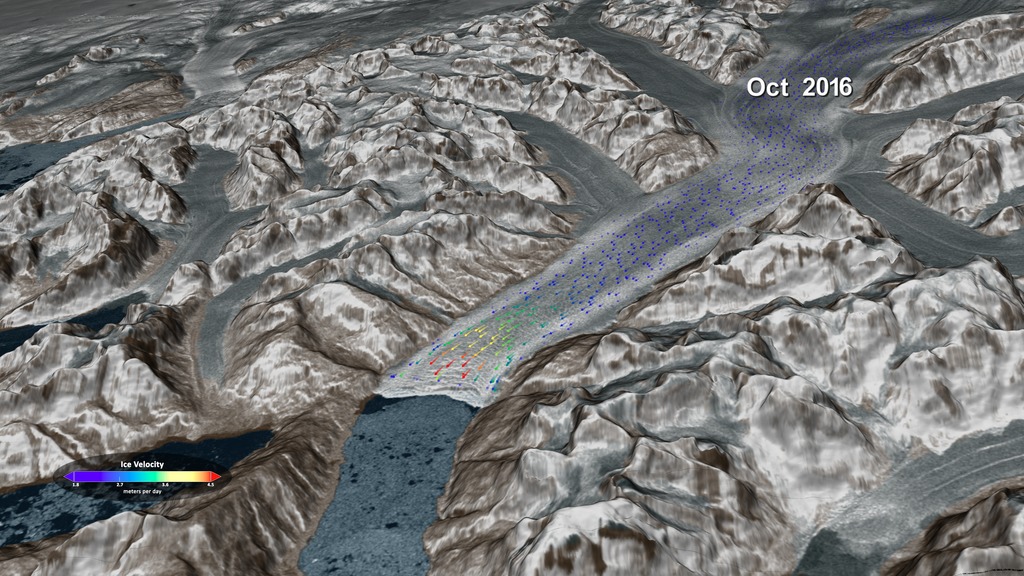
![Heimdal Glacier in southeastern Greenland shows a regular speed up and slow down with the seasons. Peak speeds are around May/June, and low speeds occur in September/October. This velocity data is a result of new analysis of imagery from the Operational Land Imager on the NASA/USGS Landsat 8 satellite, part of the Global Landsat Ice Velocity Extraction (GoLIVE) project.Music credit: Tiny Worlds by Christian Telford [ASCAP], David Travis Edwards [ASCAP], Matthew St Laurent [ASCAP], Robert Anthony Navarro [ASCAP]Complete transcript available.Watch this video on the NASA Goddard YouTube channel.](/vis/a010000/a012400/a012444/LARGE_MP4-12444_icevelocity_fix_large.00155_print.jpg) Produced Video
Produced Video - ID: 12633
 Produced Video
 - ID: 12225
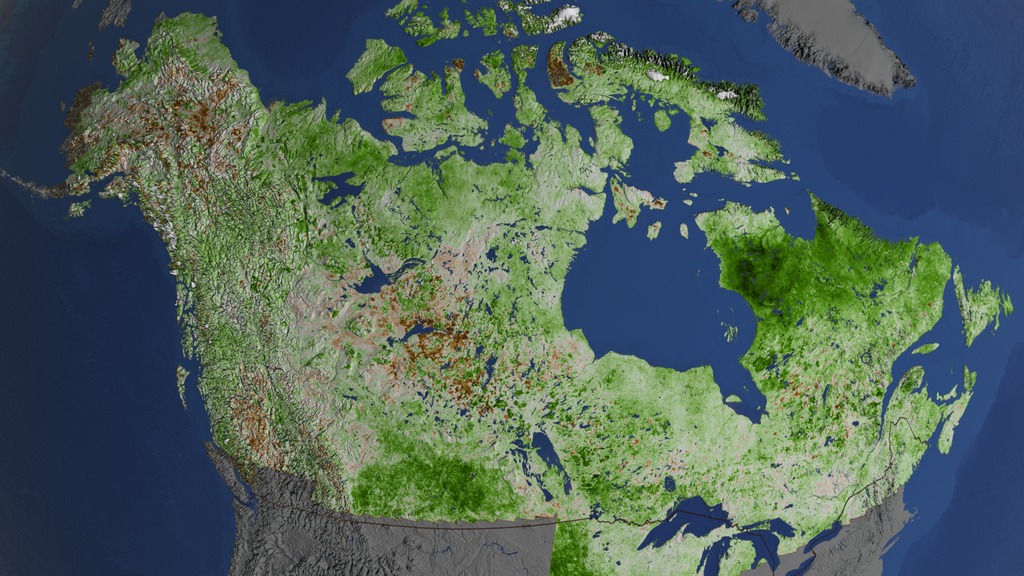
![NASA scientists used almost 30 years of data from the NASA/USGS Landsat satellites to track changes in vegetation in Alaska and Canada. Of the more than 4 million square miles, 30% had increases in vegetation (greening) while only 3% had decreases (browning). This is the first study to produce a continent-scale map while still providing detailed information at the human scale.Music: "Alaska," by Janik Riegert [GEMA], Josh Tapen [GEMA]Watch this video on the NASA Goddard YouTube channel.](/vis/a010000/a012200/a012225/12225_Arctic_greening_MASTER_large.00140_print.jpg) Produced Video
Produced Video - ID: 11974
 Produced Video
 - ID: 11393
 Produced Video
 - ID: 11290
 Produced Video
 - ID: 4013
- Section
- ID: 10721
 Produced Video
 - ID: 11030
 Produced Video
 - ID: 11041
 Produced Video
 - ID: 11042
 Produced Video
 - ID: 11050
 Produced Video
- ID: 11028
 Produced Video
 - ID: 10753
 Produced Video
 - ID: 10550
 Produced Video
 - ID: 10773Produced Video
- ID: 11615
 Produced Video
Celebrating Milestones
- ID: 11051 Produced Video
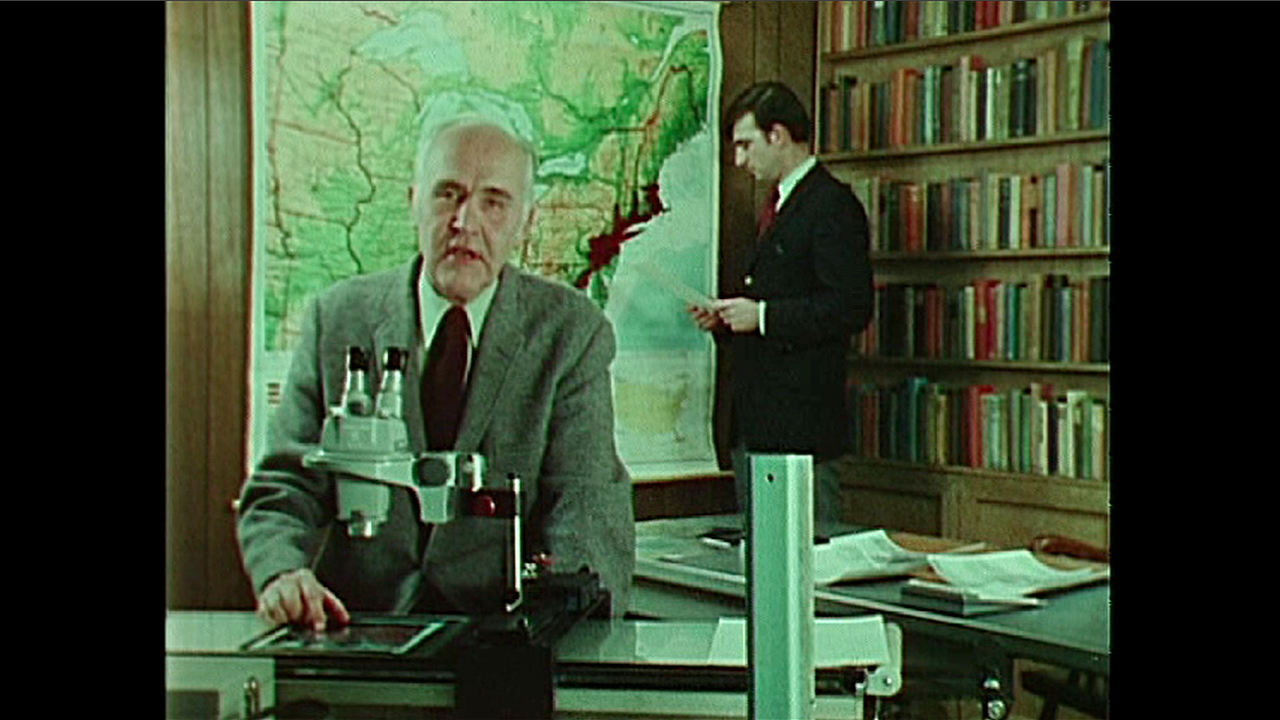
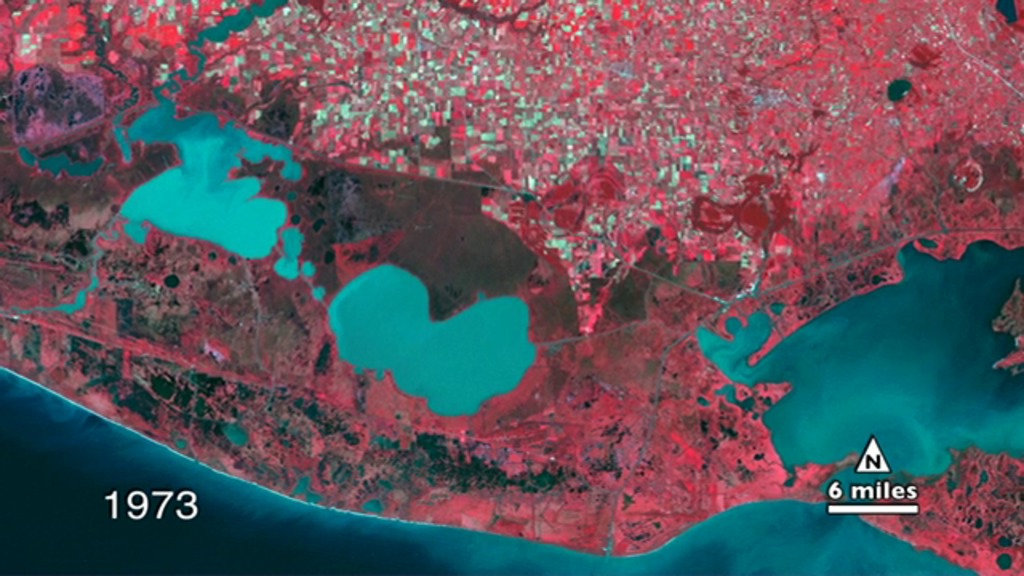
Landsat—From the Archives
Go to this pageThe Landsat program is the longest continuous global record of Earth observations from space — ever. On July 23, 1972 NASA launched the first satellite in this program, then known as ERTS, the Earth Resources Technology Satellite and later renamed Landsat 1. In honor of that history, NASA edited together selections of an archive video from 1973 about the ERTS launch.Featured in this 1973 video was a senior geologist at NASA, Nicholas Short, and at Dartmouth College, Robert Simpson and David Lindgren. NASA and the U.S. Department of the Interior through the U.S. Geological Survey (USGS) jointly manage Landsat, and the USGS preserves a nearly 50-year archive of Landsat data that is freely available over the Internet. The next Landsat satellite, known as Landsat 9, is scheduled for launch in 2021.For more information about Landsat visit www.nasa.gov/landsat, or landsat.usgs.govTo watch the entire 23-minute long NASA archive video of the ERTS Launch, go here. ||
- ID: 11289 Produced Video
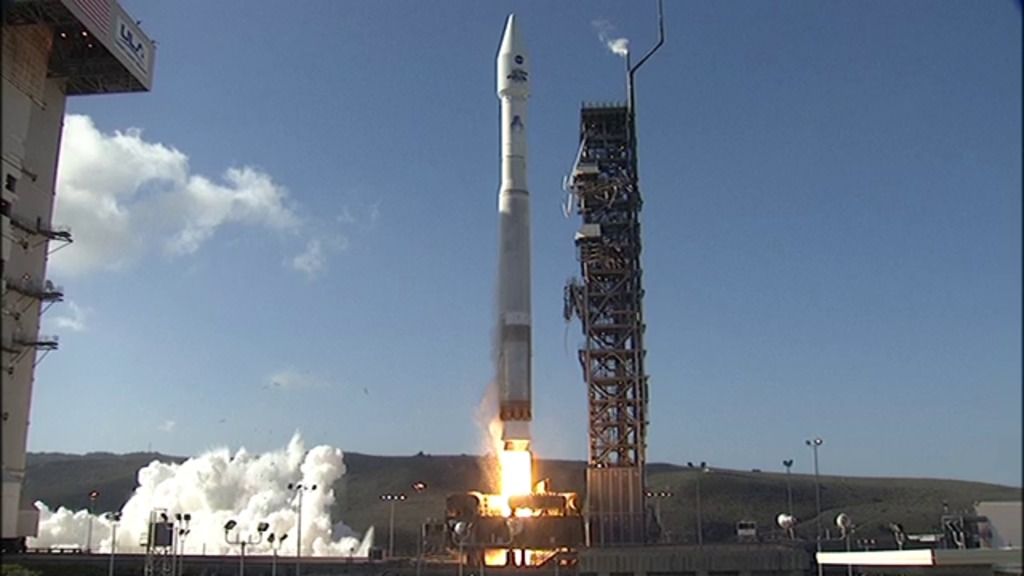
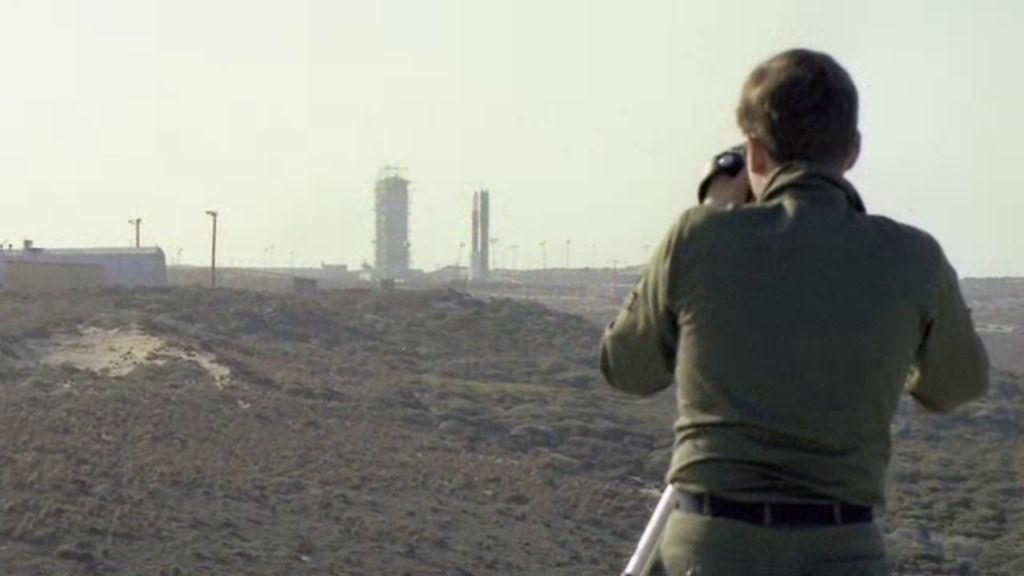
Landsat 8 Launch footage
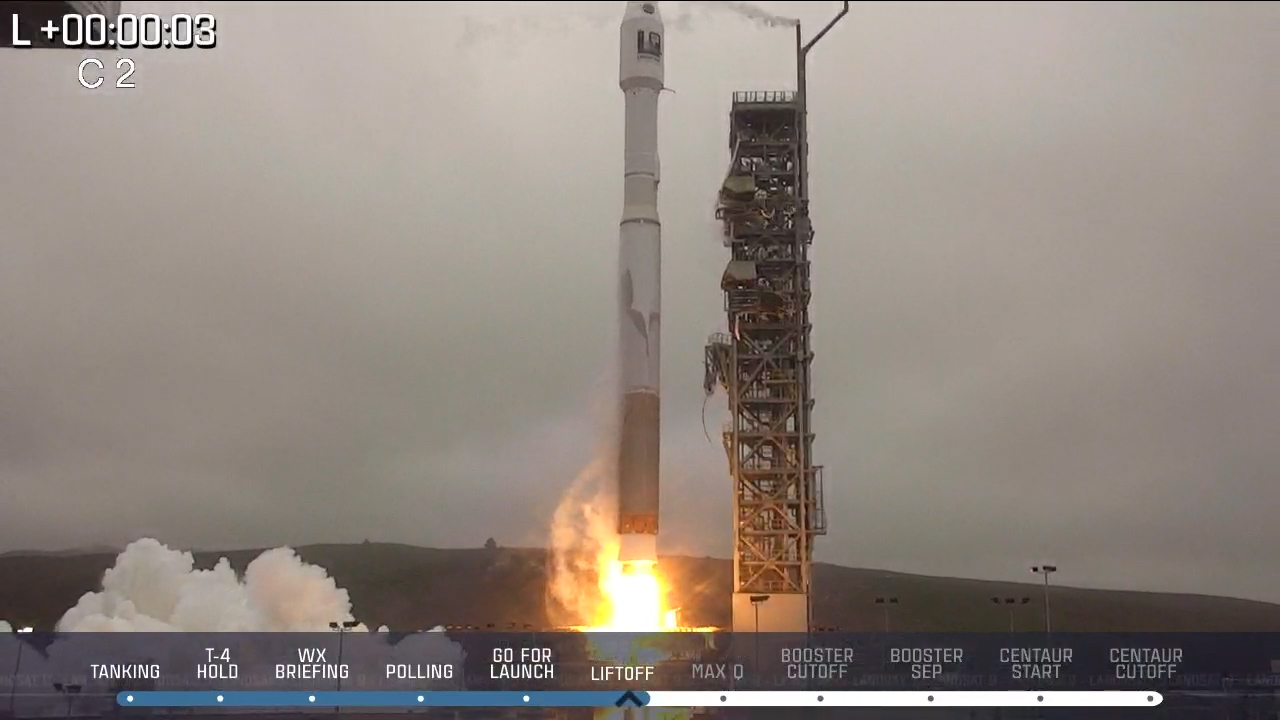
Go to this pageThe Landsat Data Continuity Mission launched on February 11, 2013, from Vandenberg Air Force Base aboard an Atlas V-401 rocket.LDCM will be renamed Landsat 8 when operations are handed over to the US Geological Survey on May 30, 2013. NASA and the U.S. Department of the Interior through the U.S. Geological Survey (USGS) jointly manage Landsat, and the USGS preserves a 40-year archive of Landsat images that is freely available data over the Internet. ||
- ID: 11035 Produced Video
Landsat 8 Video File
Go to this pageThe Landsat Data Continuity Mission (LDCM) is a collaboration between NASA and the U.S. Geological Survey that will continue the Landsat Program's 40-year data record of monitoring Earth's landscapes from space. LDCM will expand and improve on that record with observations that advance a wide range of Earth sciences and contribute to the management of agriculture, water and forest resources.The LDCM observatory was successfully launched aboard an Atlas V-401 rocket on February 11, 2013, from Vandenberg Air Force Base. The operation of the satellite will be handed over to the U.S. Geological Survey on May 30, 2013. ||
- ID: 12851 Produced Video
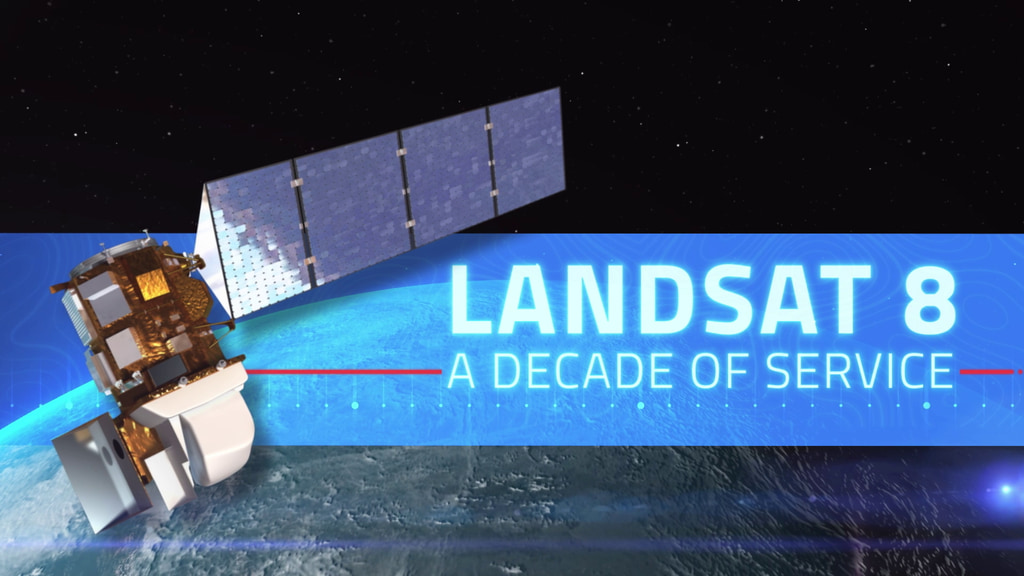
![In its five years in space, Landsat 8 made 26,500 orbits around Earth and captured 1.1 million "scenes" of our home planet, representing 16 percent of all the observations kept in the 45-year Landsat archive.Music: Divine Punishment by Christopher Franke [BMI]Complete transcript available.](/vis/a010000/a012800/a012851/12851_Landsat8_5_year_large.01975_print.jpg)
5th Anniversary of Landsat 8's Launch
Go to this pageIn its five years in space, Landsat 8 made 26,500 orbits around Earth and captured 1.1 million "scenes" of our home planet, representing 16 percent of all the observations kept in the 45-year Landsat archive.Music: Divine Punishment by Christopher Franke [BMI]Complete transcript available. || 12851_Landsat8_5_year_large.01975_print.jpg (1024x576) [50.2 KB] || 12851_Landsat8_5_year_large.01975_searchweb.png (320x180) [7.1 KB] || 12851_Landsat8_5_year_large.01975_thm.png (80x40) [1.4 KB] || 12851_Landsat8_5_year_prores_1920.mov (1920x1080) [4.7 GB] || 12851_Landsat8_5_year_prores_1280.mov (1280x720) [2.5 GB] || 12851_Landsat8_5_year_large.mp4 (1920x1080) [191.3 MB] || 12851_Landsat8_5_year_youtube_1080.mp4 (1920x1080) [327.2 MB] || 12851_Landsat8_5_year_youtube_720.mp4 (1280x720) [315.6 MB] || 12851_Landsat8_5_year_twitter_720.mp4 (1280x720) [53.5 MB] || 12851_Landsat8_5_year.webm (960x540) [76.4 MB] || 12851_Landsat8_5_year-captions.en_US.srt [3.8 KB] || 12851_Landsat8_5_year-captions.en_US.vtt [3.8 KB] ||
- ID: 11490 Produced Video
Landsat 8 Celebrates First Year in Orbit
Go to this pageOn Feb. 11, 2013, Landsat 8 launched into Earth orbit, riding on an Atlas V rocket. Weighing 6,133 pounds, Landsat 8 is the eigth satellite in the long-running Landsat program, jointly managed by NASA and the U.S. Geological Survey. At 16 feet tall, with a 32 foot long solar array, Landsat 8 orbits Earth at an altitude of 438 miles, moving at a speed of 16,760 miles per hour. It takes 99 minutes to complete one orbit, with about 14.5 orbits each day. There have been 5,319 orbits in the first year of Landsat 8's mission. It takes 16 days to build a complete scan of the globe, and on the 17th day the orbit cycle begins again.Between the two instruments on board, Landsat 8 records data in 11 separate wavelength regions spanning visible, infrared, and thermal radiation. The data is transmitted several times a day to the USGS Earth Resources and Observation Science Center in Sioux Falls, SD, where it is added to the archive of Landsat data stretching back to 1972. In its first year, users have downloaded 1,322,969 scenes of Landsat 8 data from the USGS.Landsat 8 continues the decades-long Landsat record of Earth's land surface at a scale where the impacts of humans and nature can be detected and monitored over time. Every continent, every season, every year, at a resolution that can distinguish an area the size of a baseball field. With help from Landsat we can monitor the cultivation of our food crops, quantify our precious water resources as they ebb and flow, and track deforestation globally. Landsat data constitute a key ingredient in decision making for agriculture, climate research, disaster mitigation, ecosystems, forestry, human health, urban growth, and water management. ||
- ID: 11049 Produced Video
Landsat 40th Liveshot Roll-in Video
Go to this pageOn Friday, July 20th, in advance of Landsat's 40th birthday and a live NASA press conference on Monday the 23rd, NASA scientists are available to discuss amazing & unprecedented images from space of your region. Cities grow, wildfires rage, rivers flood out of their beds and droughts shrink lakes and reservoirs — all captured by Landsat, the world's longest continuous record of Earth from space. Since 1972, Landsat satellites have been orbiting Earth, telling the story of soil moisture, urban spread, land use, assist disasters & recovery. Next year, the 8th Landsat satellite (LDCM) will be launched from California. The Landsat Data Continuity Mission (LDCM) will track food production and water resources, organize disaster recovery and monitor the impact of climate change.The following is broadcast quality video roll-ins in Apple ProRes 422, 1280x720, 59.94 fps. ||
- ID: 11052 Produced Video
Best of "Earth As Art" - Top Five
Go to this pageA series of Landsat satellites have surveyed the Earth's surface since 1972. In that time, Landsat data have become a vital reference worldwide, used for understanding scientific issues related to land use and natural resources. However, some Landsat images are simply striking to look at - presenting spectacular views of mountains and valleys, forests and farms. To celebrate the 40th anniversary of Landsat, the US Geological Survey and NASA asked for your help in selecting the top five Earth As Art images. ||
- ID: 10401 Produced Video
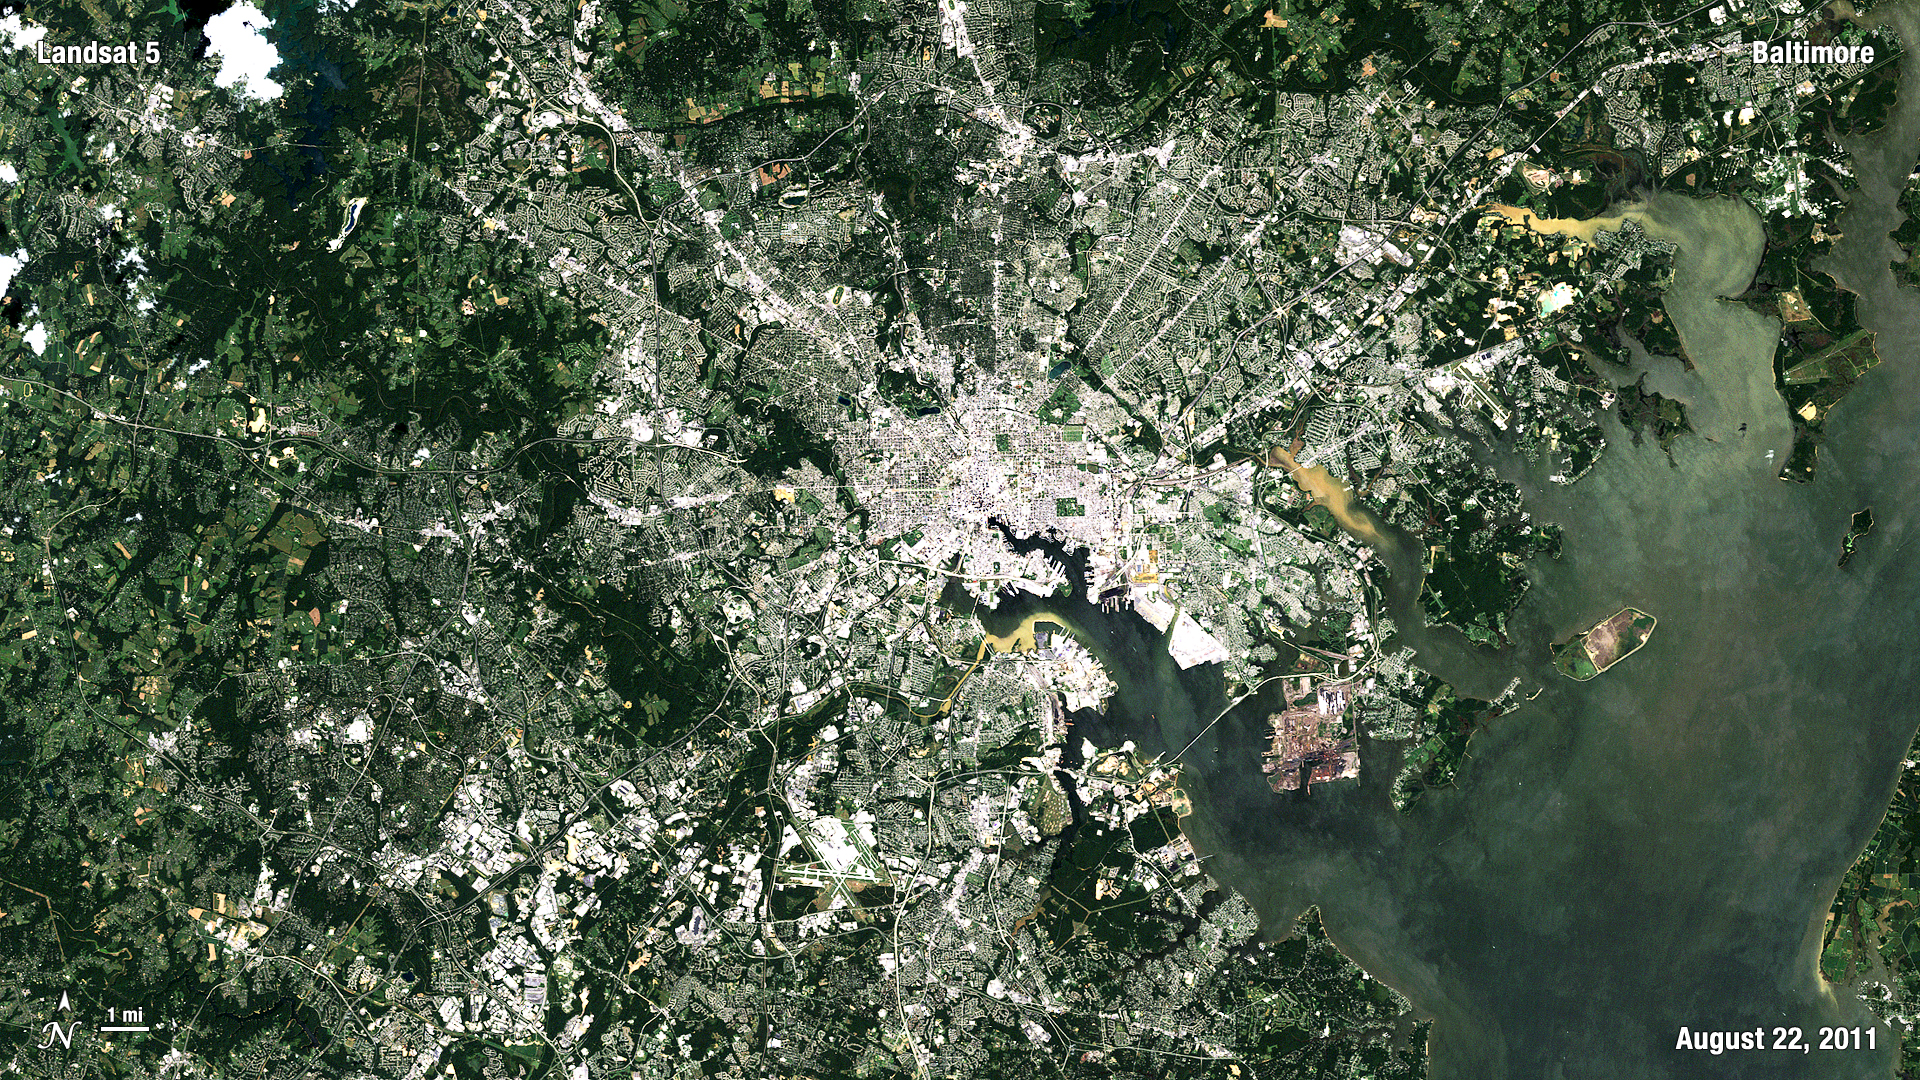
Earth Observing Landsat 5 Turns 25 Years Old
Go to this pageStill observing the Earth after 25 years—22 beyond its three-year primary mission lifetime—Landsat 5 collects valuable scientific data daily. Some attribute the satellite's longevity to over-engineering. Others say it's a long run of good luck. Whatever the reason, no one who attended the satellite's March 1984 launch could have expected it would still be working today.For complete transcript, click here. || Landsat5_turns_25_ipodLG.00202_print.jpg (1024x576) [73.2 KB] || Landsat5_turns_25_ipodLG_web.png (320x180) [149.4 KB] || Landsat5_turns_25_ipodLG_thm.png (80x40) [13.9 KB] || Landsat5_turns_25_appletv.webmhd.webm (960x540) [51.8 MB] || Landsat5_turns_25_appletv.m4v (960x540) [87.6 MB] || Landsat5_turns_25_YouTube.mov (1280x720) [56.6 MB] || Landsat5_turns_25_fullresH264.mov (1280x720) [119.3 MB] || Landsat5_turns_25_ipodLG.m4v (640x360) [42.3 MB] || Landsat5_turns_25_svsSM.mpg (512x288) [32.8 MB] || Landsat5_turns_25_ipodSM.m4v (320x180) [16.4 MB] || Landsat5_turns_25_NASAcast.mp4 (320x236) [30.9 MB] || GSFC_20090227_Landsat5turns25.wmv (346x260) [30.5 MB] ||