Hyperwall Heliophysics
Overview
A topically-organized Gallery of Hyperwall-ready heliophysics content.
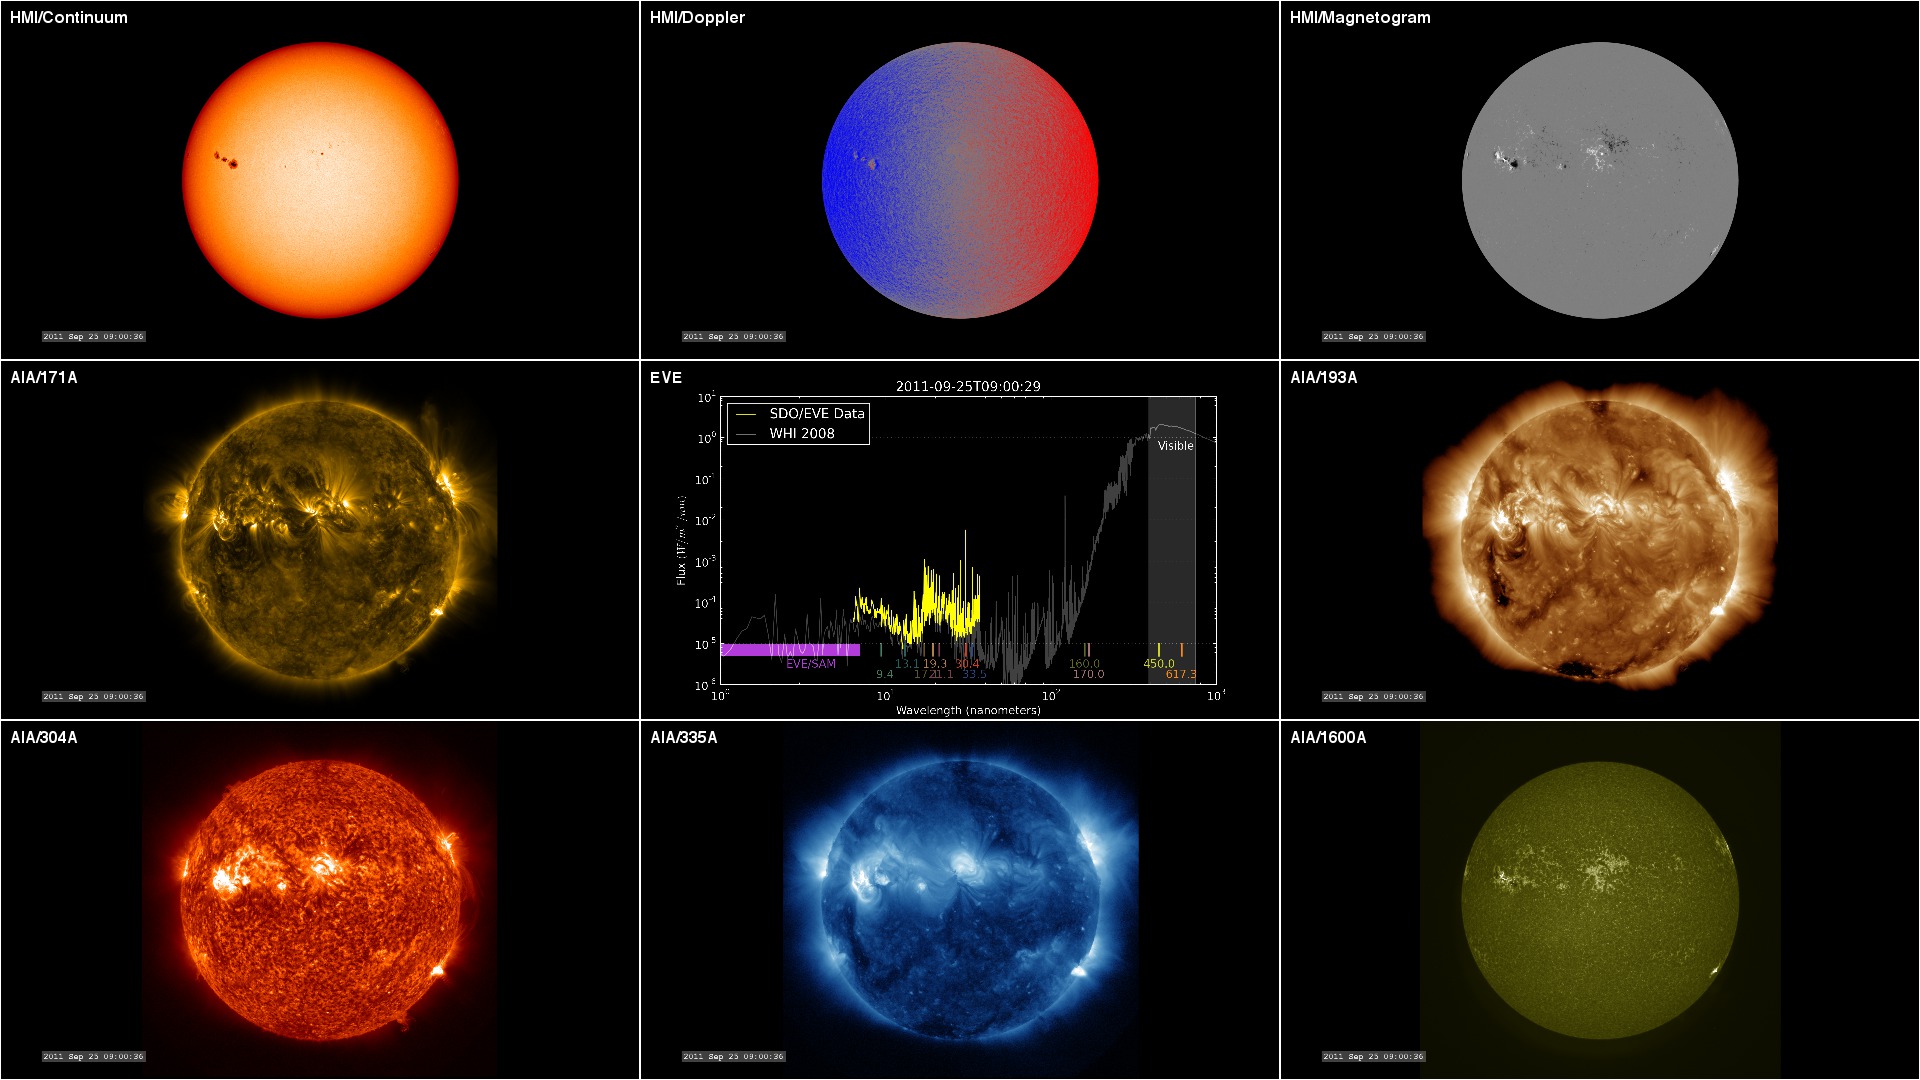
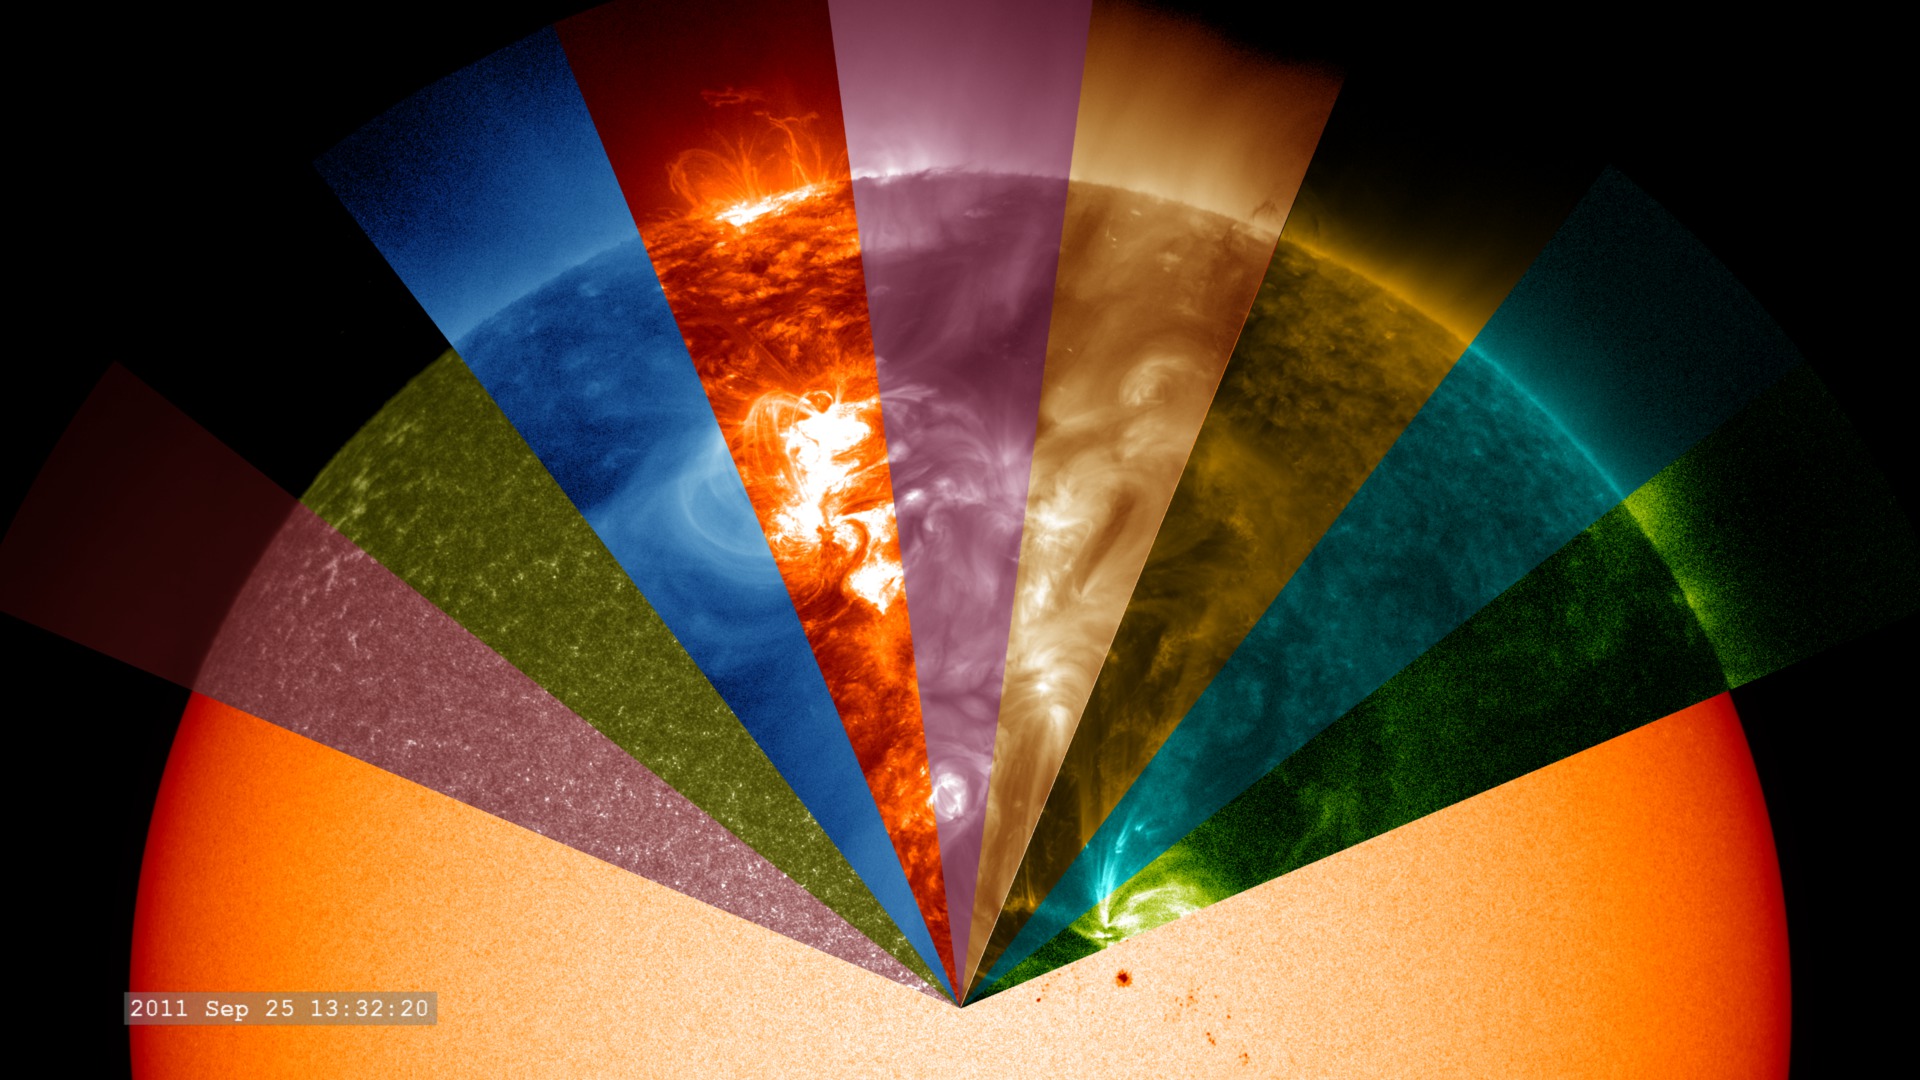
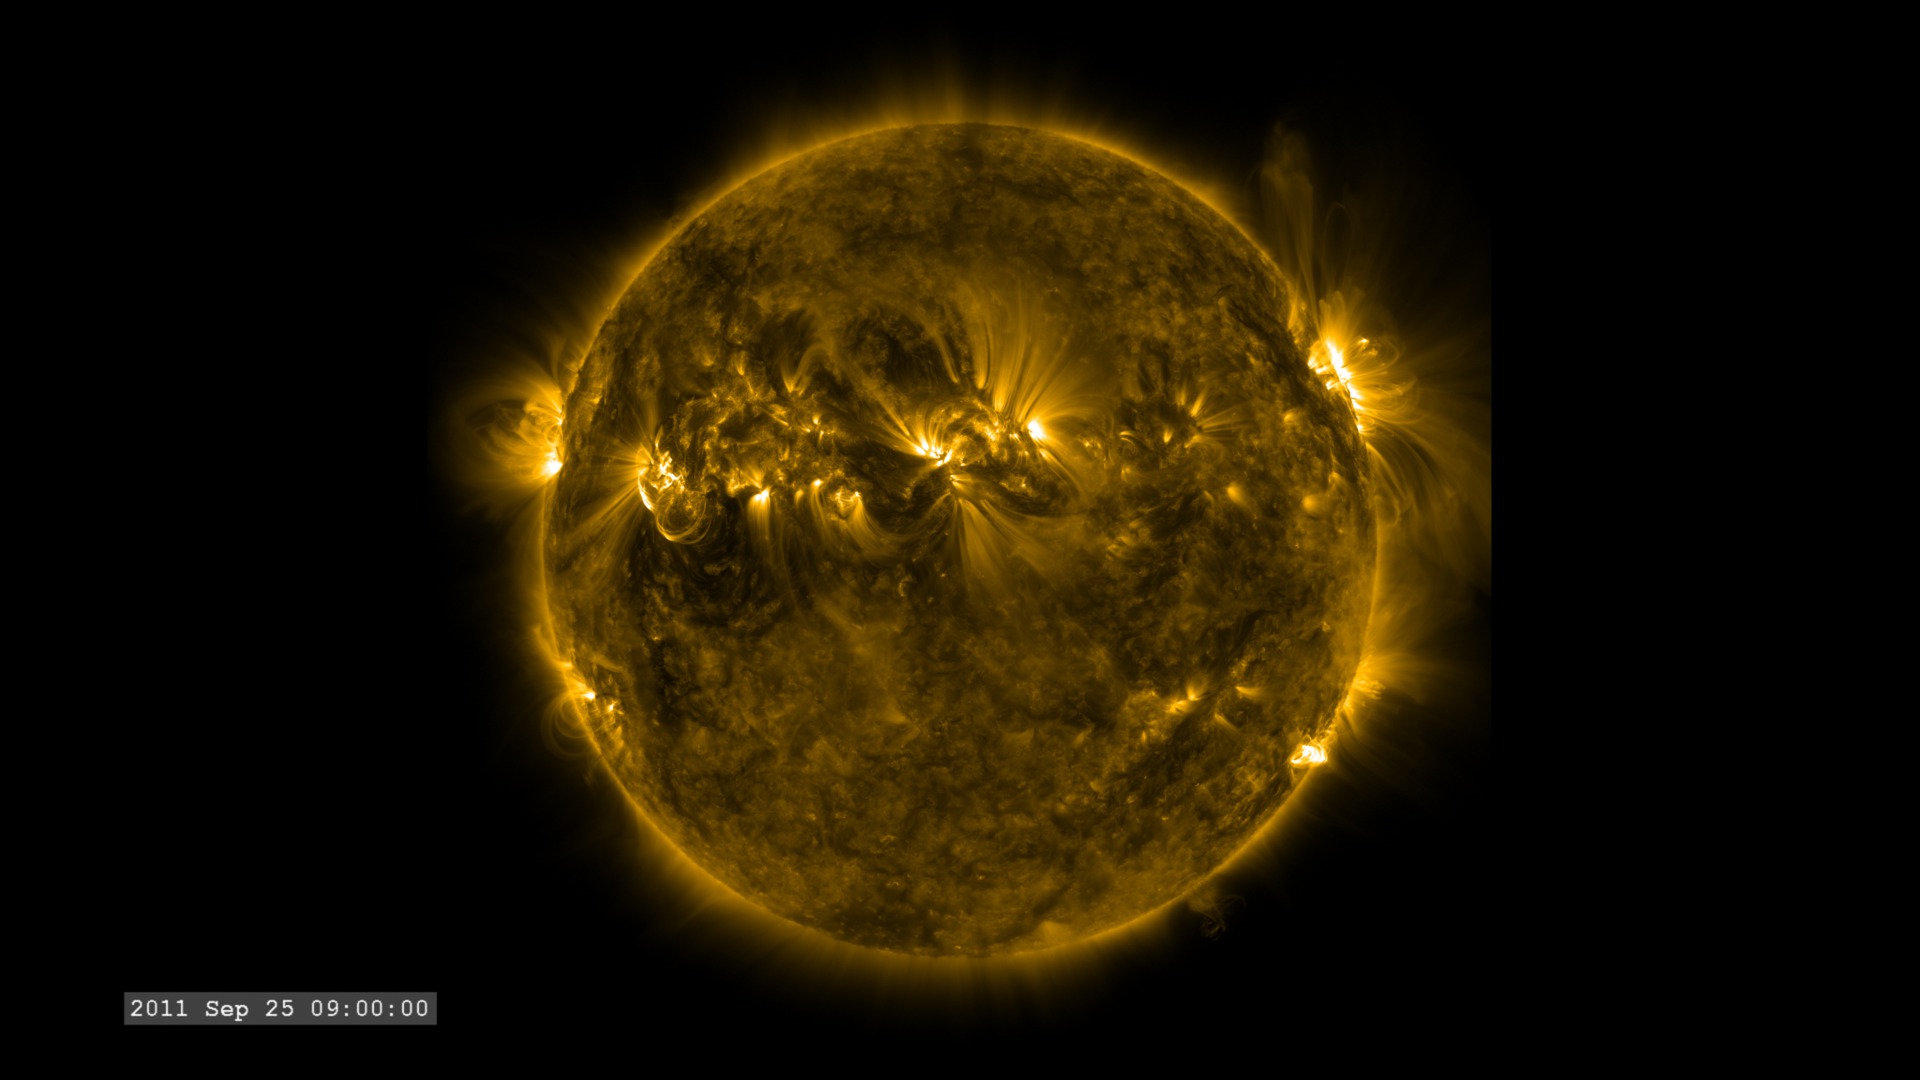
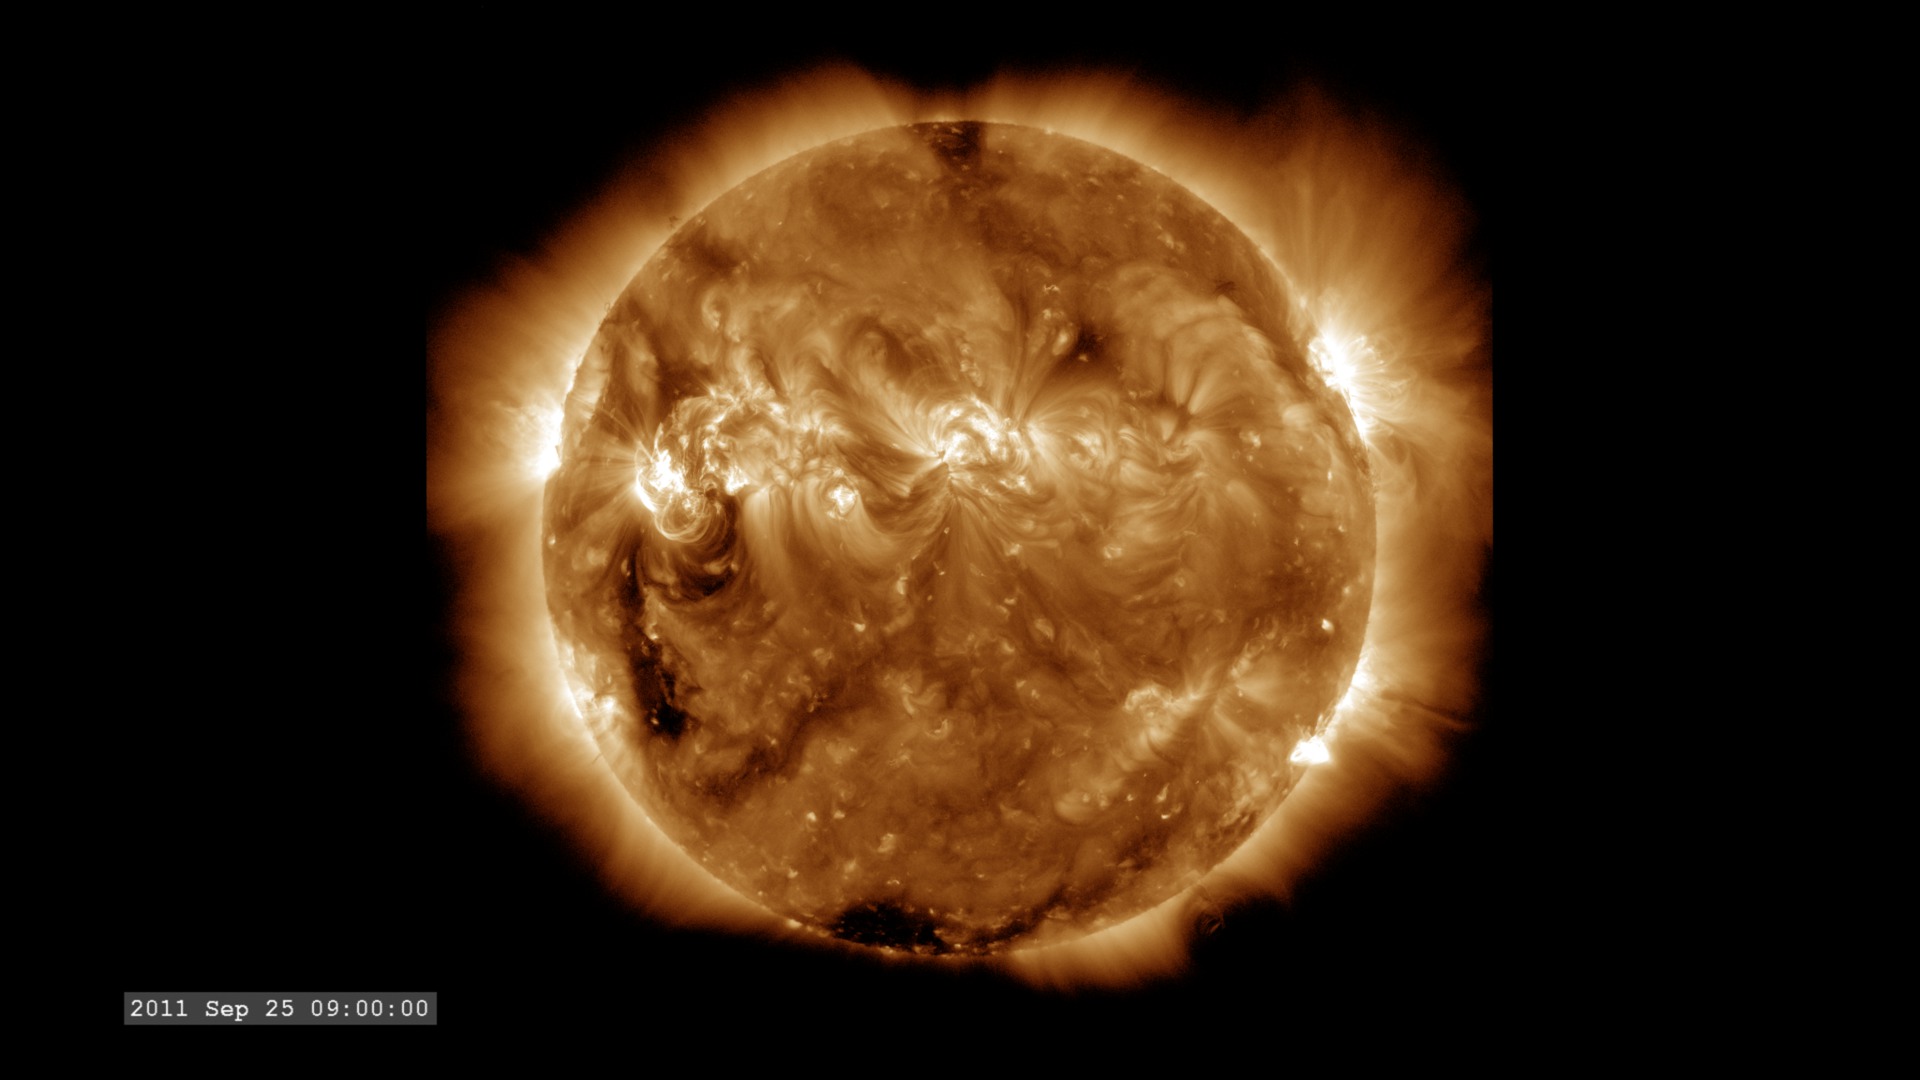
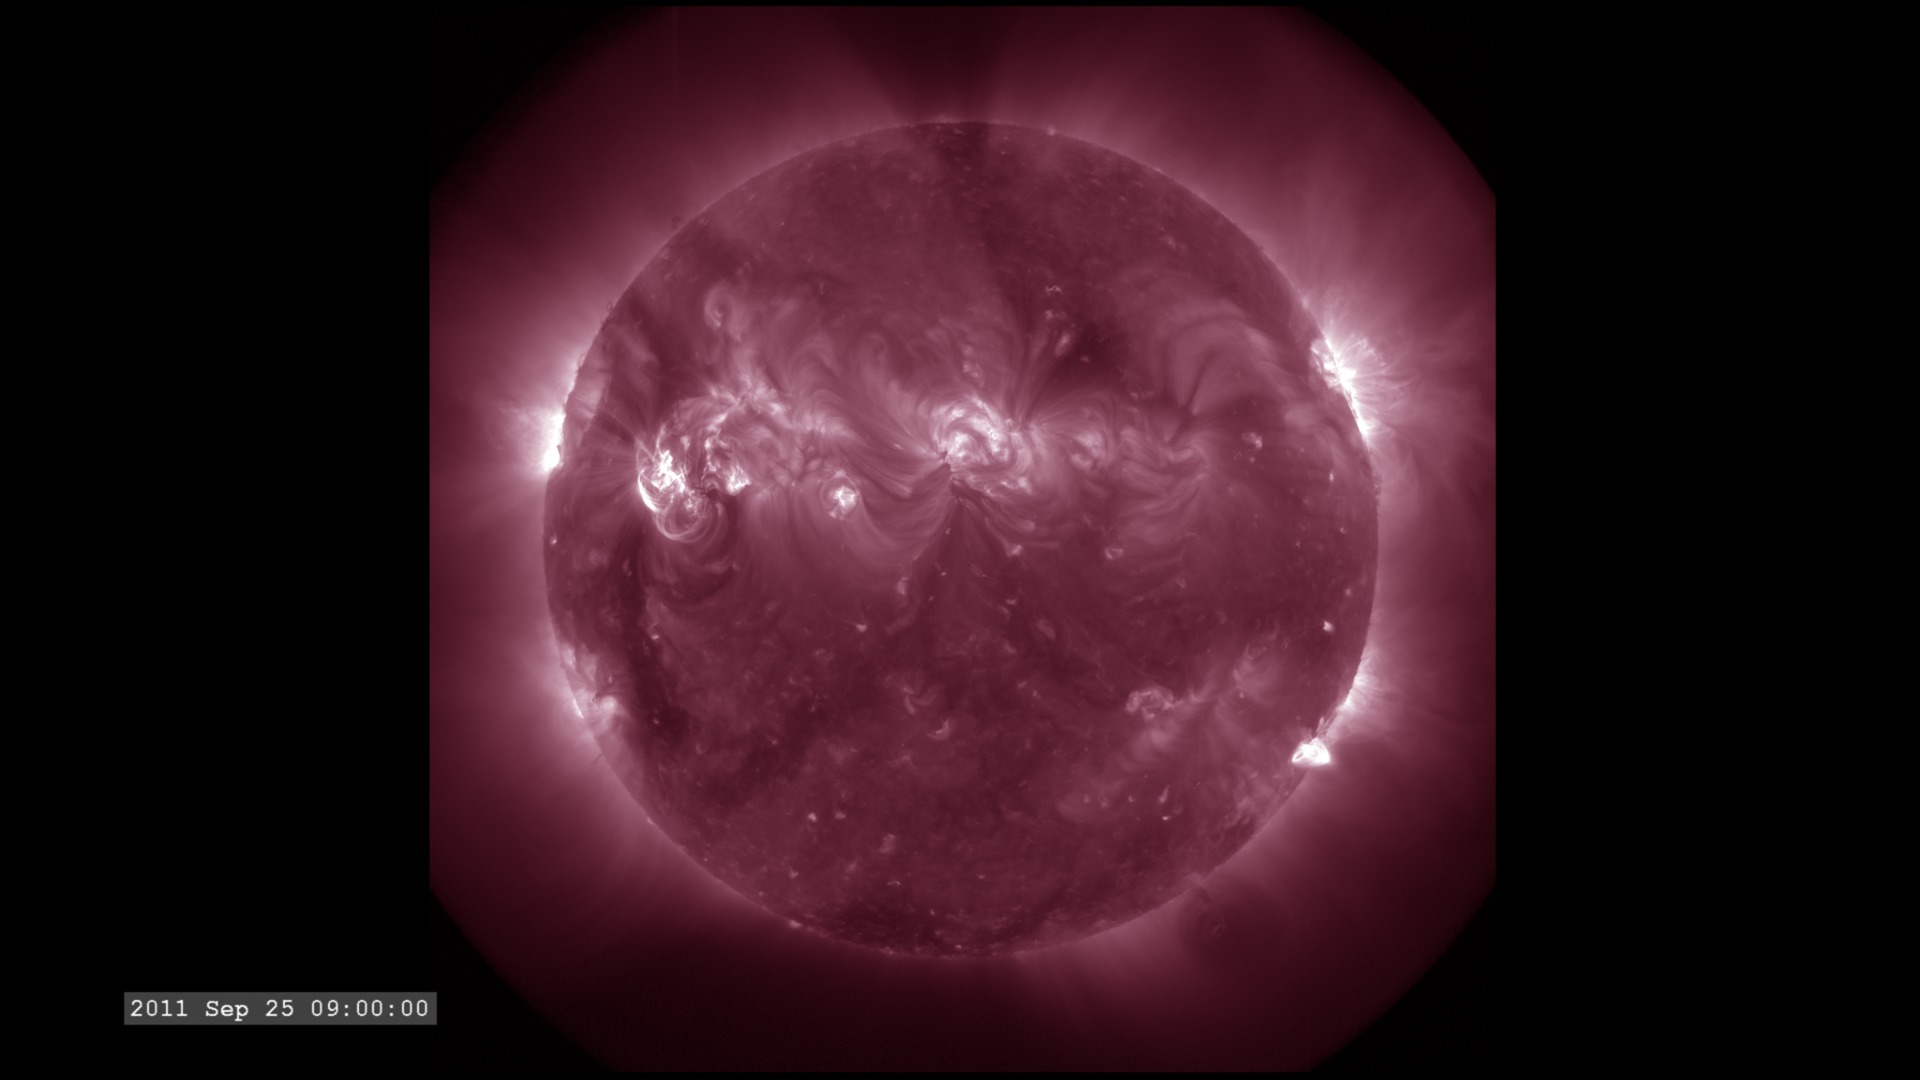
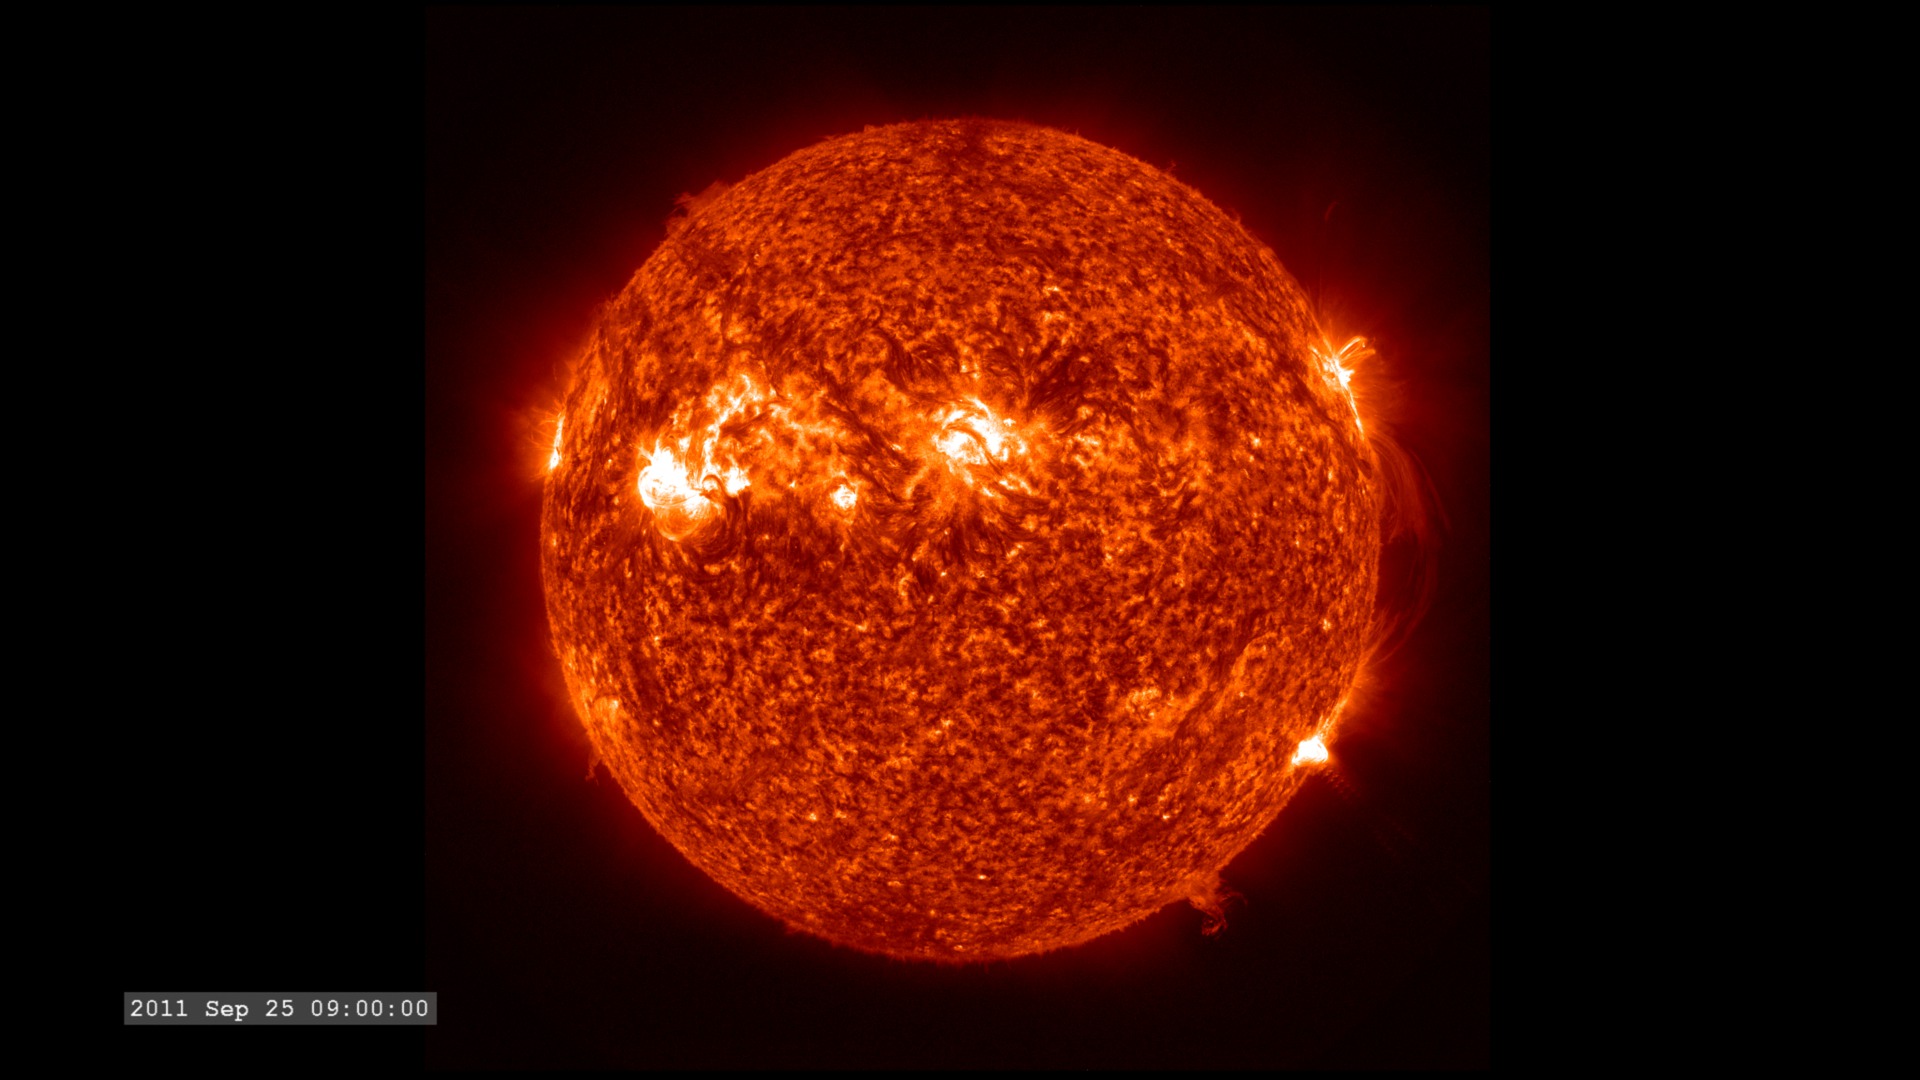
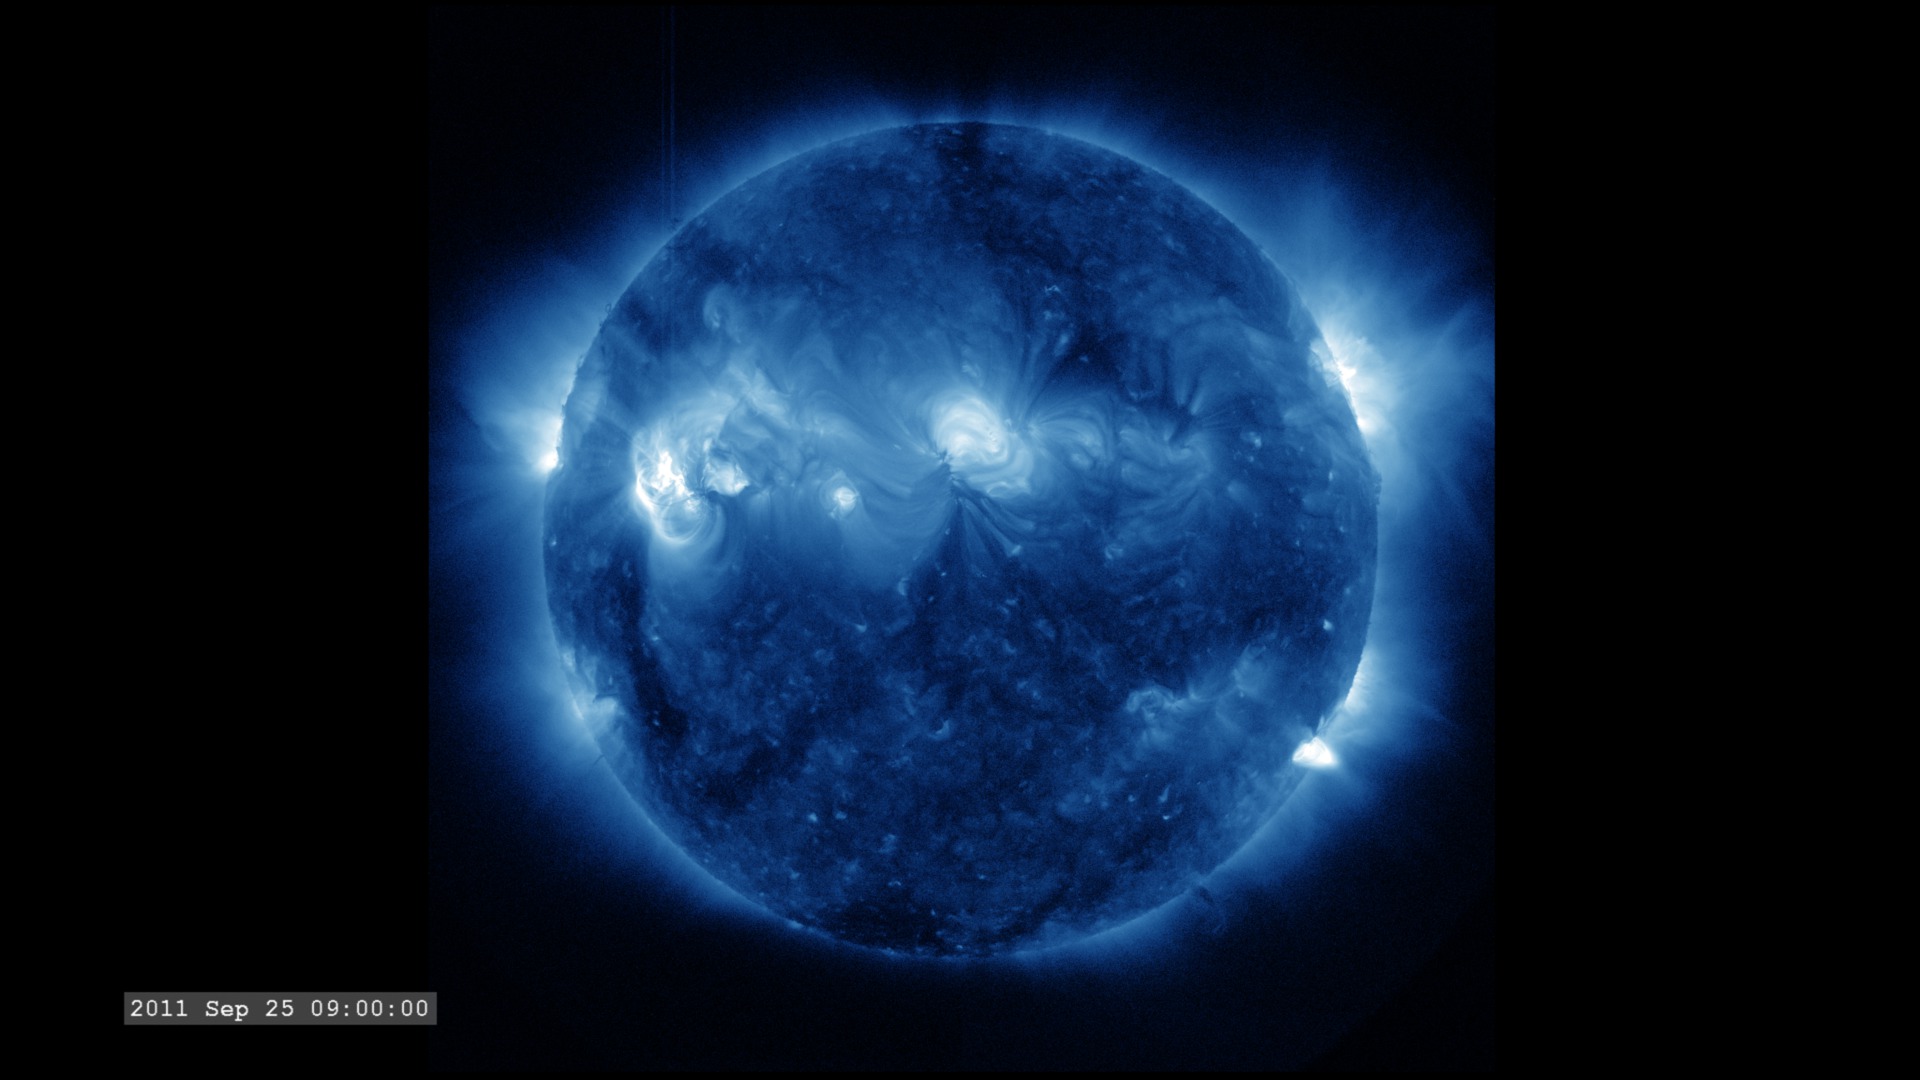
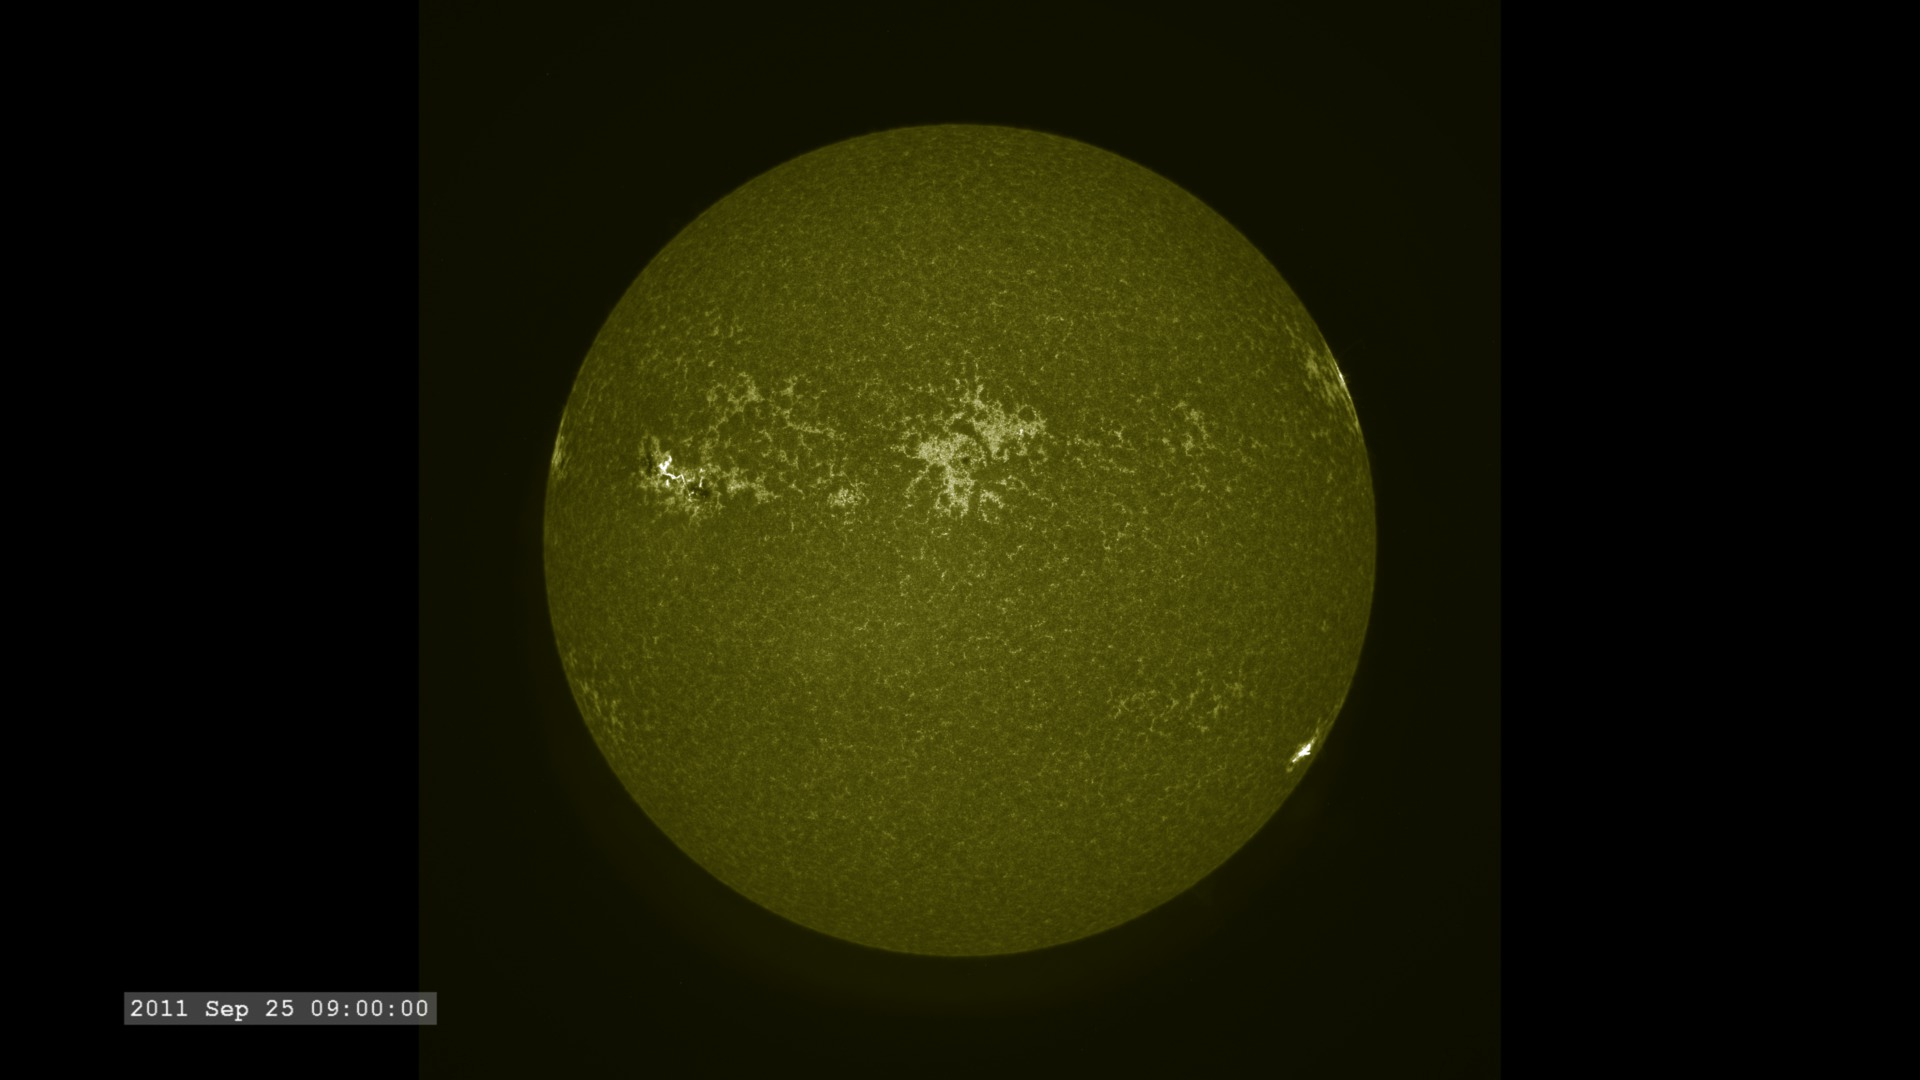
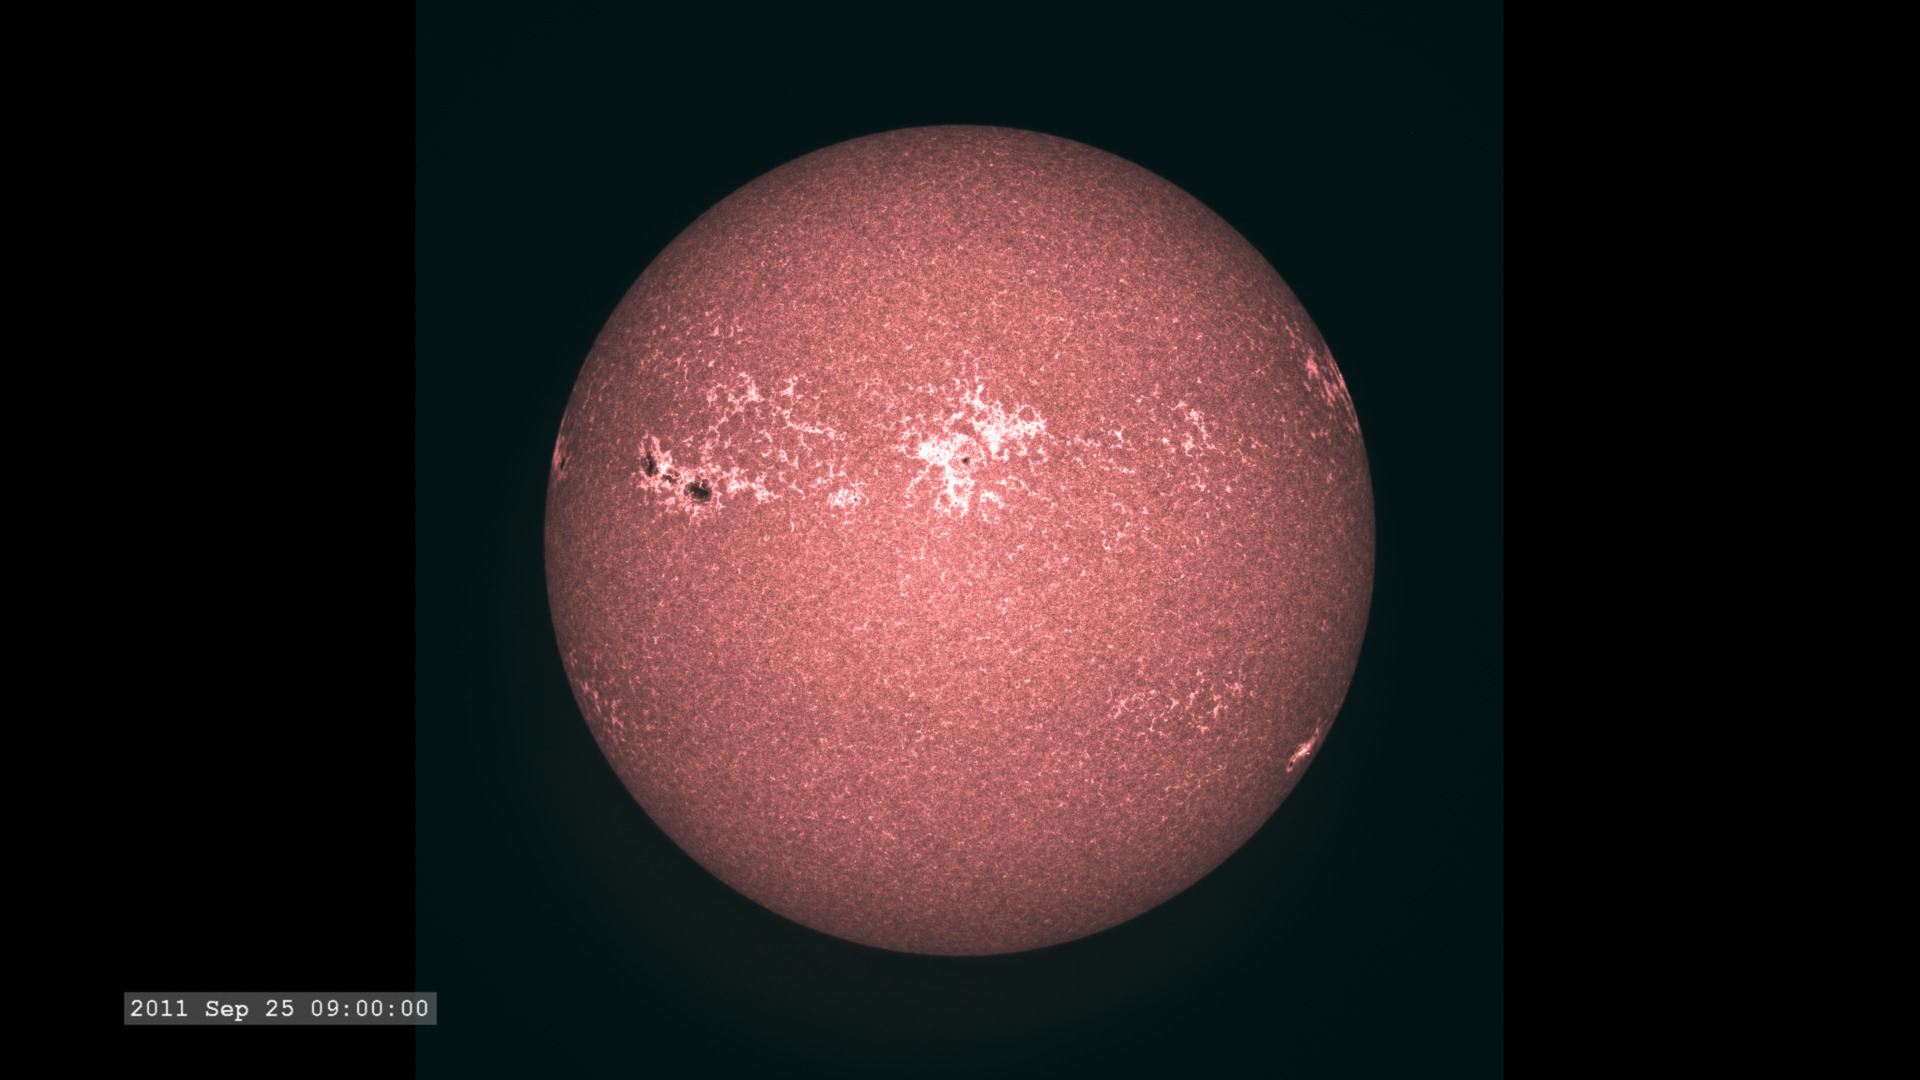
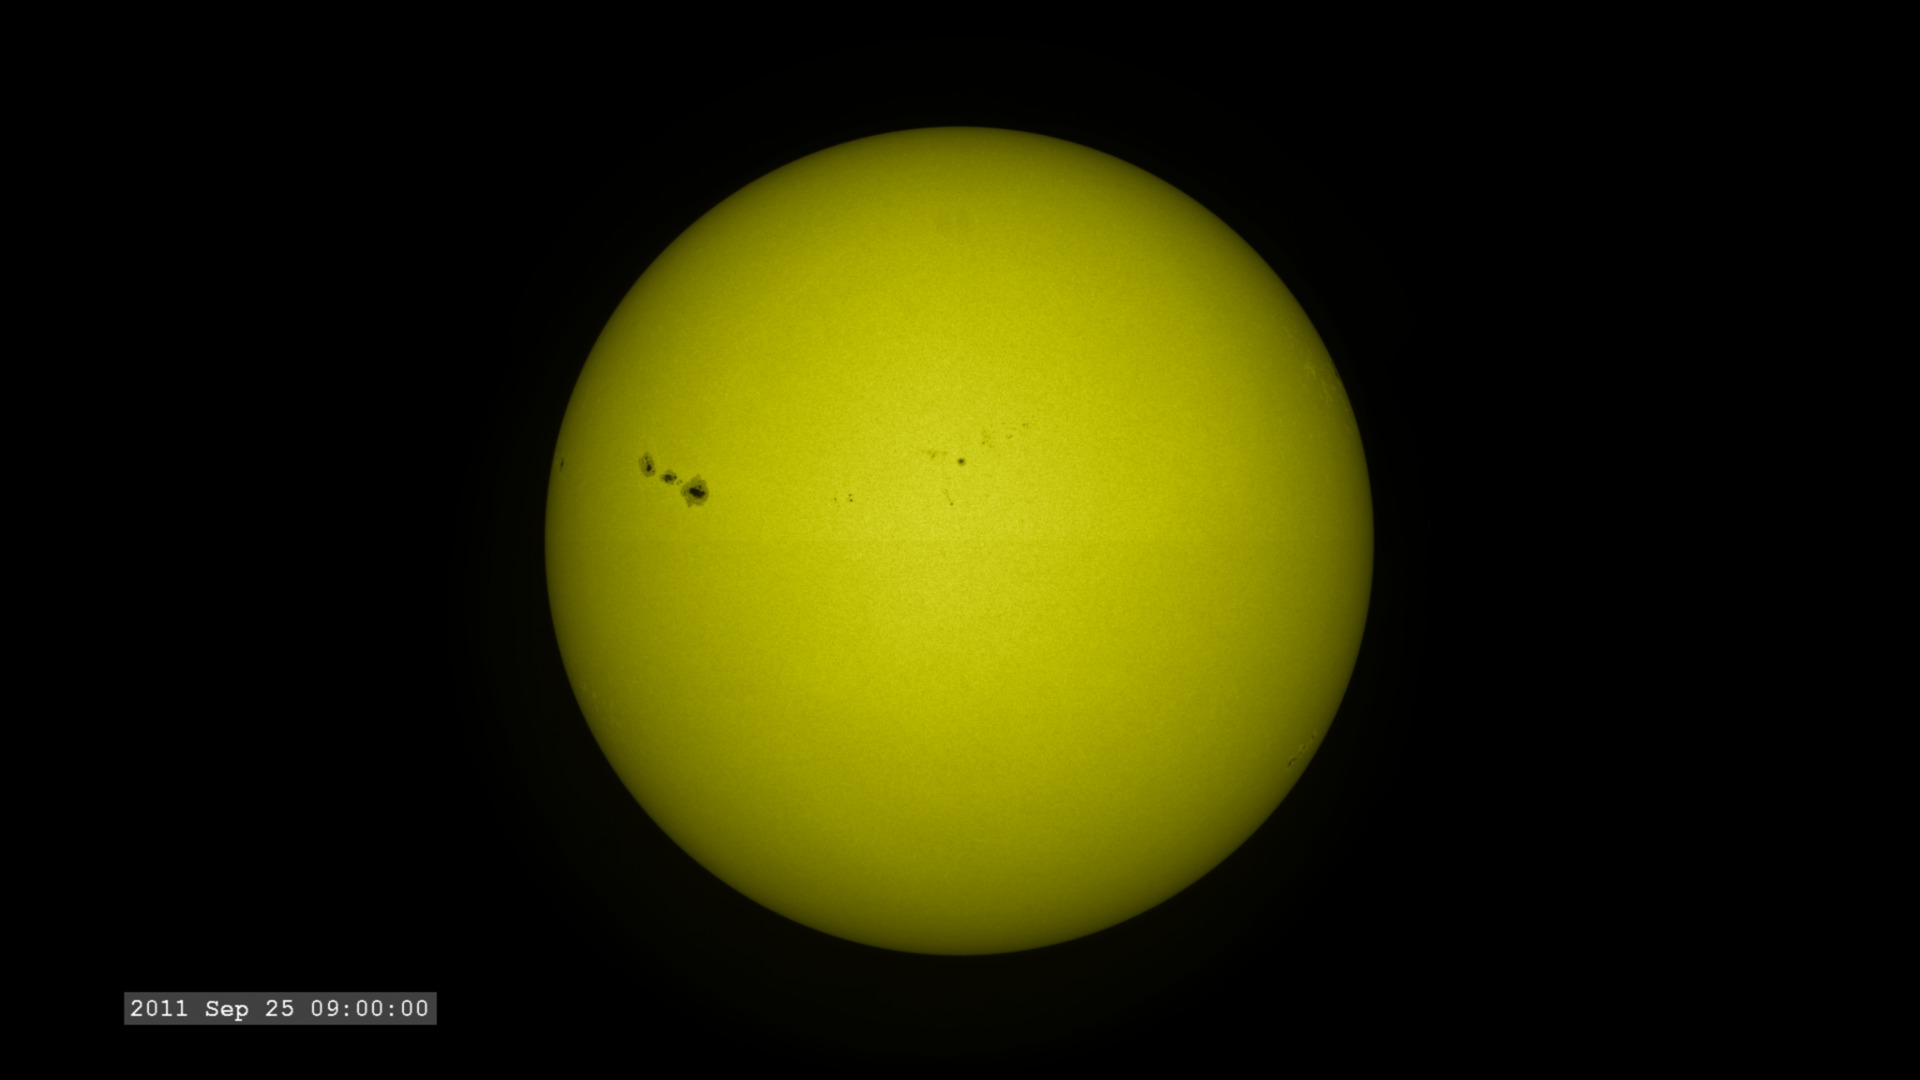
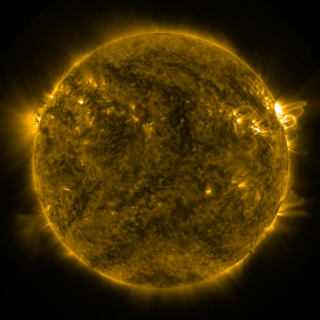
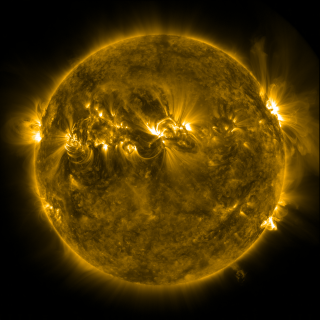
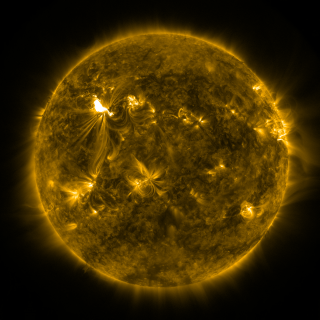
Multi-wavelength Overviews for Solar Dynamics Observatory
Shows highlighting all the multi-wavelength capability of SDO
- ID: 4008
 Visualization
 - ID: 4117
 Visualization
 - ID: 3978
 Visualization
 - ID: 3979
 Visualization
 - ID: 3980
 Visualization
 - ID: 3981
 Visualization
 - ID: 3982
 Visualization
 - ID: 3983
 Visualization
 - ID: 3984
 Visualization
 - ID: 3985
 Visualization
 - ID: 3986
 Visualization
 - ID: 3987
 Visualization
 - ID: 3988
 Visualization
 - ID: 3989
 Visualization
 - ID: 3990
 Visualization
 - ID: 4009
Focus on Solar Features from Solar Dynamics Observatory
- ID: 4027 Visualization
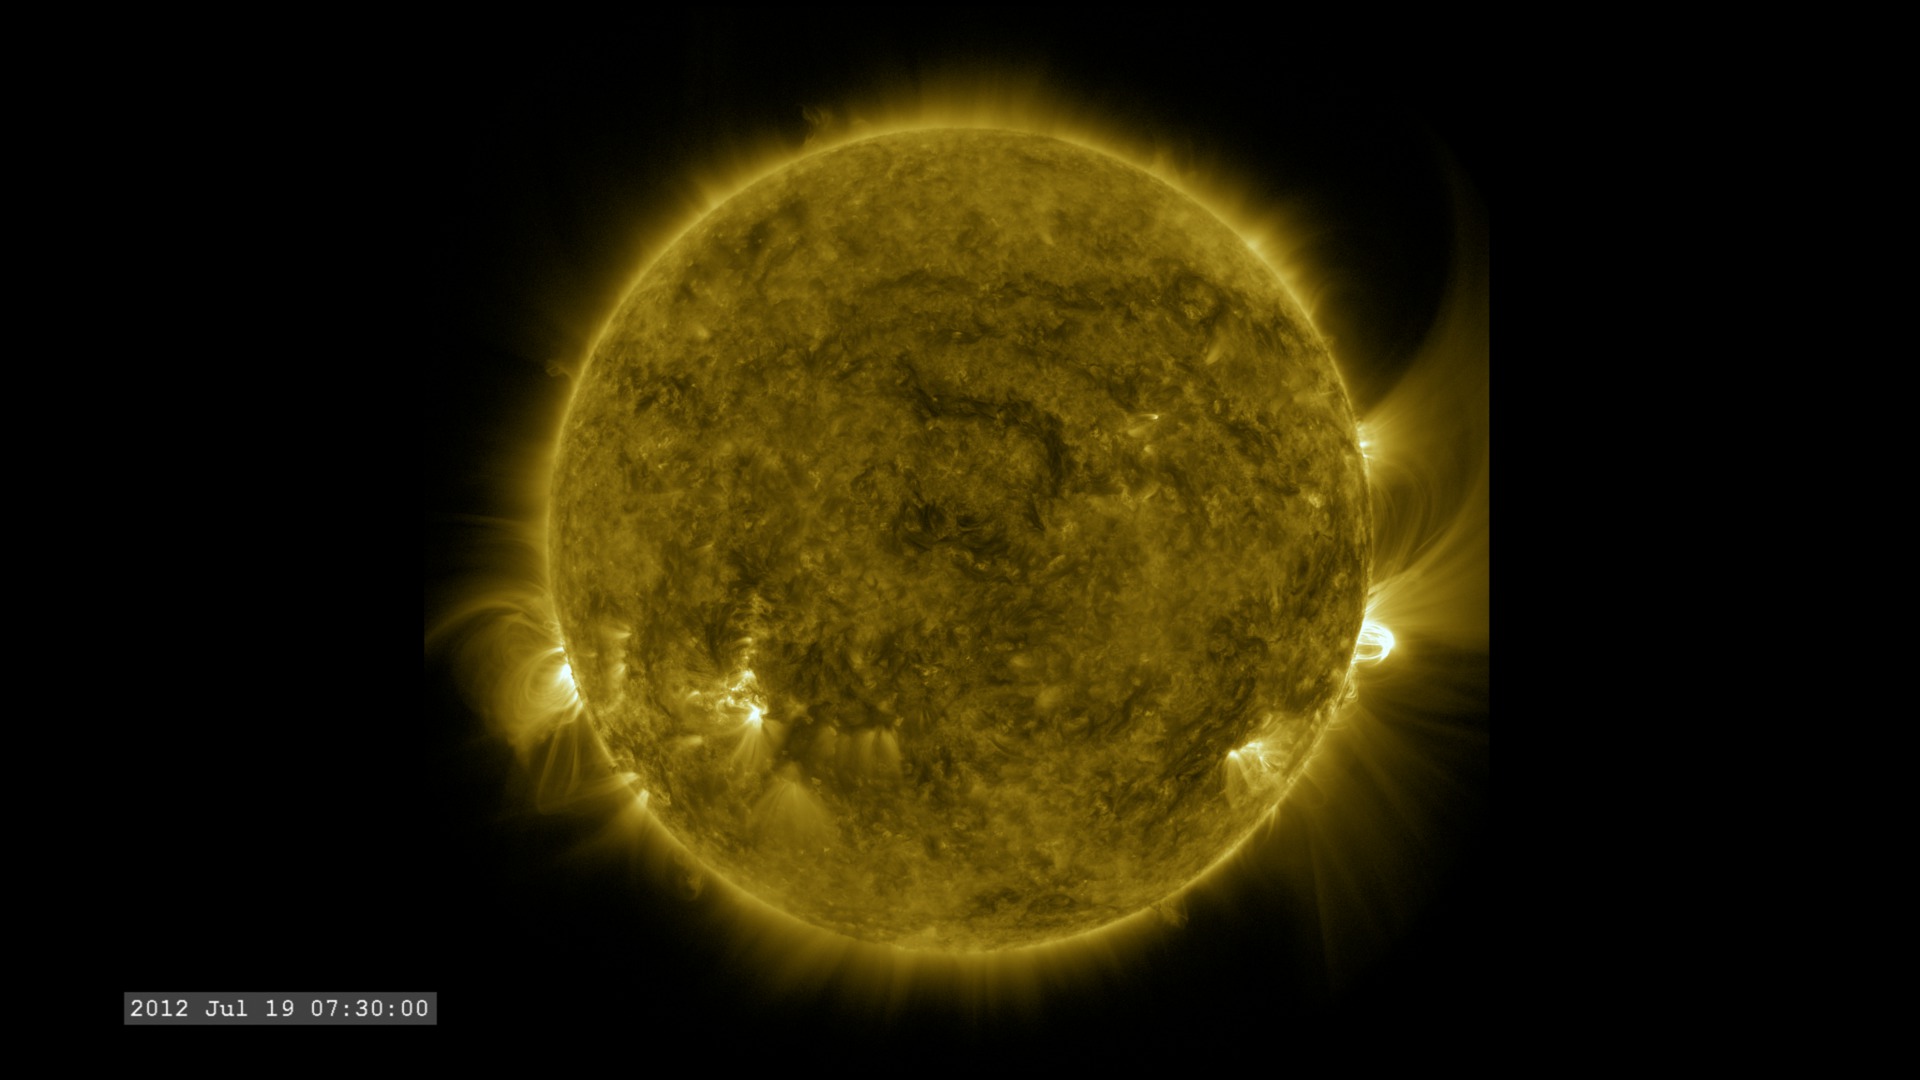
A July 2012 CME from SDO
Go to this pageOn July 18, 2012, a fairly small explosion of light burst off the lower right limb of the sun. Such flares often come with an associated eruption of solar material, known as a coronal mass ejection or CME — but this one did not. Something interesting did happen, however. Magnetic field lines in this area of the sun's atmosphere, the corona, began to twist and kink, generating the hottest solar material — a charged gas called plasma — to trace out the newly-formed slinky shape. The plasma glowed brightly in extreme ultraviolet images from the Atmospheric Imaging Assembly (AIA) aboard NASA's Solar Dynamics Observatory (SDO) and scientists were able to watch for the first time the very formation of something they had long theorized was at the heart of many eruptive events on the sun: a flux rope.Eight hours later, on July 19, the same region flared again. This time the flux rope's connection to the sun was severed, and the magnetic fields escaped into space, dragging billions of tons of solar material along for the ride — a classic CME. ||
- ID: 4037 Visualization
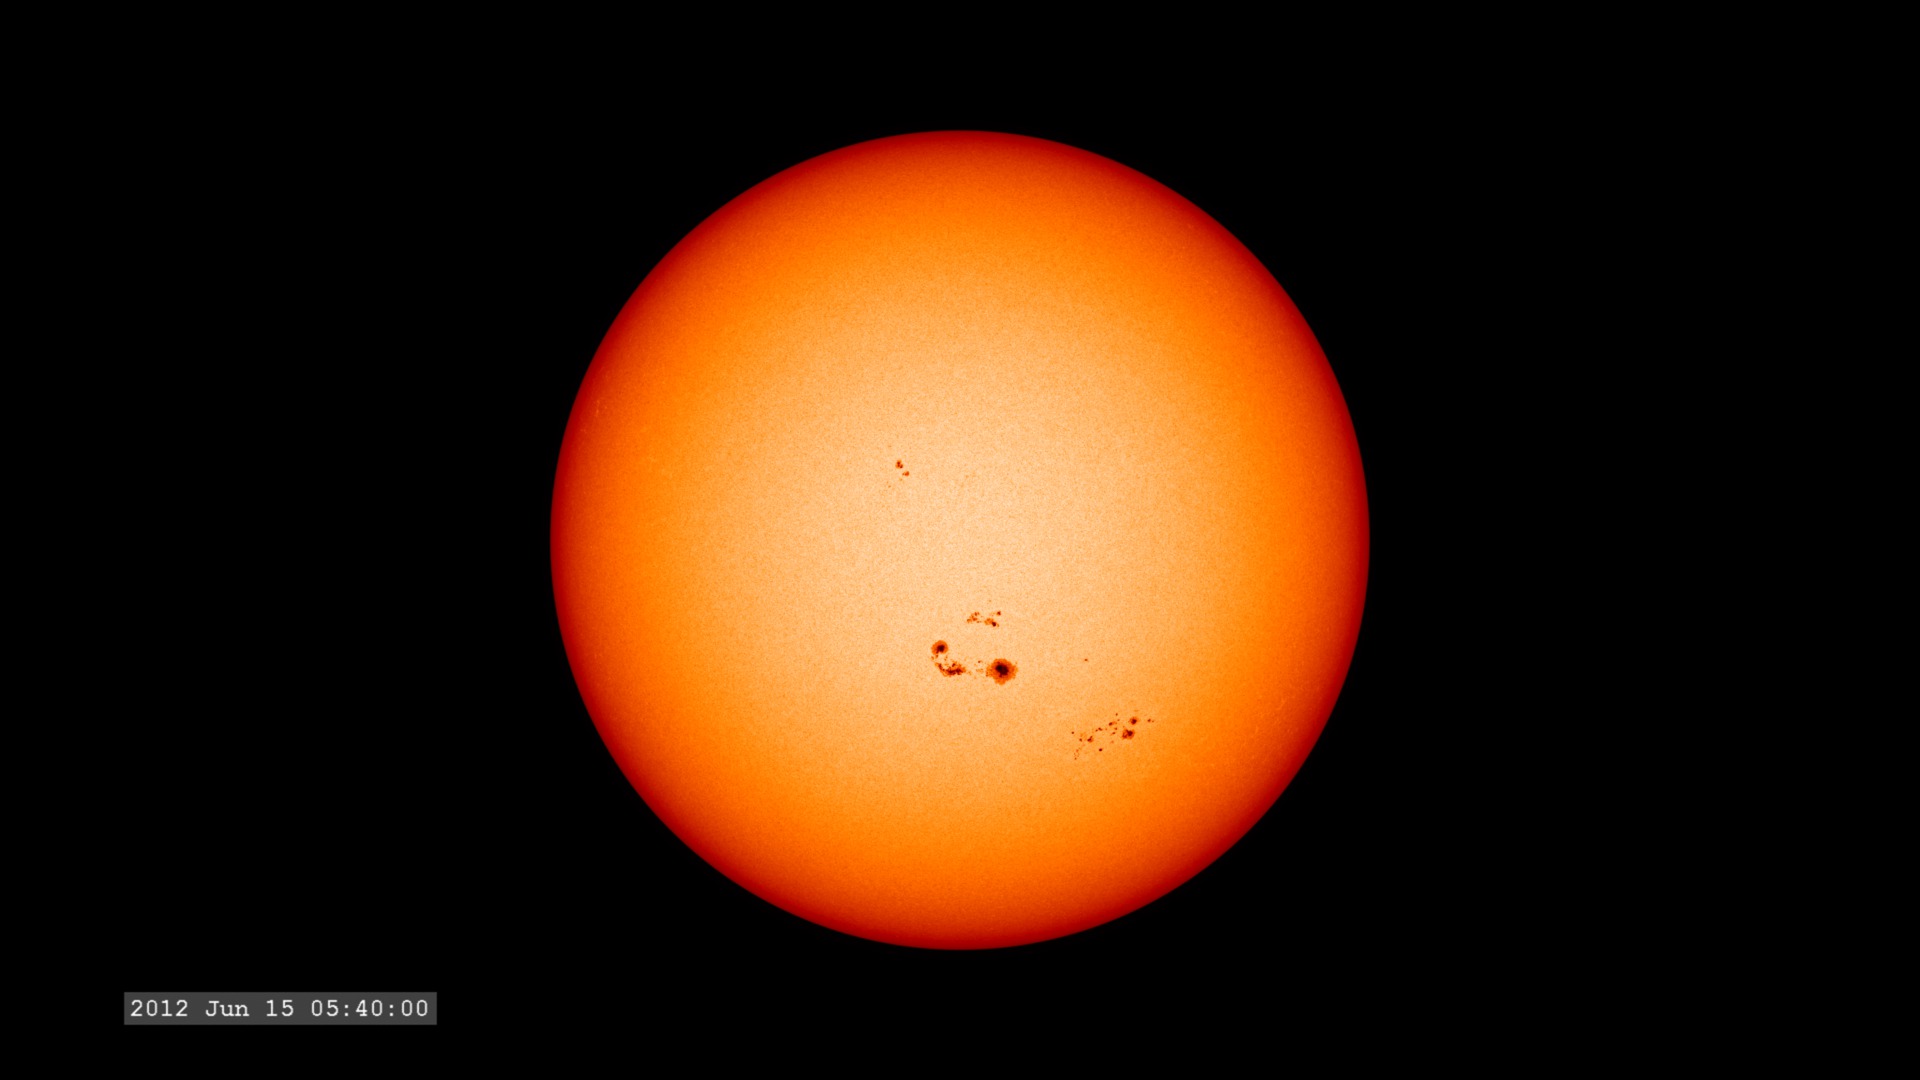
Sunspot Growth in June 2012
Go to this pageGroups of sunspots grow and die over a matter of days. This is a movie built from images taken by the SDO/HMI instrument over the course of 13 days during the rise of solar cycle 24. ||
- ID: 4038 Visualization
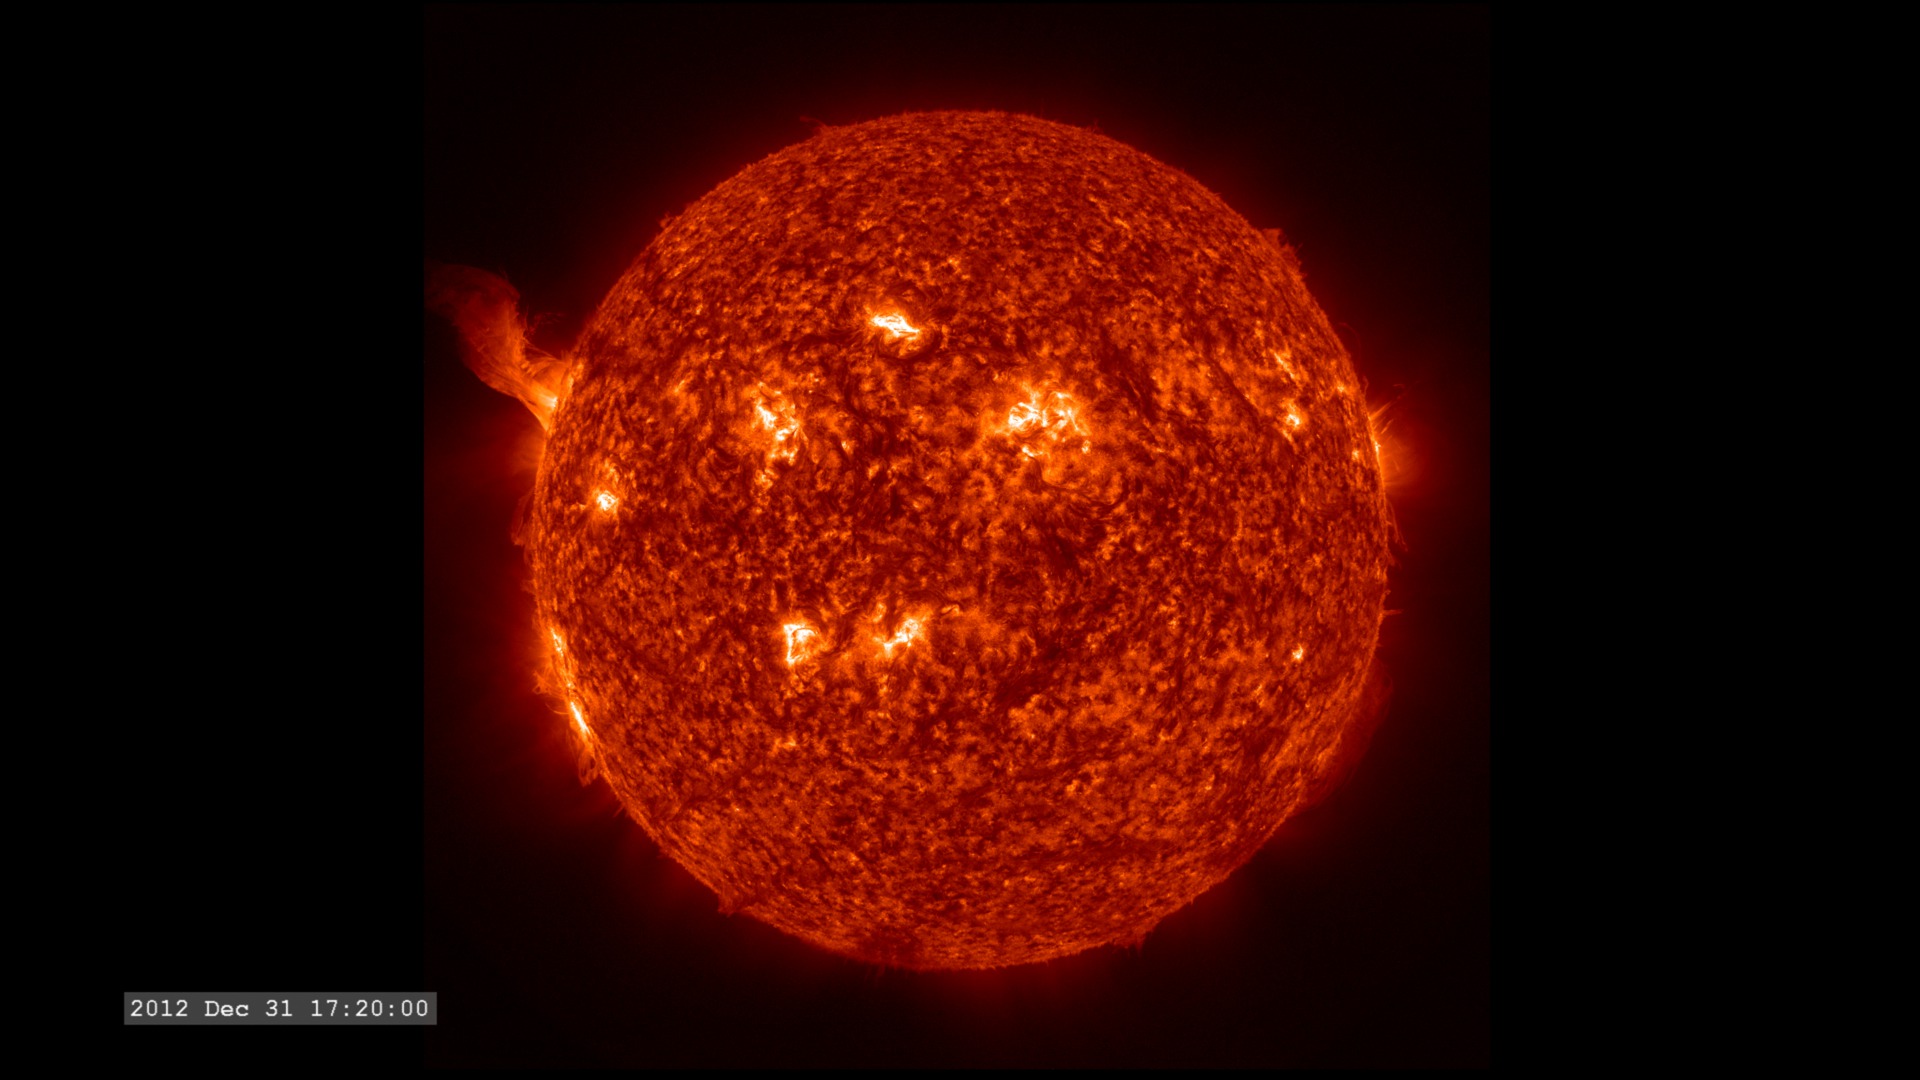
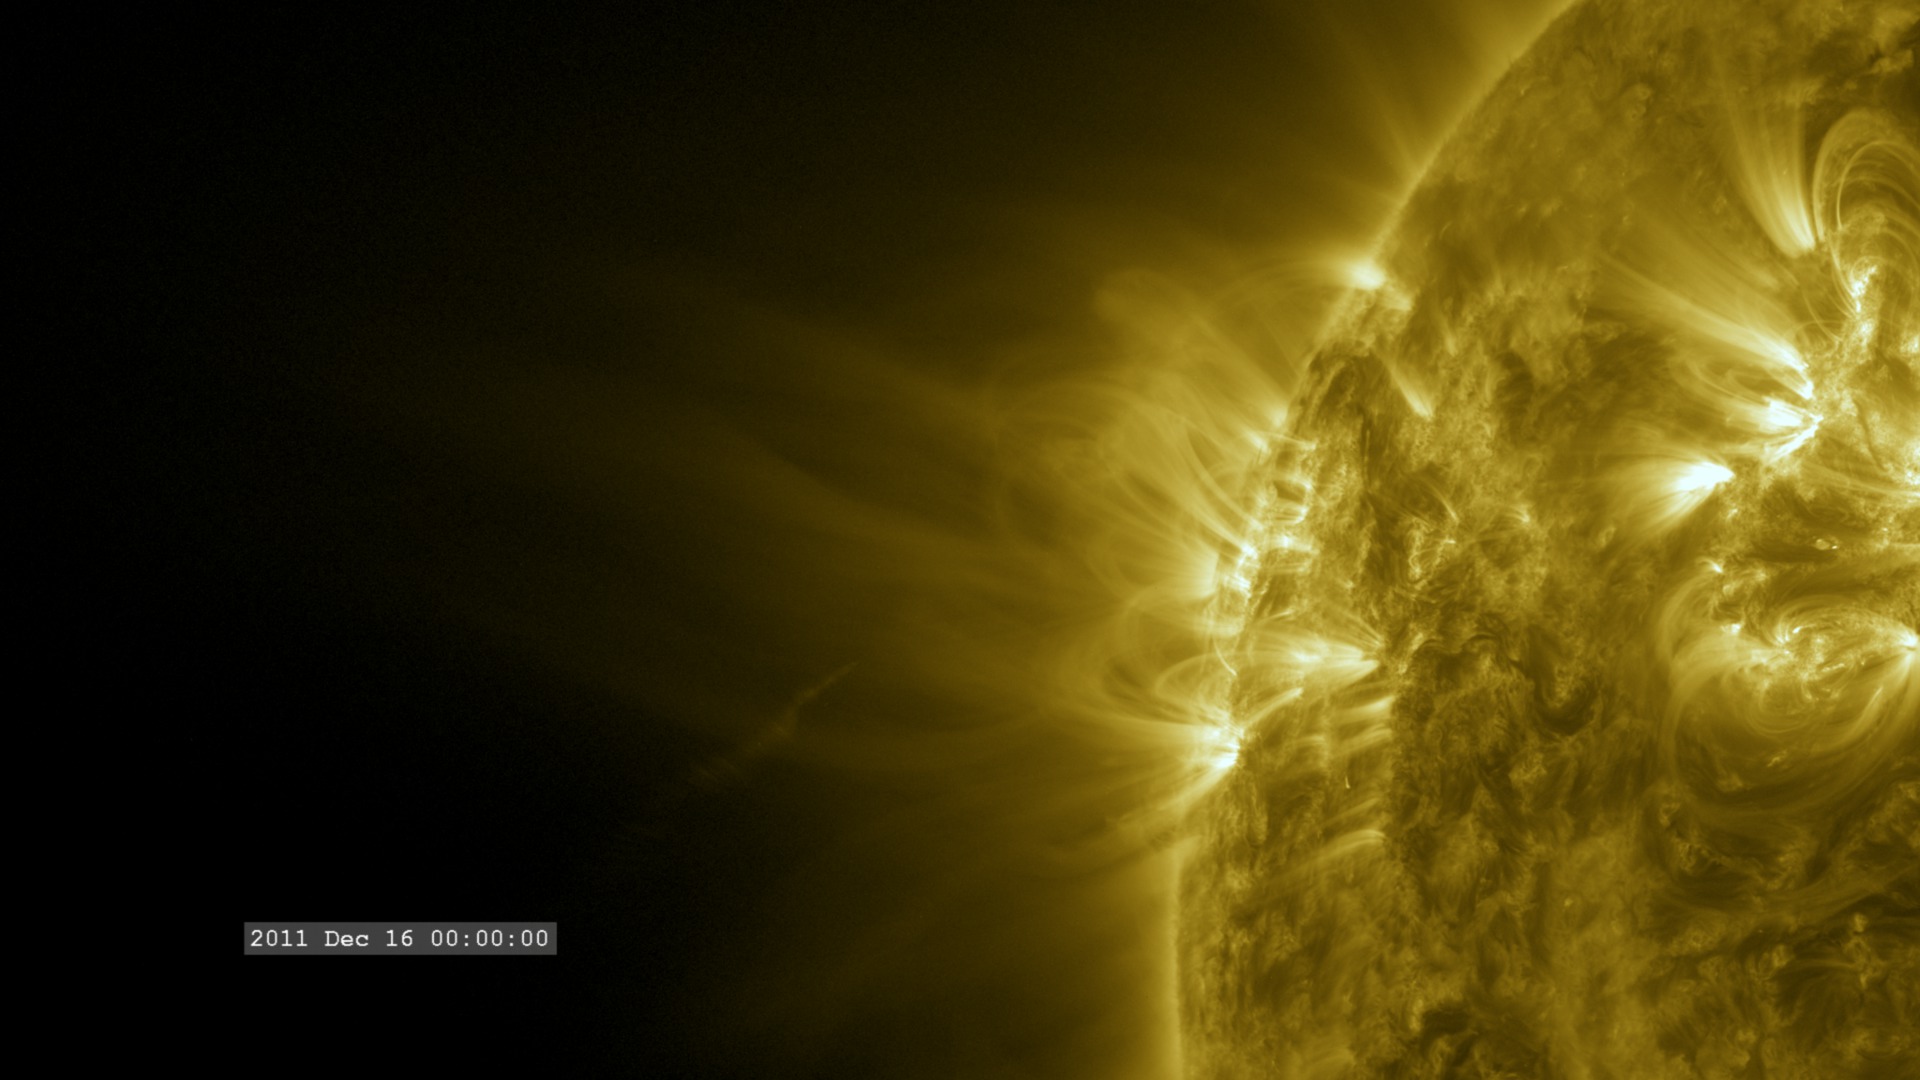
Solar Prominence Dance - December 31, 2012
Go to this pageOn the final day of 2012, the sun presented a beautiful twisting prominence that rose high into the corona for about 3 hours. It was most visible in extreme ultraviolet light with a wavelength of 304 angstroms. This wavelength highlights plasma with temperatures of around 50,000 Kelvin. The Atmospheric Imaging Assembly on NASA's Solar Dynamics Observatory captured the event at 4k resolution and a high imaging cadence of one image every 12 seconds. ||
- ID: 3828 Visualization
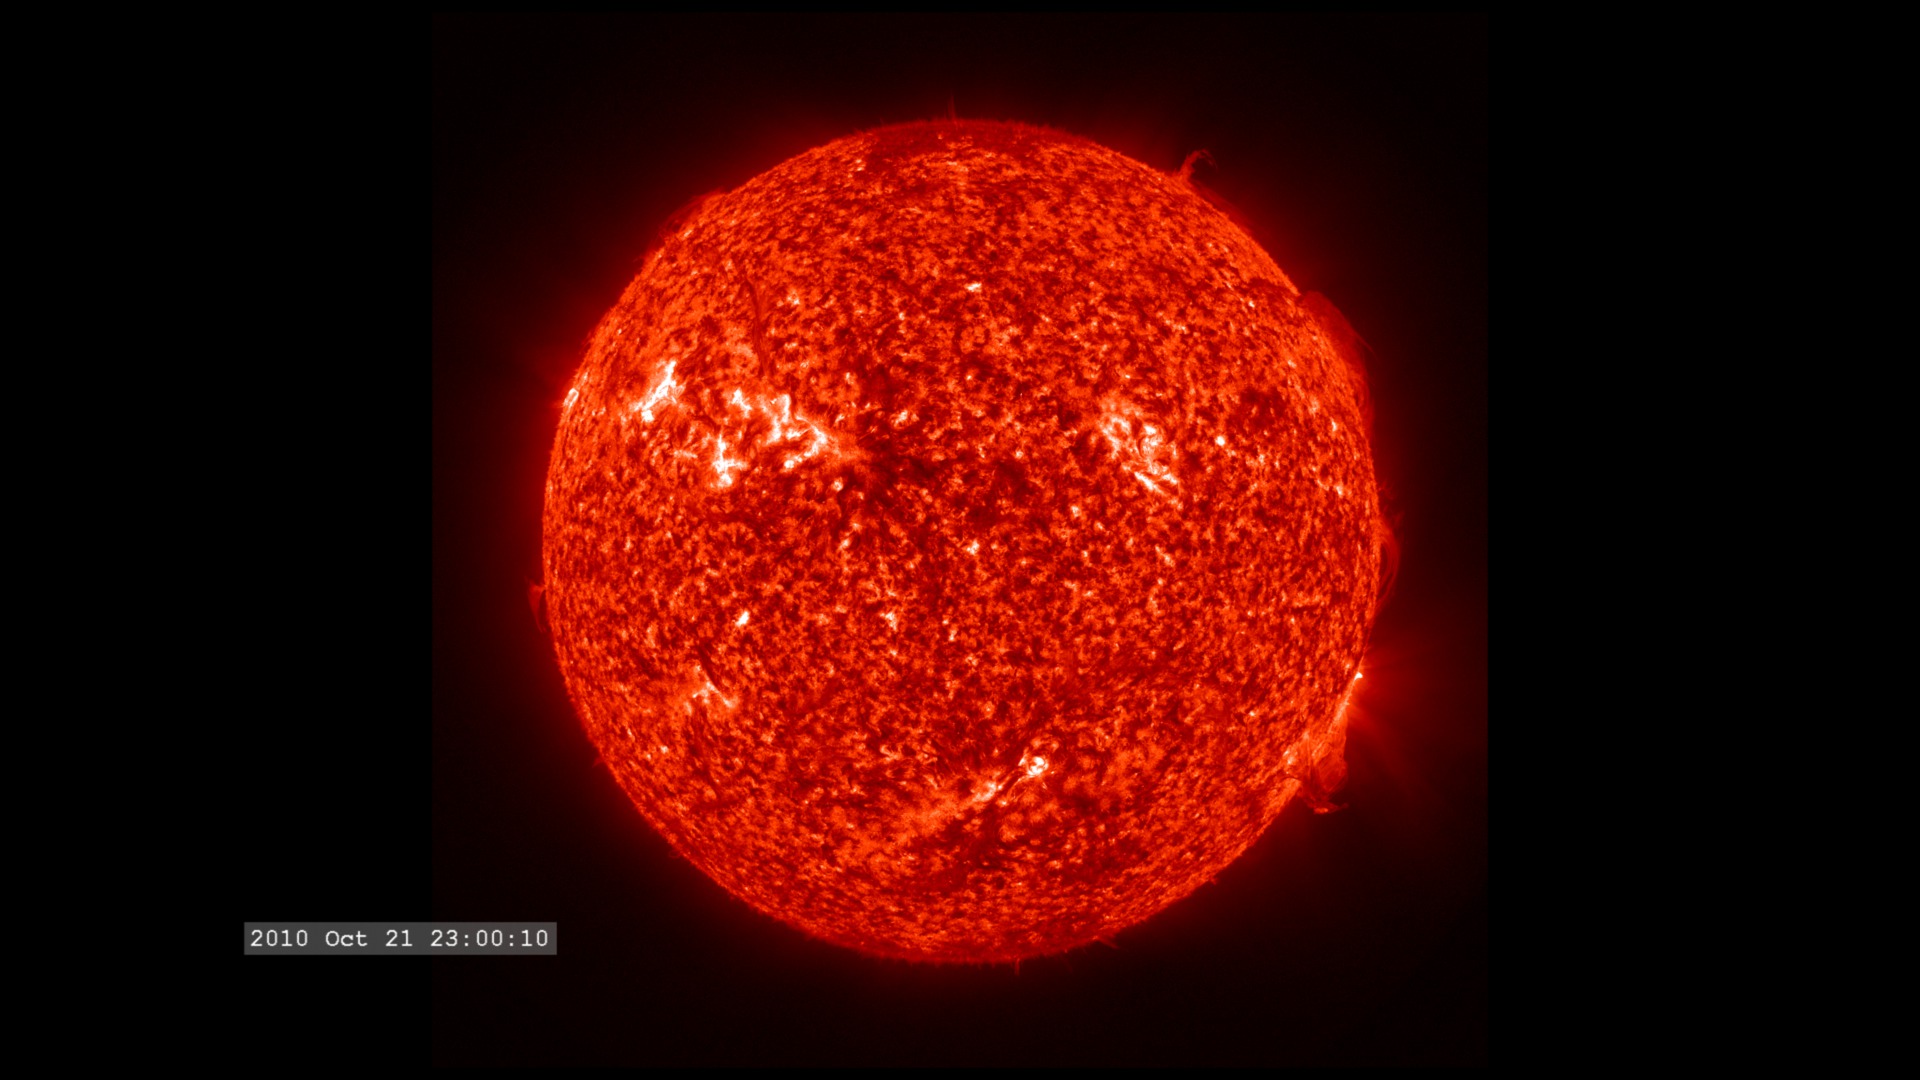
Solar Dynamics Observatory - Atmospheric Imaging Assembly
Go to this pageThe Sun's activity increases as we enter solar cycle 24. But even several years away from the peak, the Sun in ultraviolet light shows a variety of activity.This visualization consists of eight hours of SDO AIA imagery from the 30.4 nanometer filter (304 Ångstroms). This sequence plays at the full time cadence of the AIA instrument - one image every twelve seconds of real time - and showing thirty images per second on playback. ||
- ID: 3919 Visualization
Solar Tornados as Seen by SDO (February 7, 2012)
Go to this pageA tornado-like structure is observed coming over the limb of the Sun (upper left quadrant) by SDO. ||
- ID: 3955 Visualization
Wispy 'Plasma Dancer' on the limb of the Sun
Go to this pageThis movie actually exhibits a number of interesting solar phenomena.The primary feature of interest was the whirrling tower of plasma on the lower right limb. ||
- ID: 3897 Visualization
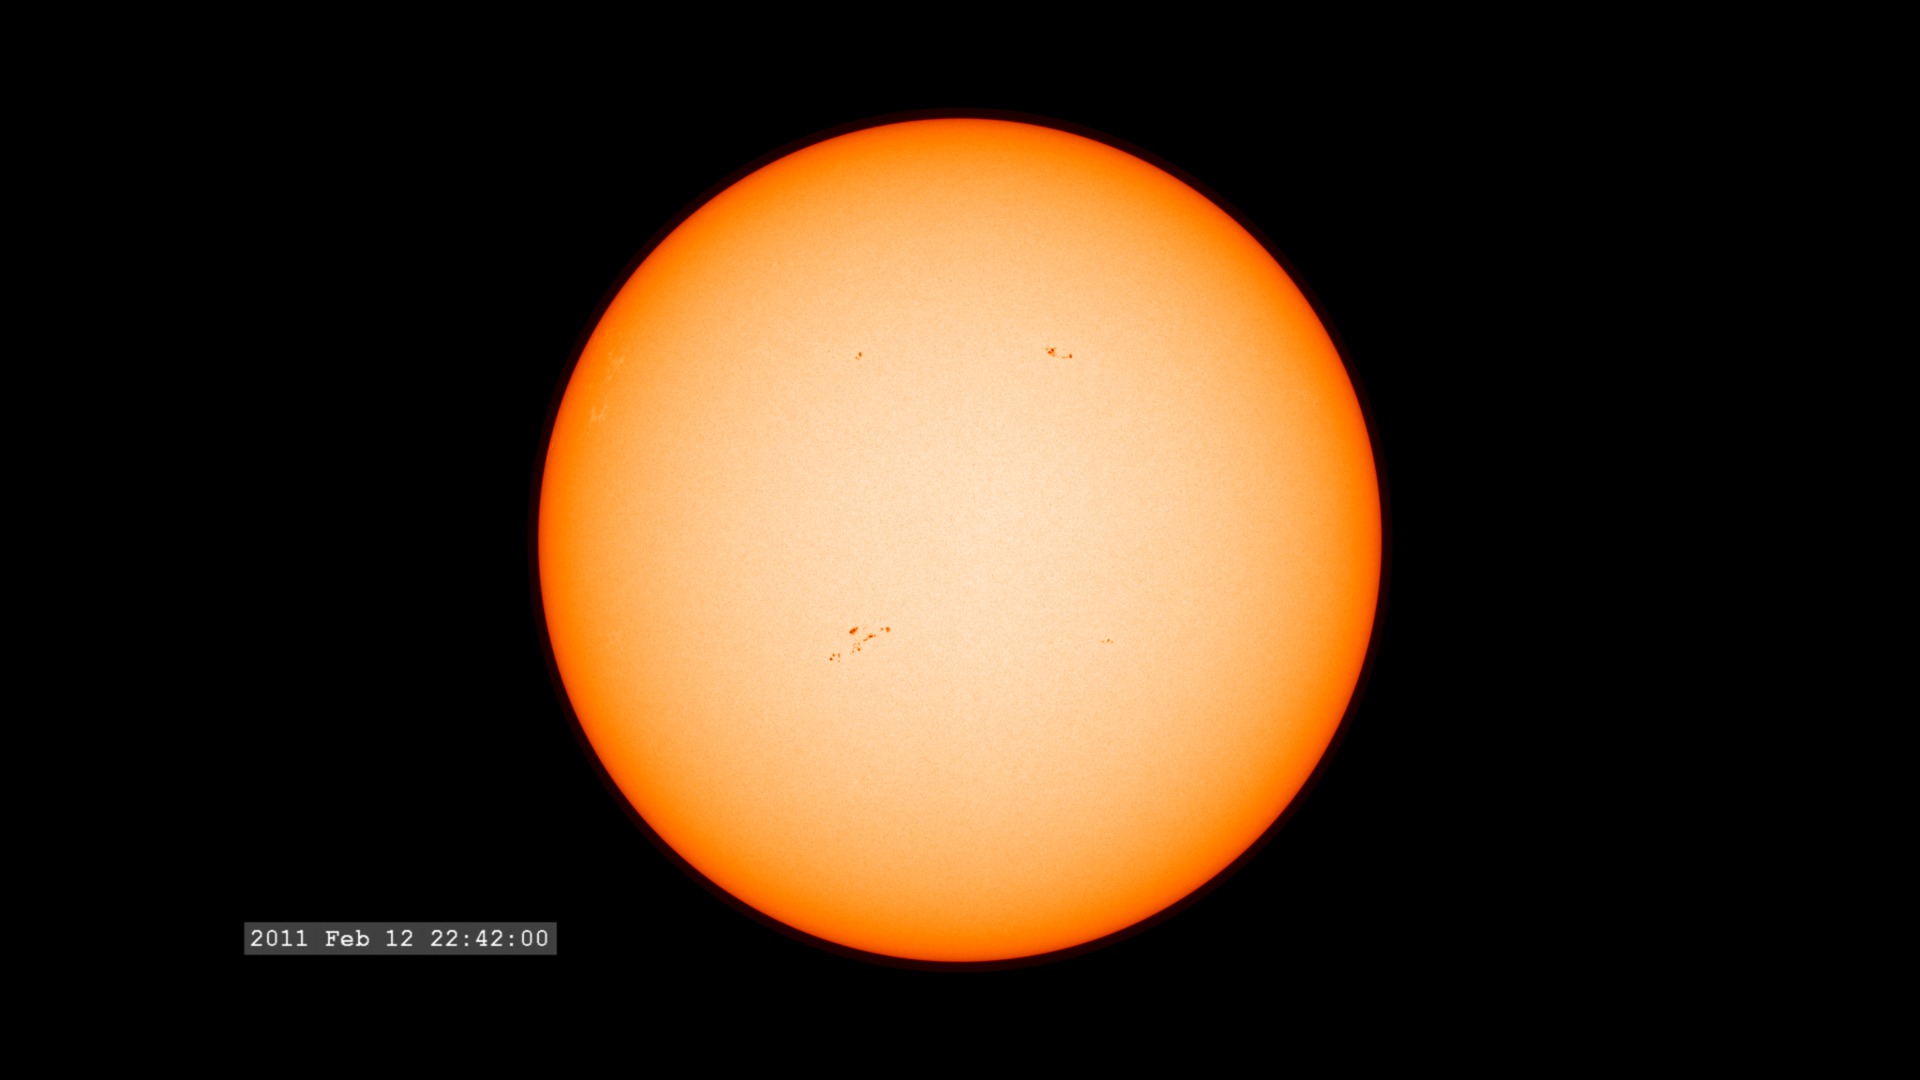
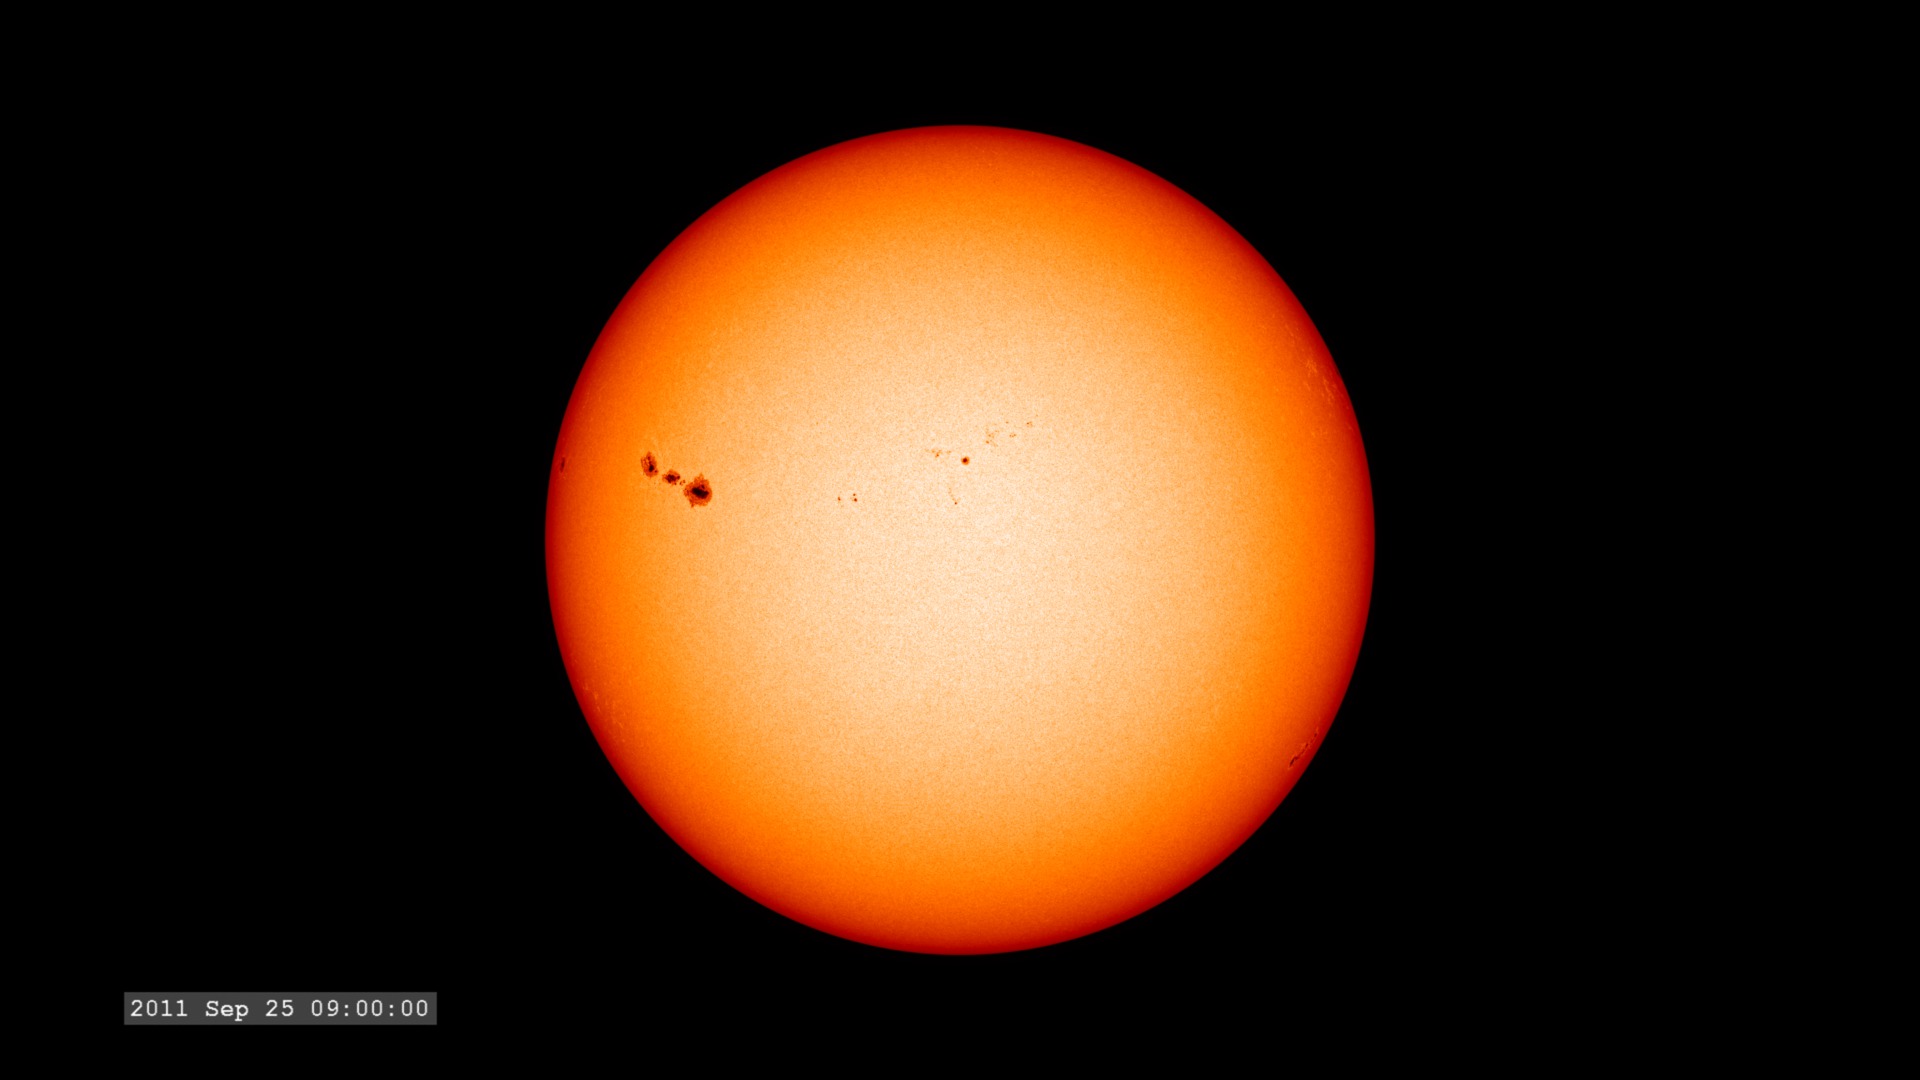
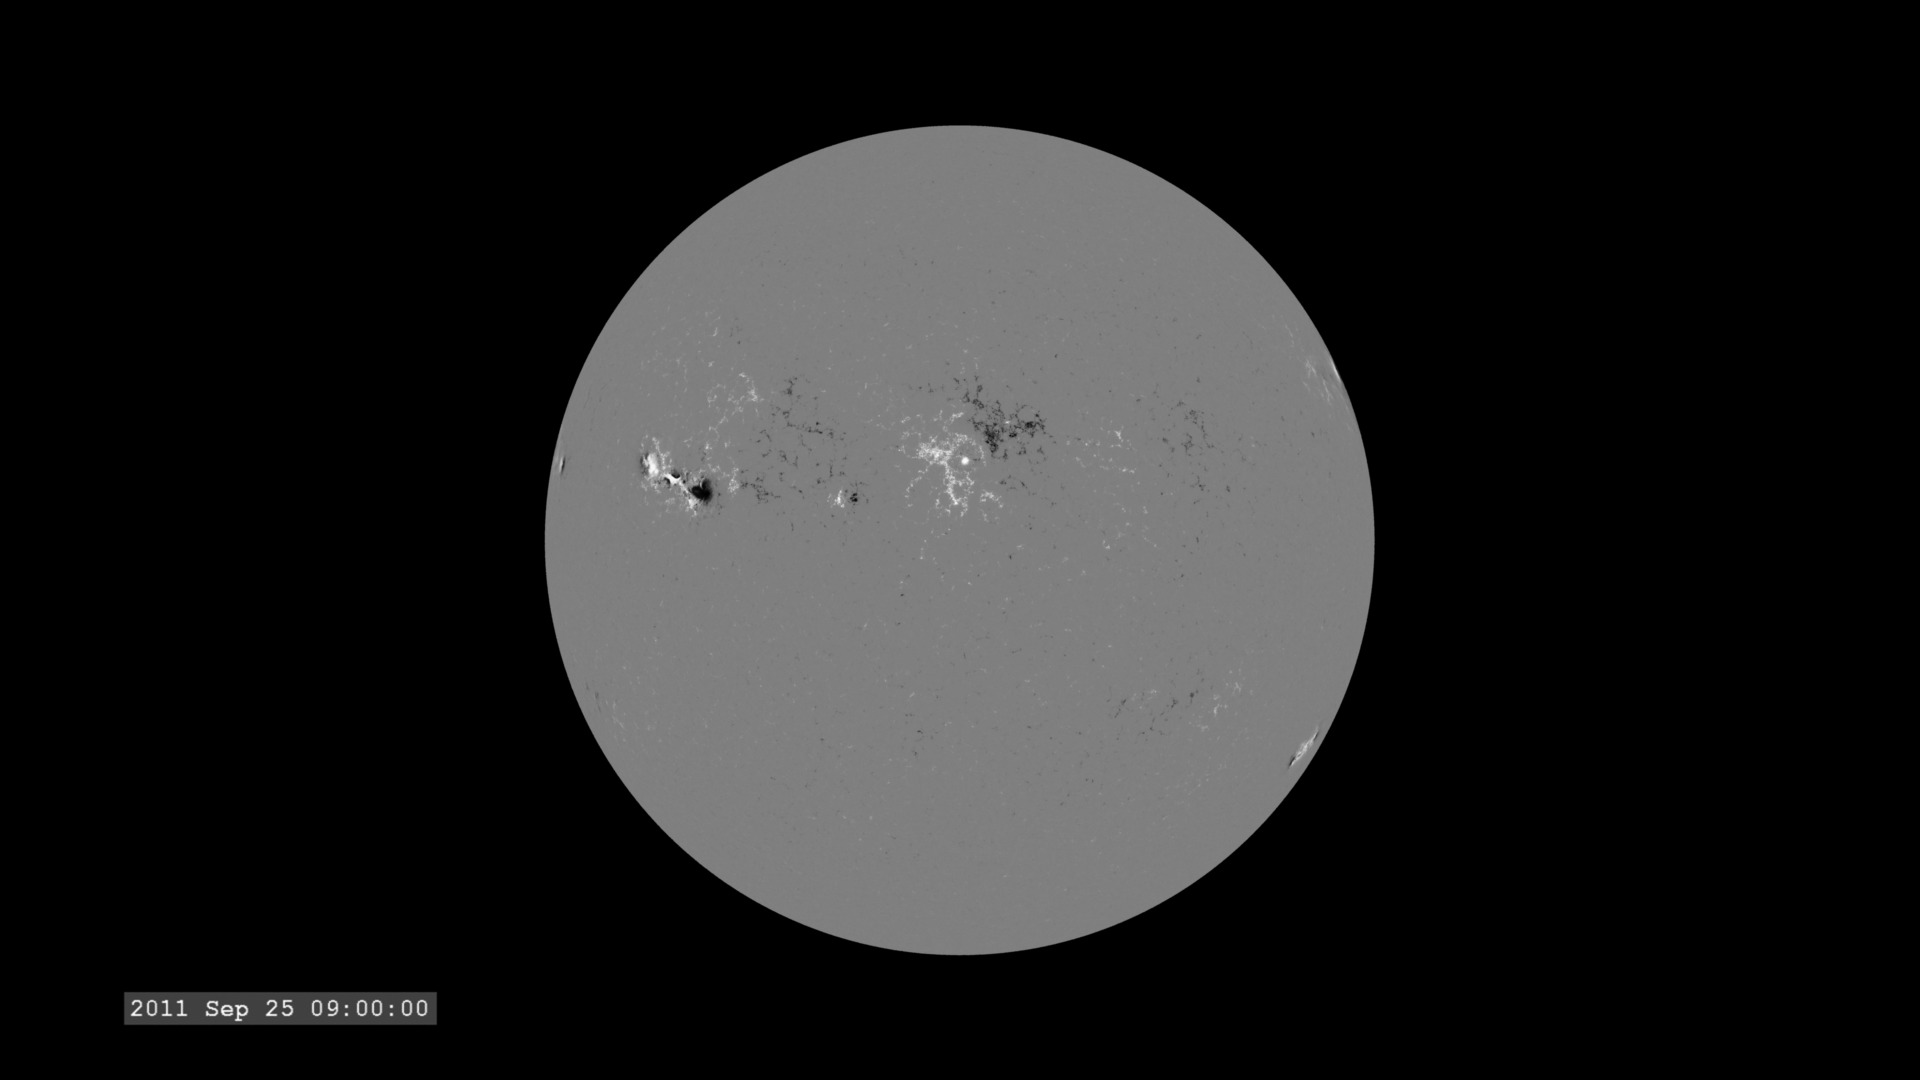
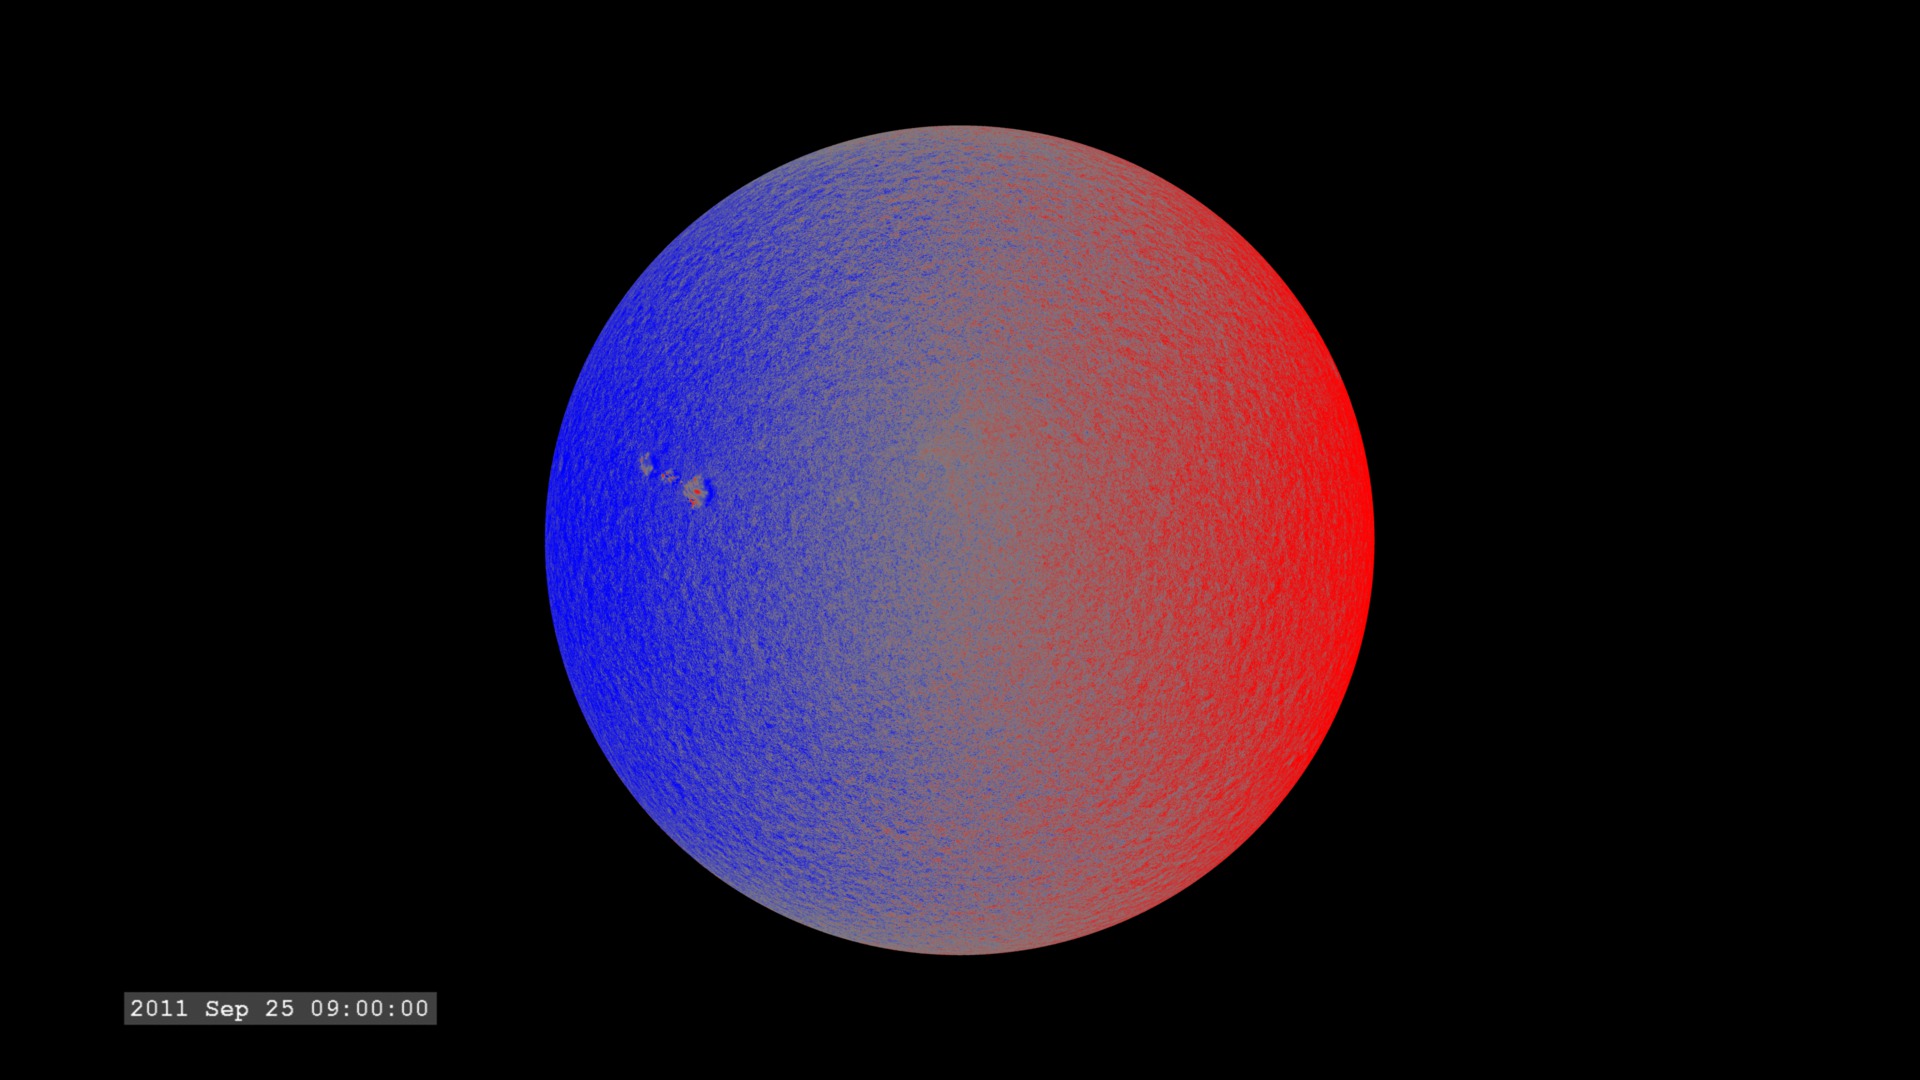
Growing Sunspots - A Full Disk View: February 2011
Go to this pageHere is a leisurely view of SDO/HMI data, sampled every hour, covering two weeks in the middle of February 2011. While the solar disk starts out featureless, eventually small groups of sunspots (the darker regions) emerge, grow, and then rotate out of view.For a closeup view of of one of these sunspot groups, see animation 3898, Growing Sunspots - Tracking Closeup: February 2011 ||
- ID: 4026 Visualization
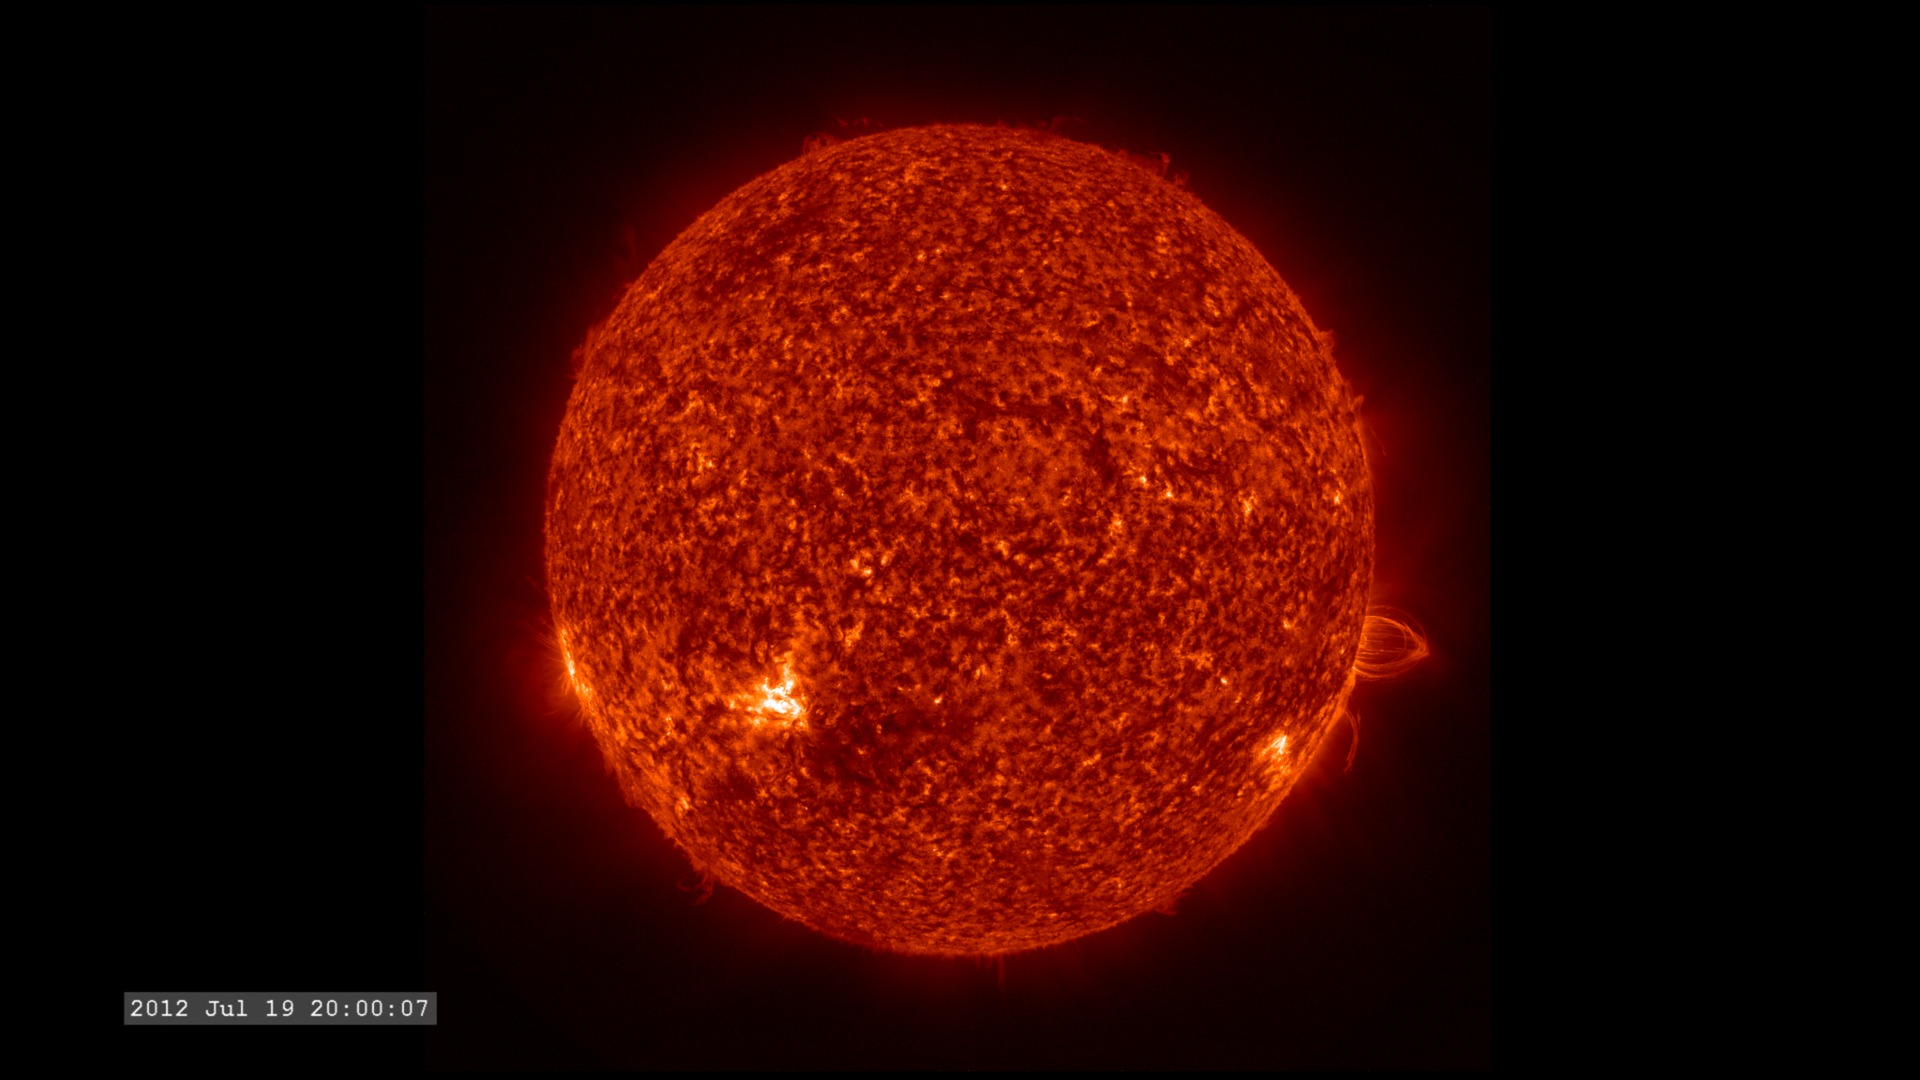
July 2012: Coronal Rain
Go to this pageA moderate solar flare was emitted by the sun on July 19, 2012. At 5:58 UTC it peaked at M7.7 on the flare scale, which makes it fairly powerful, but still much weaker than X-class flares, which are the largest. What made this particular event so noteworthy was the associated activity in the sun's corona. For the next day, hot plasma in corona cooled and condensed along the strong magnetic fields of the region that produced the flare. Magnetic fields are invisible, but the plasma is very obvious in the extreme ultraviolet wavelength of 304 angstroms, which highlights material at a temperature of about 50,000 Kelvin. This plasma is attracted to the magnetic fields and outlines them very clearly as it slowly falls back to the solar surface. This process of condensing plasma falling to the surface is called coronal rain.The footage in this video was collected by the Solar Dynamics Observatory's AIA instrument. SDO collected one frame every 12 seconds so each second in this video corresponds to 6 minutes of real time. The video covers 4:30 UTC on July 19th to 2:00 UTC on July 20th, a period of 21 hours and 30 minutes.Music—"Thunderbolt" by Lars Leonhard ||
- ID: 3920 Visualization
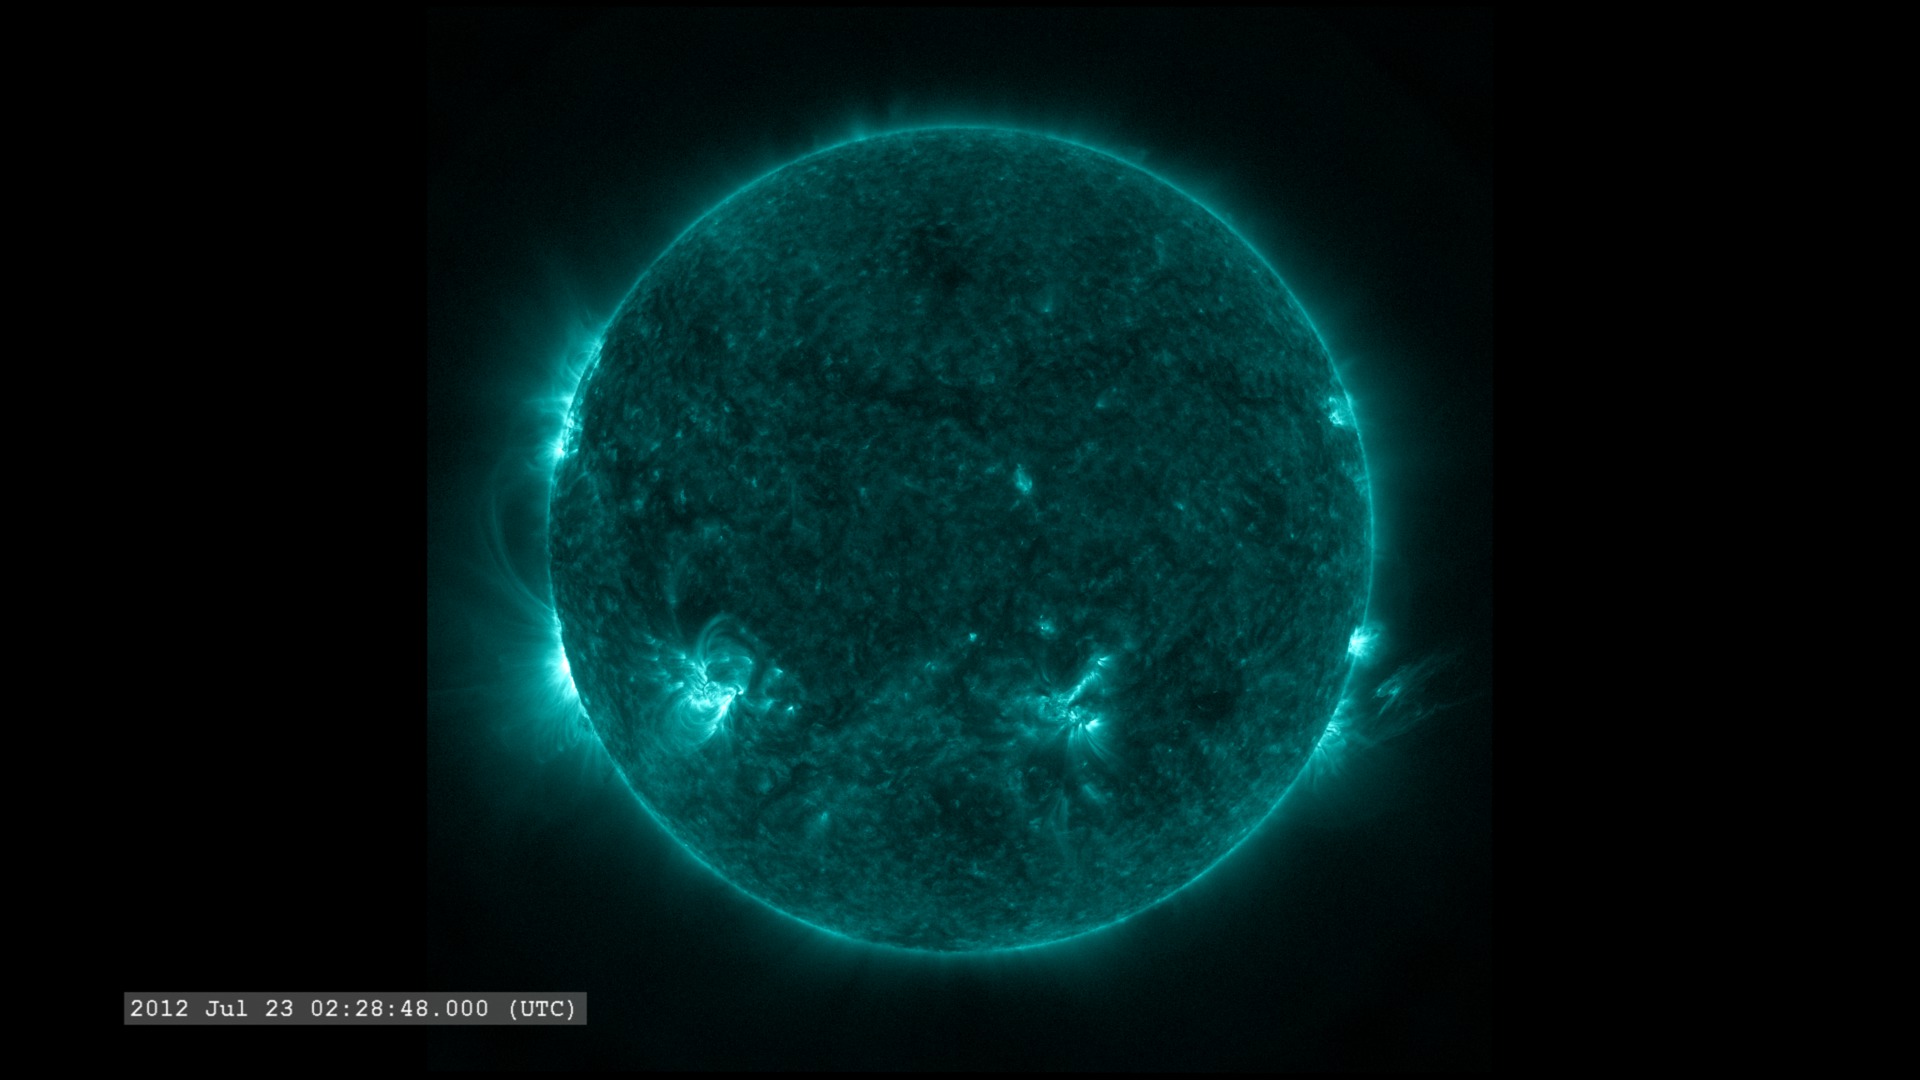
The Rising Solar Cycle: X5.4 Flare ('W' sunspot group) seen by SDO
Go to this pageSunspot group 1429 of solar cycle 24 has launched an X5.4 flare can coronal mass ejection (CME) that is forecast to impact the EarthThis visualization has the full 4Kx4K frames from the 17.1 nm and 13.1 nm filters on the Solar Dynamics Observatory. 2Kx2K MPEG-4 movies are also available. ||
- ID: 4101 Visualization
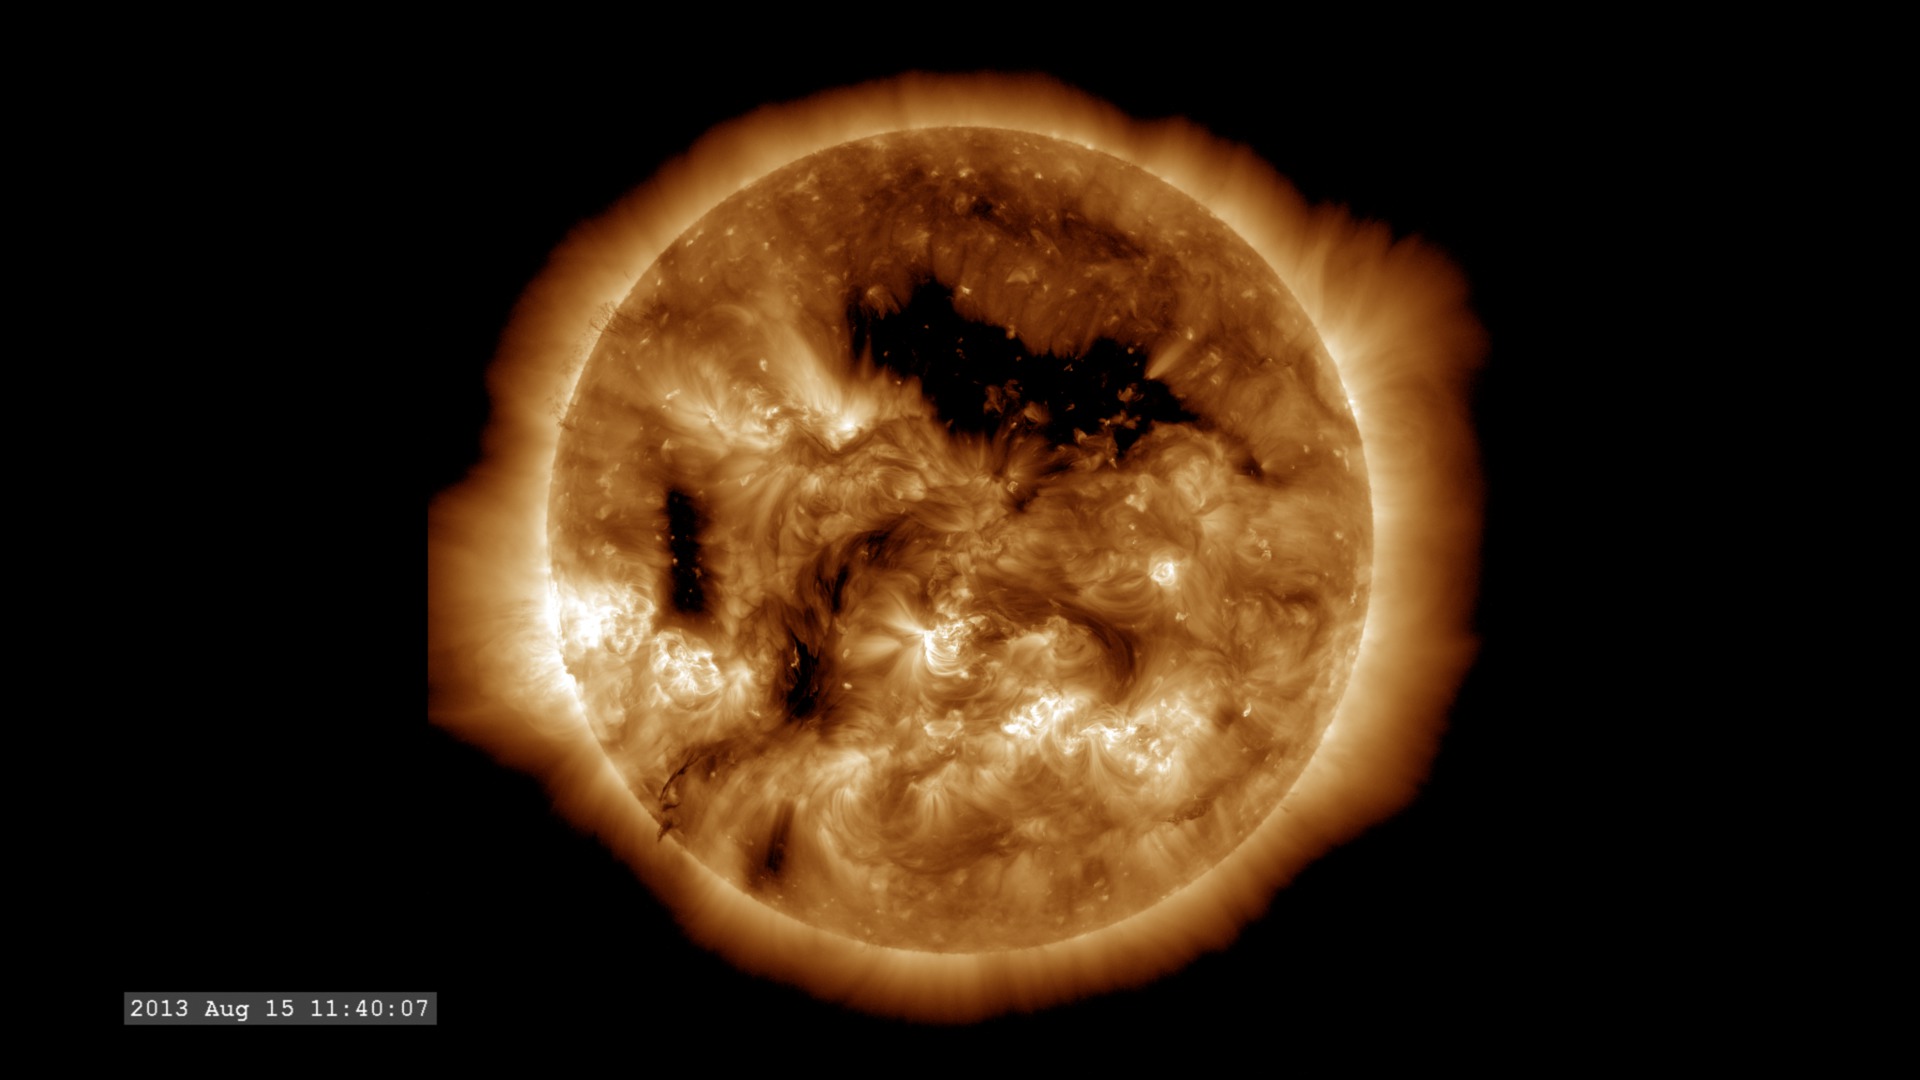
August 2013: SDO Observes Large Coronal Hole
Go to this pageOn the Sun, coronal holes represent regions where the solar magnetic field does not connect back to the Sun. In these cases, the magnetic field guides the charged particles of the solar wind into distant space, forming the fast solar wind. ||
June 2011 Monster Prominence Eruption
The Horrendous Sun Kablooie launches bits of the Sun into space, and some of it comes back.
- ID: 3838 Visualization
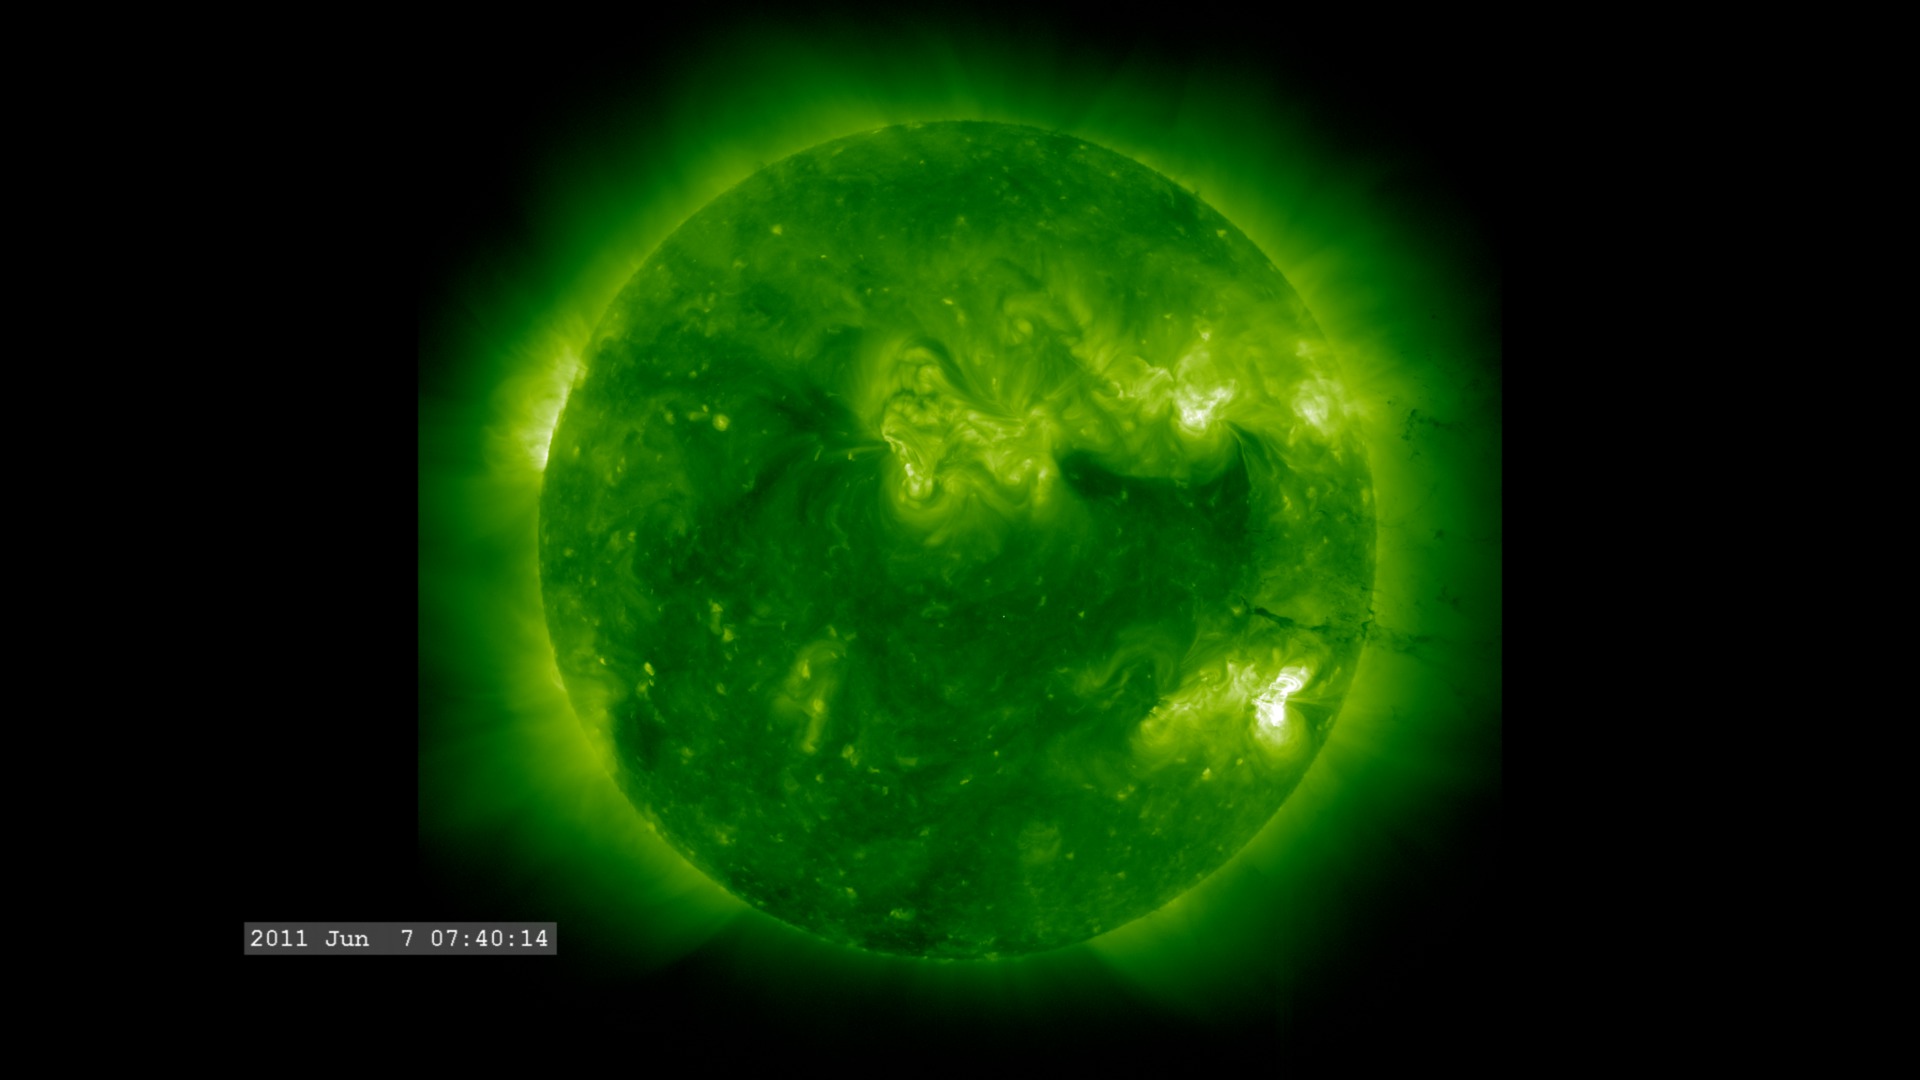
Incredible Solar Flare, Prominence Eruption and CME Event (304 angstroms)
Go to this pageOn June 7, 2011, an M-2 flare occurred on the Sun which released a very large coronal mass ejection (CME). Much of the ejected material is much cooler (less than about 80,000K) and therefore appears dark against the brighter solar disk.Material which does not reach solar escape velocity can be seen falling back and striking the solar surface, sometimes triggering smaller events.This image sequence is captured at one minute intervals and designed to play synchronously with animations 3839 (171 Ångstroms), 3840 (211 Ångstroms) and 3841 (1700 Ångstroms). ||
- ID: 3839 Visualization
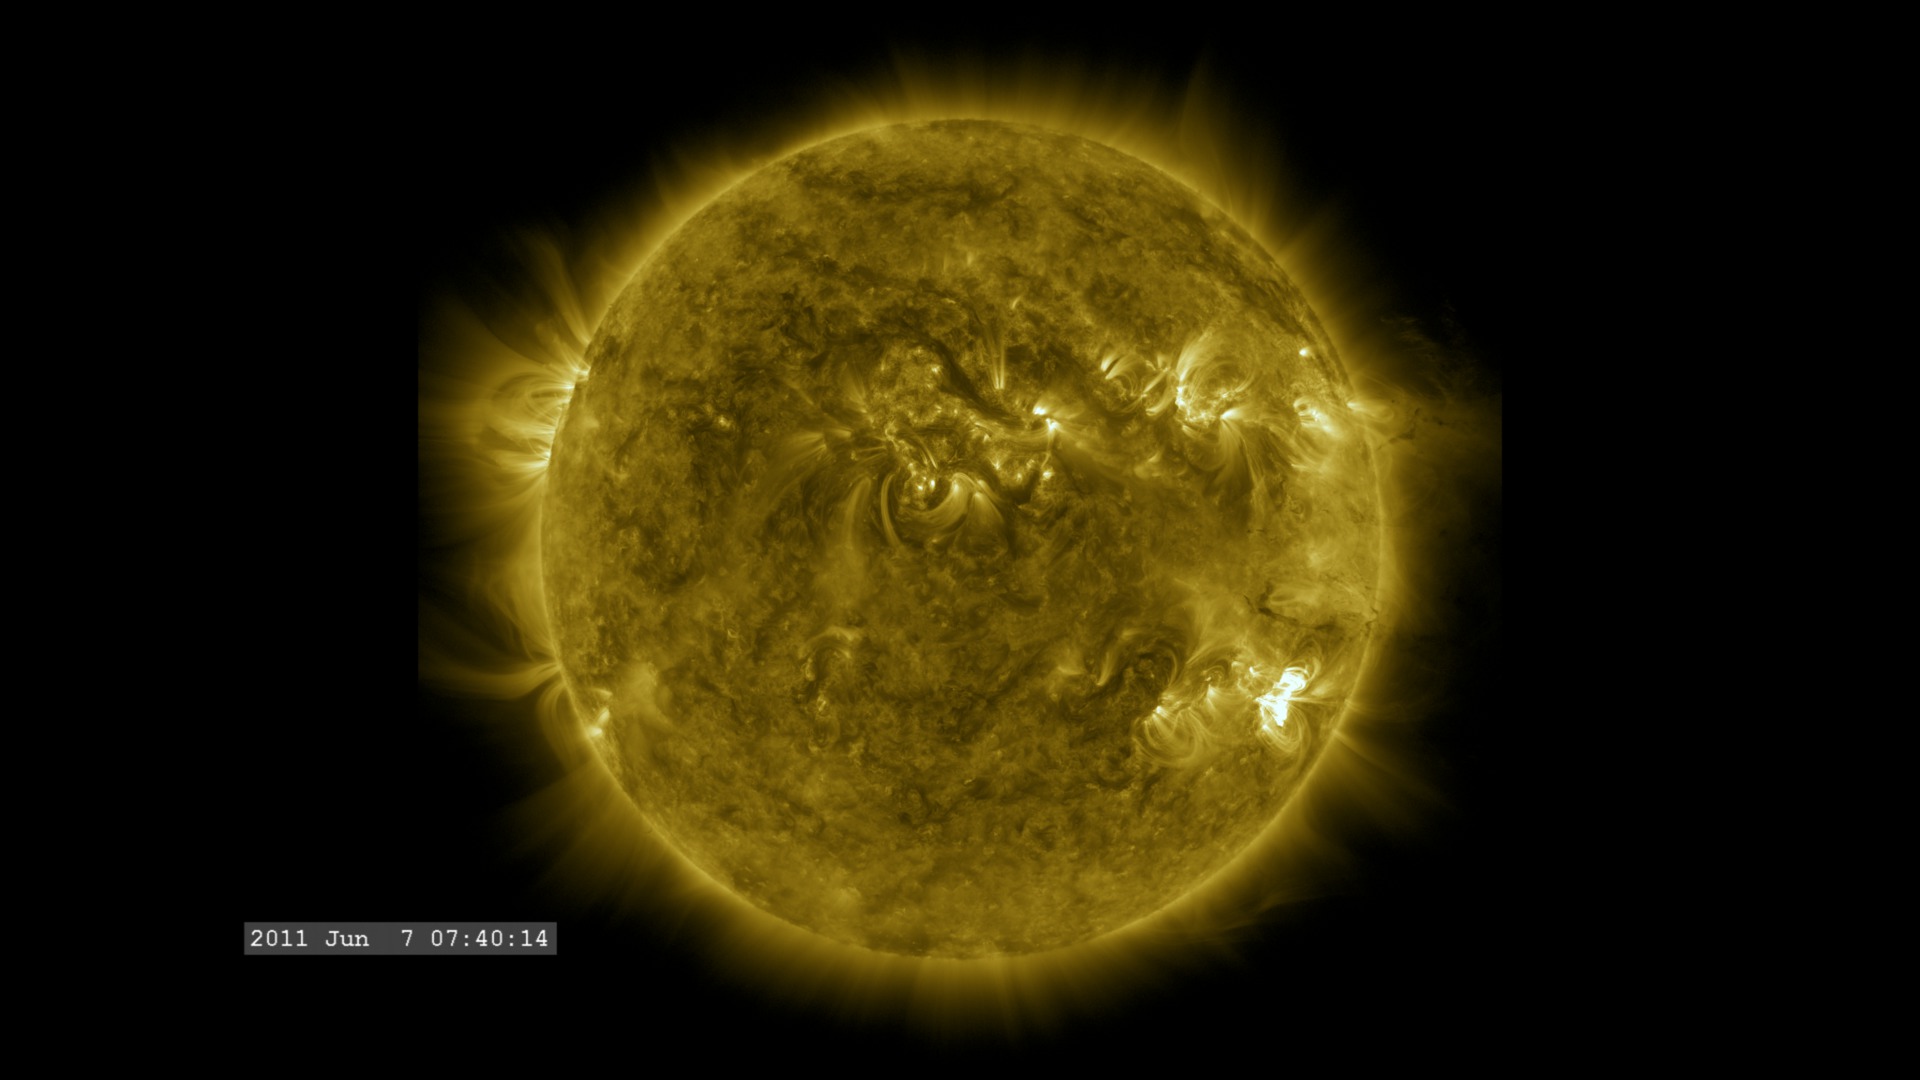
Incredible Solar Flare, Prominence Eruption and CME Event (171 angstroms)
Go to this pageOn June 7, 2011, an M-2 flare occurred on the Sun which released a very large coronal mass ejection (CME). Much of the ejected material is much cooler (less than about 80,000K) and therefore appears dark against the brighter solar disk.Material which does not reach solar escape velocity can be seen falling back and striking the solar surface, sometimes triggering smaller events.This image sequence is captured at one minute intervals and designed to play synchronously with animations 3838 (304 Ångstroms), 3840 (211 Ångstroms) and 3841 (1700 Ångstroms). ||
- ID: 3840 Visualization
Incredible Solar Flare, Prominence Eruption and CME Event (211 angstroms)
Go to this pageOn June 7, 2011, an M-2 flare occurred on the Sun which released a very large coronal mass ejection (CME). Much of the ejected material is much cooler (less than about 80,000K) and therefore appears dark against the brighter solar disk.Material which does not reach solar escape velocity can be seen falling back and striking the solar surface, sometimes triggering smaller events.This image sequence is captured at one minute intervals and designed to play synchronously with animations 3839 (171 Ångstroms), 3838 (304 Ångstroms) and 3841 (1700 Ångstroms). ||
- ID: 3841 Visualization
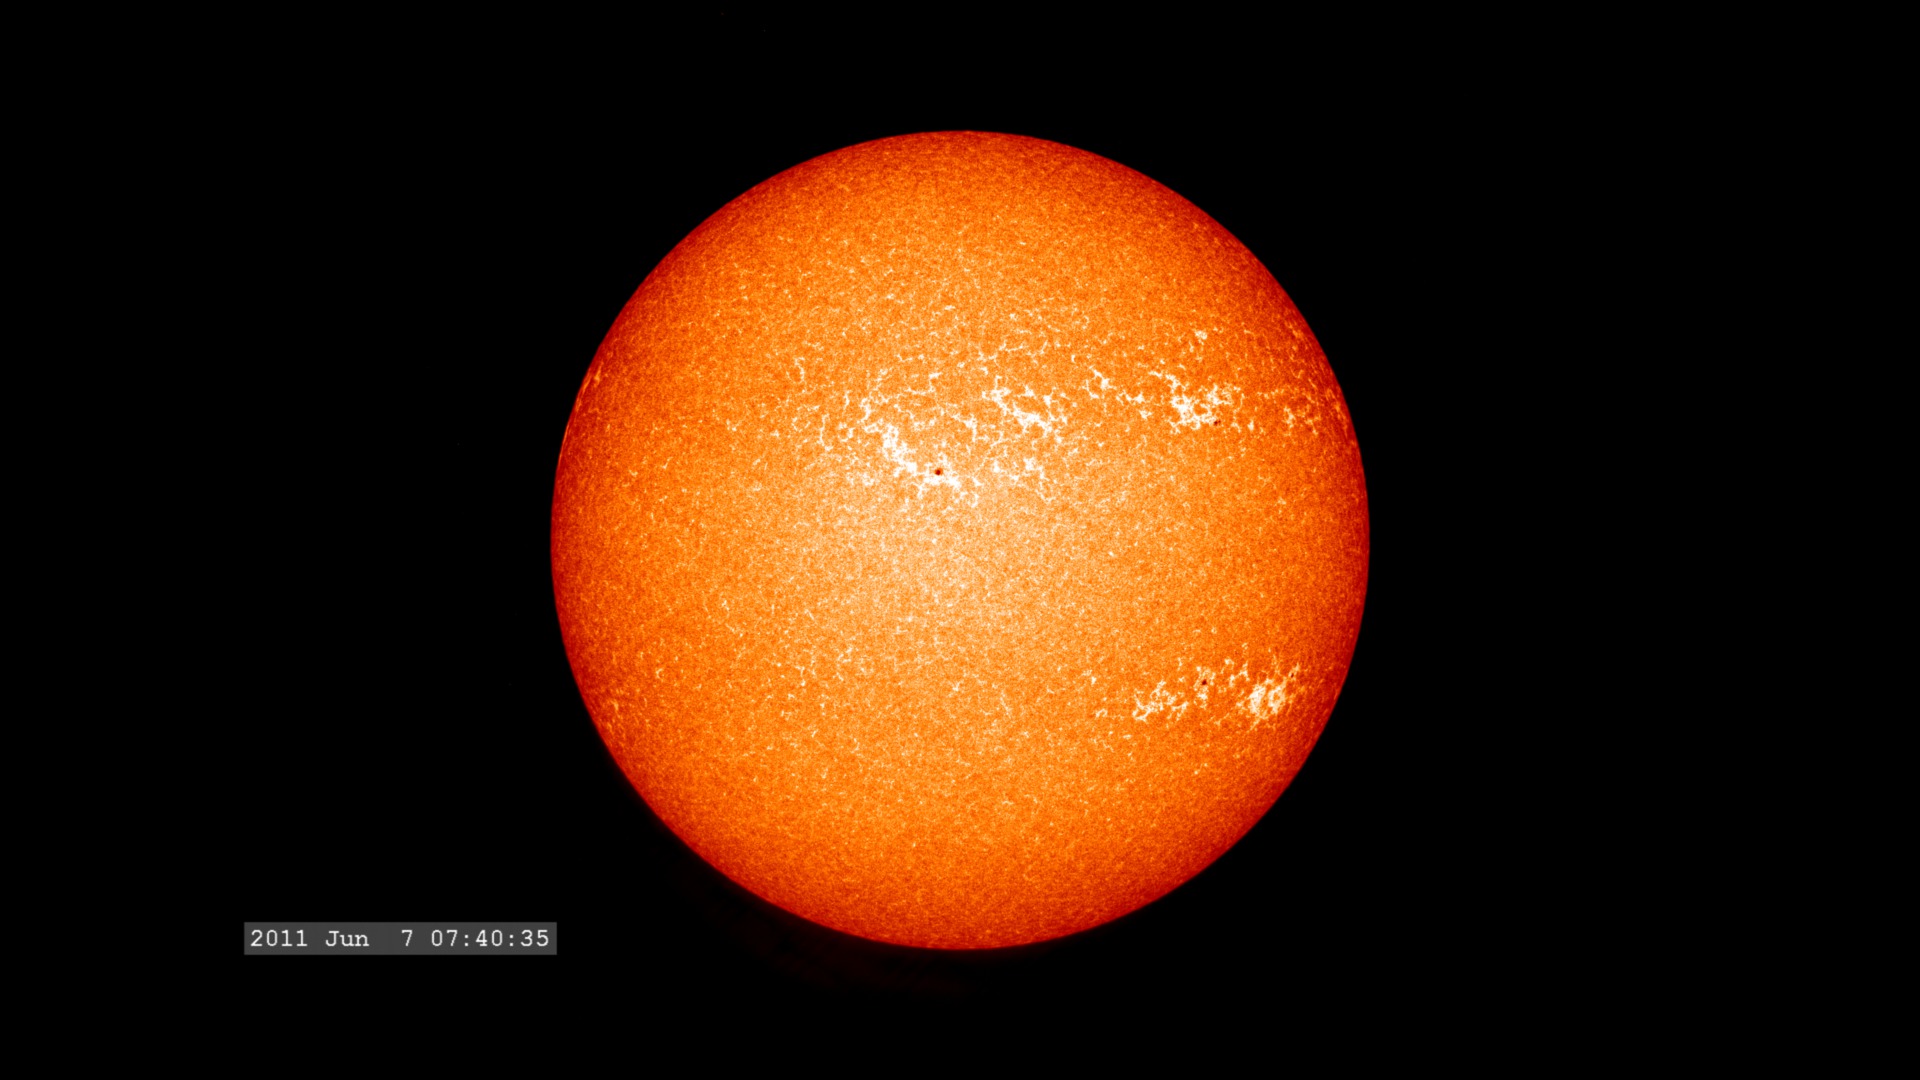
Incredible Solar Flare, Prominence Eruption and CME Event (1700 angstroms)
Go to this pageOn June 7, 2011, an M-2 flare occurred on the Sun which released a very large coronal mass ejection (CME). At this wavelength, very little of the ejected material is visible. However, it is possible to see locations where some of the material is falling back and striking the solar surface.This image sequence is captured at one minute intervals and designed to play synchronously with animations 3839 (171 Ångstroms), 3840 (211 Ångstroms) and 3838 (304 Ångstroms). ||
The Heliophysics Fleet in time and space...
Where they are in time and space, and how they've have changed over time.
- ID: 4288 Visualization
The 2015 Earth-Orbiting Heliophysics Fleet
Go to this pageMovie showing the heliosphysics missions from near Earth orbit out to the orbit of the Moon.This video is also available on our YouTube channel. || Helio2015A.MMStour.slate_RigRHS.HD1080i.0500_print.jpg (1024x576) [112.6 KB] || Helio2015A.MMStour.HD1080.webm (1920x1080) [6.7 MB] || WithoutTimeStamp (1920x1080) [128.0 KB] || Helio2015A.MMStour.HD1080.mov (1920x1080) [196.3 MB] || Helio2015_4288.pptx [198.6 MB] || Helio2015_4288.key [201.3 MB] ||
- ID: 3595 Visualization
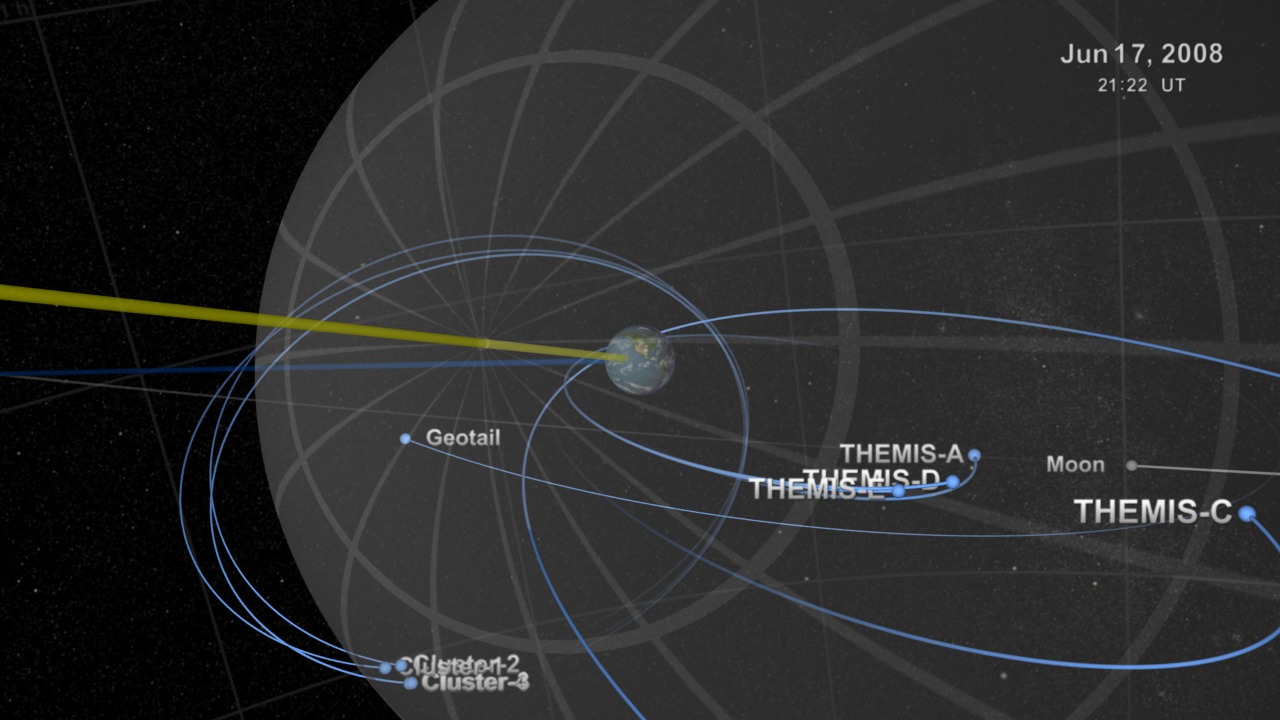
Sentinels of the Heliosphere
Go to this pageHeliophysics is a term to describe the study of the Sun, its atmosphere or the heliosphere, and the planets within it as a system. As a result, it encompasses the study of planetary atmospheres and their magnetic environment, or magnetospheres. These environments are important in the study of space weather.As a society dependent on technology, both in everyday life, and as part of our economic growth, space weather becomes increasingly important. Changes in space weather, either by solar events or geomagnetic events, can disrupt and even damage power grids and satellite communications. Space weather events can also generate x-rays and gamma-rays, as well as particle radiations, that can jeopardize the lives of astronauts living and working in space.This visualization tours the regions of near-Earth orbit; the Earth's magnetosphere, sometimes called geospace; the region between the Earth and the Sun; and finally out beyond Pluto, where Voyager 1 and 2 are exploring the boundary between the Sun and the rest of our Milky Way galaxy. Along the way, we see these regions patrolled by a fleet of satellites that make up NASA's Heliophysics Observatory Telescopes. Many of these spacecraft do not take images in the conventional sense but record fields, particle energies and fluxes in situ. Many of these missions are operated in conjunction with international partners, such as the European Space Agency (ESA) and the Japanese Space Agency (JAXA).The Earth and distances are to scale. Larger objects are used to represent the satellites and other planets for clarity.Here are the spacecraft featured in this movie:Near-Earth Fleet:Hinode: Observes the Sun in multiple wavelengths up to x-rays. SVS pageRHESSI : Observes the Sun in x-rays and gamma-rays. SVS pageTRACE: Observes the Sun in visible and ultraviolet wavelengths. SVS pageTIMED: Studies the upper layers (40-110 miles up) of the Earth's atmosphere.FAST: Measures particles and fields in regions where aurora form.CINDI: Measures interactions of neutral and charged particles in the ionosphere. AIM: Images and measures noctilucent clouds. SVS pageGeospace Fleet:Geotail: Conducts measurements of electrons and ions in the Earth's magnetotail. Cluster: This is a group of four satellites which fly in formation to measure how particles and fields in the magnetosphere vary in space and time. SVS pageTHEMIS: This is a fleet of five satellites to study how magnetospheric instabilities produce substorms. SVS pageL1 Fleet: The L1 point is a Lagrange Point, a point between the Earth and the Sun where the gravitational pull is approximately equal. Spacecraft can orbit this location for continuous coverage of the Sun.SOHO: Studies the Sun with cameras and a multitude of other instruments. SVS pageACE: Measures the composition and characteristics of the solar wind. Wind: Measures particle flows and fields in the solar wind. Heliospheric FleetSTEREO-A and B: These two satellites observe the Sun, with imagers and particle detectors, off the Earth-Sun line, providing a 3-D view of solar activity. SVS pageHeliopause FleetVoyager 1 and 2: These spacecraft conducted the original 'Planetary Grand Tour' of the solar system in the 1970s and 1980s. They have now travelled further than any human-built spacecraft and are still returning measurements of the interplanetary medium. SVS pageThis enhanced, narrated visualization was shown at the SIGGRAPH 2009 Computer Animation Festival in New Orleans, LA in August 2009; an eariler version created for AGU was called NASA's Heliophysics Observatories Study the Sun and Geospace. ||
- ID: 3570 Visualization
NASA's Heliophysics Observatories Study the Sun and Geospace
Go to this pageHeliophysics is a term to describe the study of the Sun, its atmosphere or the heliosphere, and the planets within it as a system. As a result, it encompasses the study of planetary atmospheres and their magnetic environment, or magnetospheres. These environments are important in the study of space weather.As a society dependent on technology, both in everyday life, and as part of our economic growth, space weather becomes increasingly important. Changes in space weather, either by solar events or geomagnetic events, can disrupt and even damage power grids and satellite communications. Space weather events can also generate x-rays and gamma-rays, as well as particle radiations, that can jeopardize the lives of astronauts living and working in space.This visualization tours the regions of near-Earth orbit; the Earth's magnetosphere, sometimes called geospace; the region between the Earth and the Sun; and finally out beyond Pluto, where Voyager 1 and 2 are exploring the boundary between the Sun and the rest of our Milky Way galaxy. Along the way, we see these regions patrolled by a fleet of satellites that make up NASA's Heliophysics Observatory Telescopes. Many of these spacecraft do not take images in the conventional sense but record fields, particle energies and fluxes in situ. Many of these missions are operated in conjunction with international partners, such as the European Space Agency (ESA) and the Japanese Space Agency (JAXA).The Earth and distances are to scale. Larger objects are used to represent the satellites and other planets for clarity.Here are the spacecraft featured in this movie:Near-Earth Fleet:Hinode: Observes the Sun in multiple wavelengths up to x-rays. SVS pageRHESSI : Observes the Sun in x-rays and gamma-rays. SVS pageTRACE: Observes the Sun in visible and ultraviolet wavelengths. SVS pageTIMED: Studies the upper layers (40-110 miles up) of the Earth's atmosphere.FAST: Measures particles and fields in regions where aurora form.CINDI: Measures interactions of neutral and charged particles in the ionosphere. AIM: Images and measures noctilucent clouds. SVS pageGeospace Fleet:Geotail: Conducts measurements of electrons and ions in the Earth's magnetotail. Cluster: This is a group of four satellites which fly in formation to measure how particles and fields in the magnetosphere vary in space and time. SVS pageTHEMIS: This is a fleet of five satellites to study how magnetospheric instabilities produce substorms. SVS pageL1 Fleet: The L1 point is a Lagrange Point between the Sun and the Earth. Spacecraft can orbit this location for continuous coverage of the Sun.SOHO: Studies the Sun with cameras and a multitude of other instruments. SVS pageACE: Measures the composition and characteristics of the solar wind. Wind: Measures particle flows and fields in the solar wind. Heliospheric FleetSTEREO-A and B: These two satellites observe the Sun, with imagers and particle detectors, off the Earth-Sun line, providing a 3-D view of solar activity. SVS pageHeliopause FleetVoyager 1 and 2: These spacecraft conducted the original 'Planetary Grand Tour' of the solar system in the 1970s and 1980s. They have now travelled further than any human-built spacecraft and are still returning measurements of the interplanetary medium. SVS pageA refined and narrated version of this visualization, Sentinels of the Heliosphere, is now available. ||
- ID: 3995 Visualization
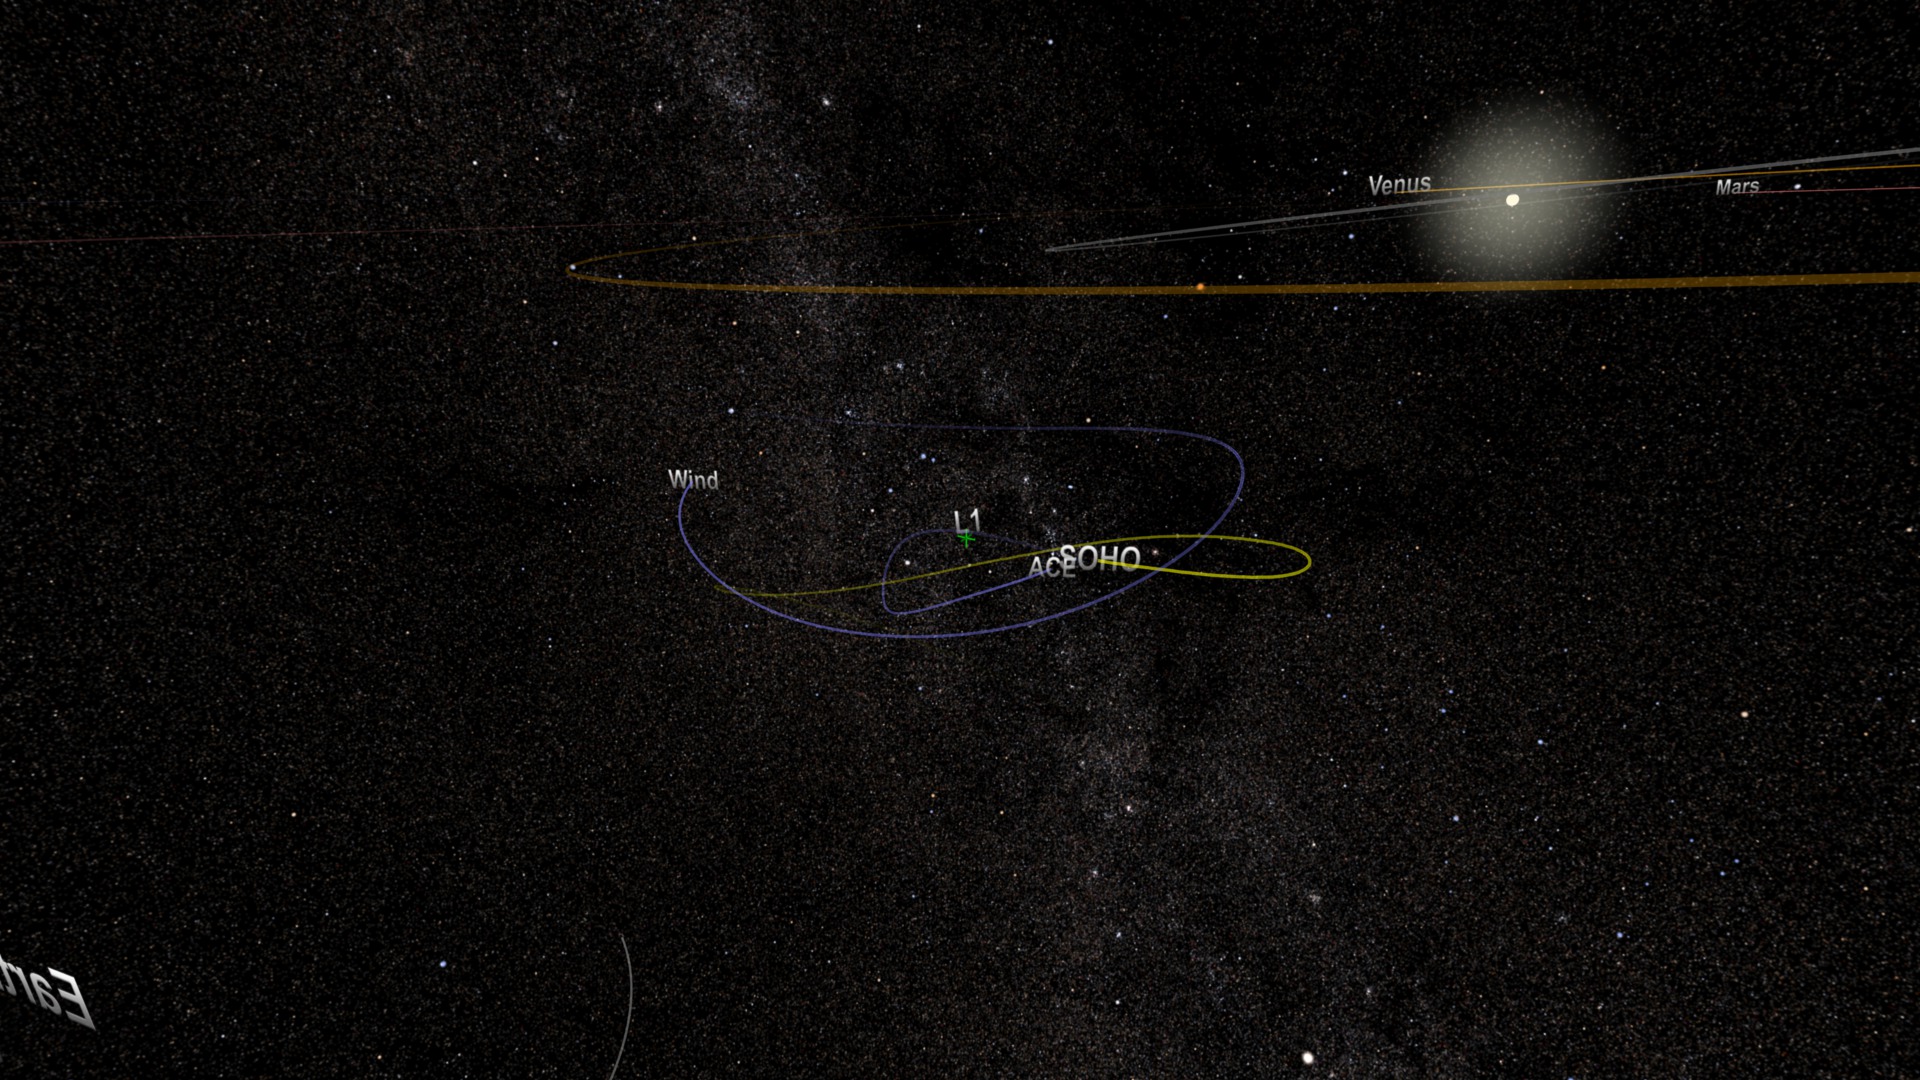
The Heliophysics Fleet at Lagrange Point 1
Go to this pageNASA and ESA operate a fleet of heliophysics satellites at the 'balance point' between the Earth and the Sun, known as Lagrange Point 1, or L1. SOHO, ACE, and Wind have been operating at this point for over 15 years (see SOHO @ 15, ACE @ 15). ||
- ID: 4127 Visualization
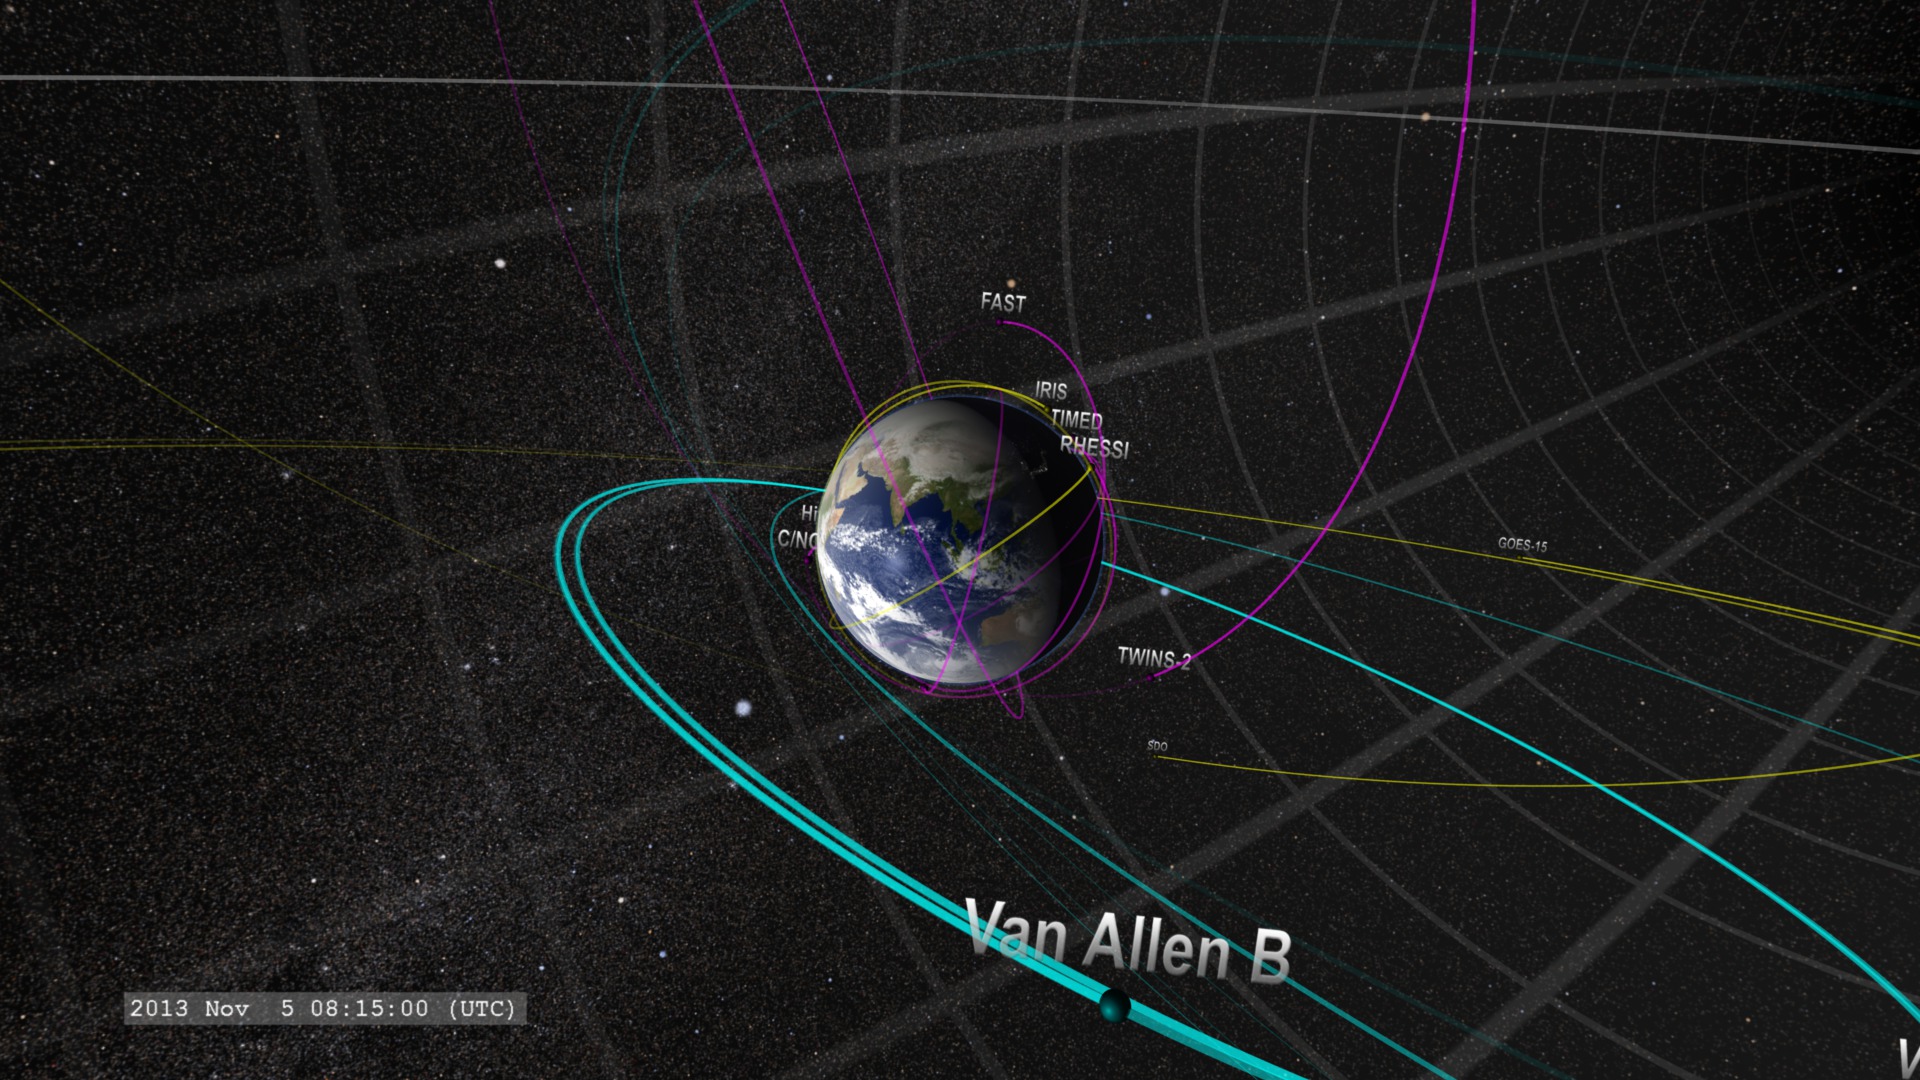
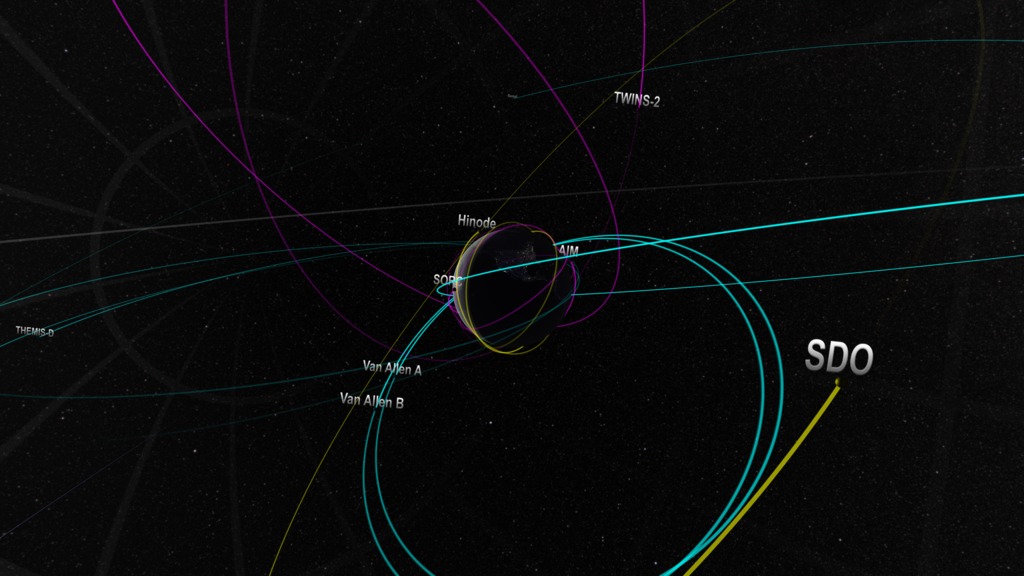
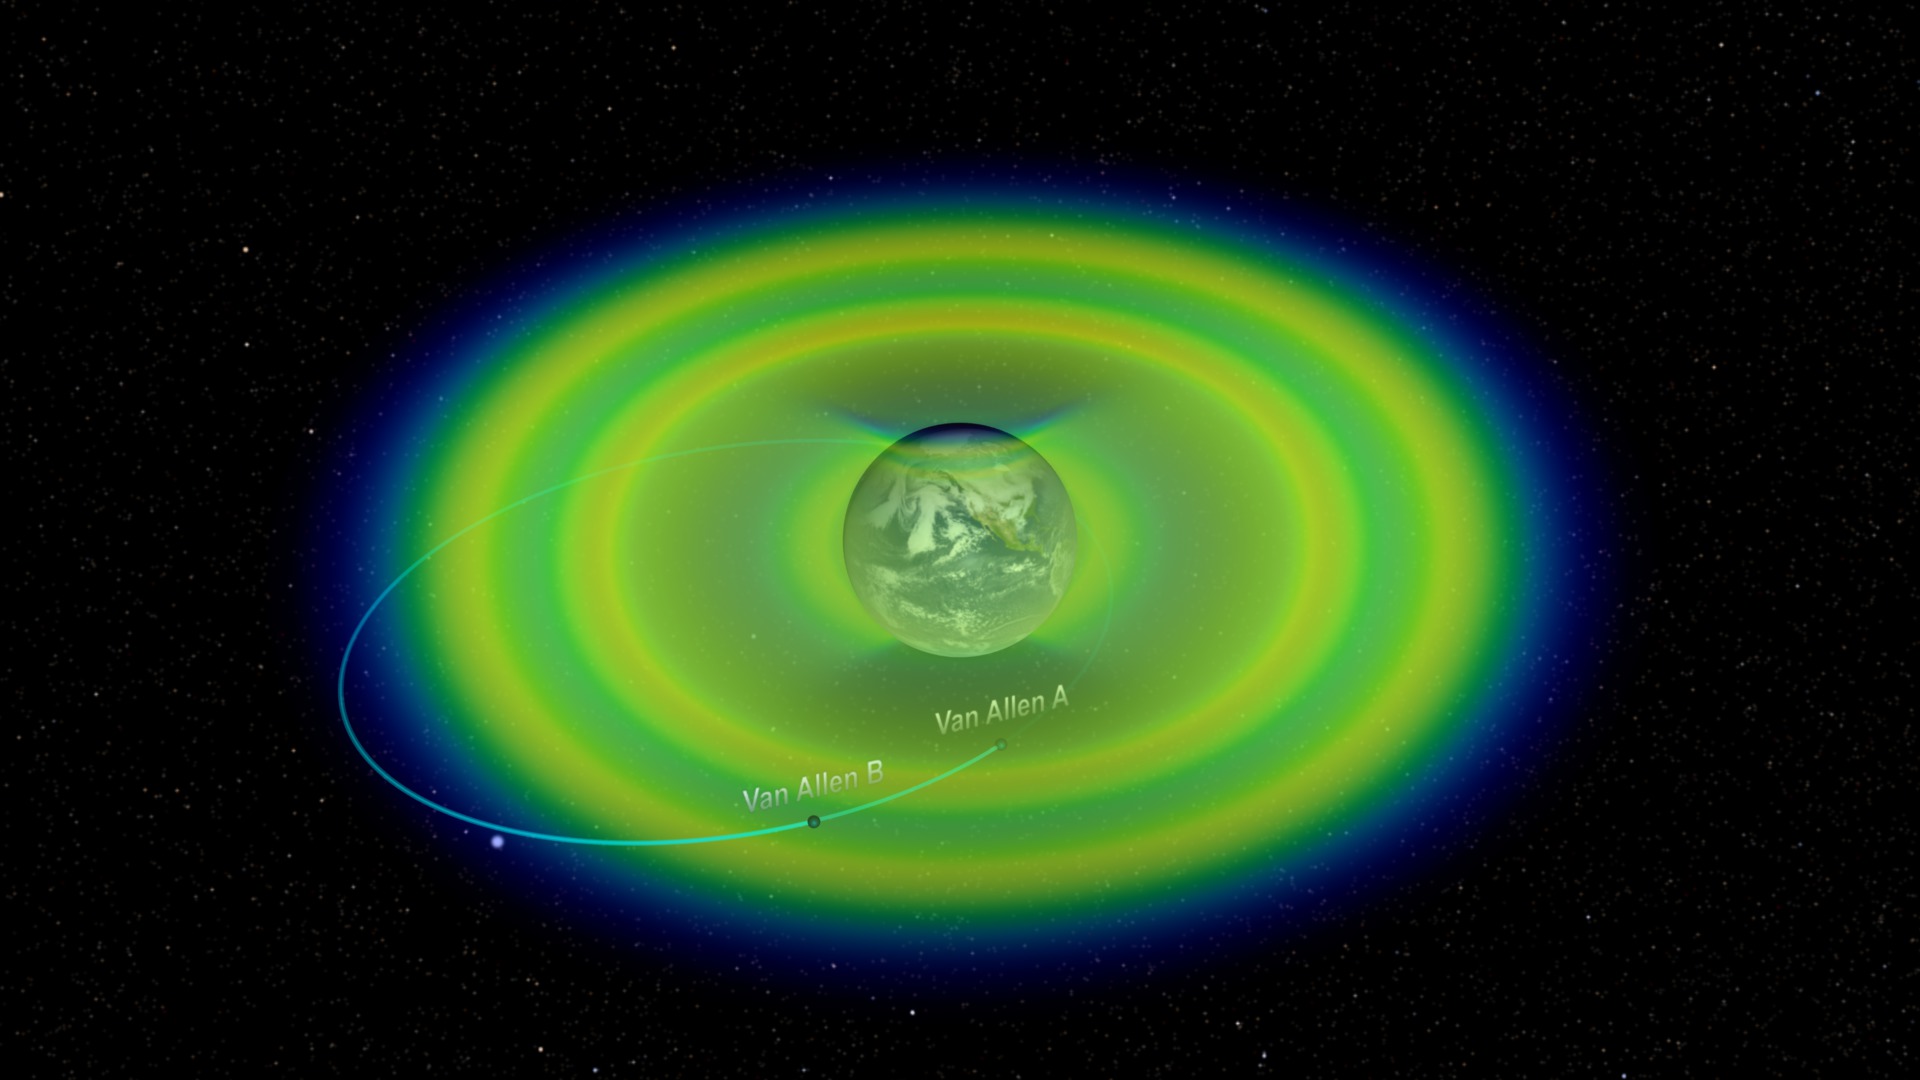
The 2013 Earth-Orbiting Heliophysics Fleet
Go to this pageThere've been a few changes since the 2012 Earth-Orbiting Heliophysics Fleet. As of Fall of 2013, here's a tour of the NASA Near-Earth Heliophysics fleet, covering the space from near-Earth orbit out to the orbit of the Moon.The satellite orbits are color coded for their observing program:Magenta: TIM (Thermosphere, Ionosphere, Mesosphere) observationsYellow: solar observations and imageryCyan: Geospace and magnetosphereViolet: Heliospheric observationsNear-Earth Fleet:Hinode: Observes the Sun in multiple wavelengths up to x-rays. SVS pageRHESSI : Observes the Sun in x-rays and gamma-rays. SVS pageTIMED: Studies the upper layers (40-110 miles up) of the Earth's atmosphere.FAST: Measures particles and fields in regions where aurora form.CINDI: Measures interactions of neutral and charged particles in the ionosphere. SORCE: Monitors solar intensity across a broad range of the electromagnetic spectrum.AIM: Images and measures noctilucent clouds. SVS pageVan Allen Probes: Two probes moving along the same orbit esigned to study the impact of space weather on Earth's radiation belts. SVS pageTWINS: Two Wide-Angle Imaging Neutral-Atom Spectrometers (TWINS) are two probes observing the Earth with neutral atom imagers.IRIS: Interface Region Imaging Spectrograph is designed to take high-resolution spectra and images of the region between the solar photosphere and solar atmosphere.Geosynchronous Fleet:SDO: Solar Dynamics Observatory keeps the Sun under continuous observation at 16 megapixel resolution.GOES: The newest GOES satellites include a solar X-ray imager operated by NOAA.Geospace Fleet:Geotail: Conducts measurements of electrons and ions in the Earth's magnetotail. Cluster: This is a group of four satellites which fly in formation to measure how particles and fields in the magnetosphere vary in space and time. SVS pageTHEMIS: This is a fleet of three satellites to study how magnetospheric instabilities produce substorms. Two of the original five satellites were moved into lunar orbit to become ARTEMIS. SVS page IBEX: The Interstellar Boundary Explorer measures the flux of neutral atoms from the heliopause.Lunar Orbiting FleetARTEMIS: Two of the THEMIS satellites were moved into lunar orbit to study the interaction of the Earth's magnetosphere with the Moon. ||
- ID: 3969 Visualization
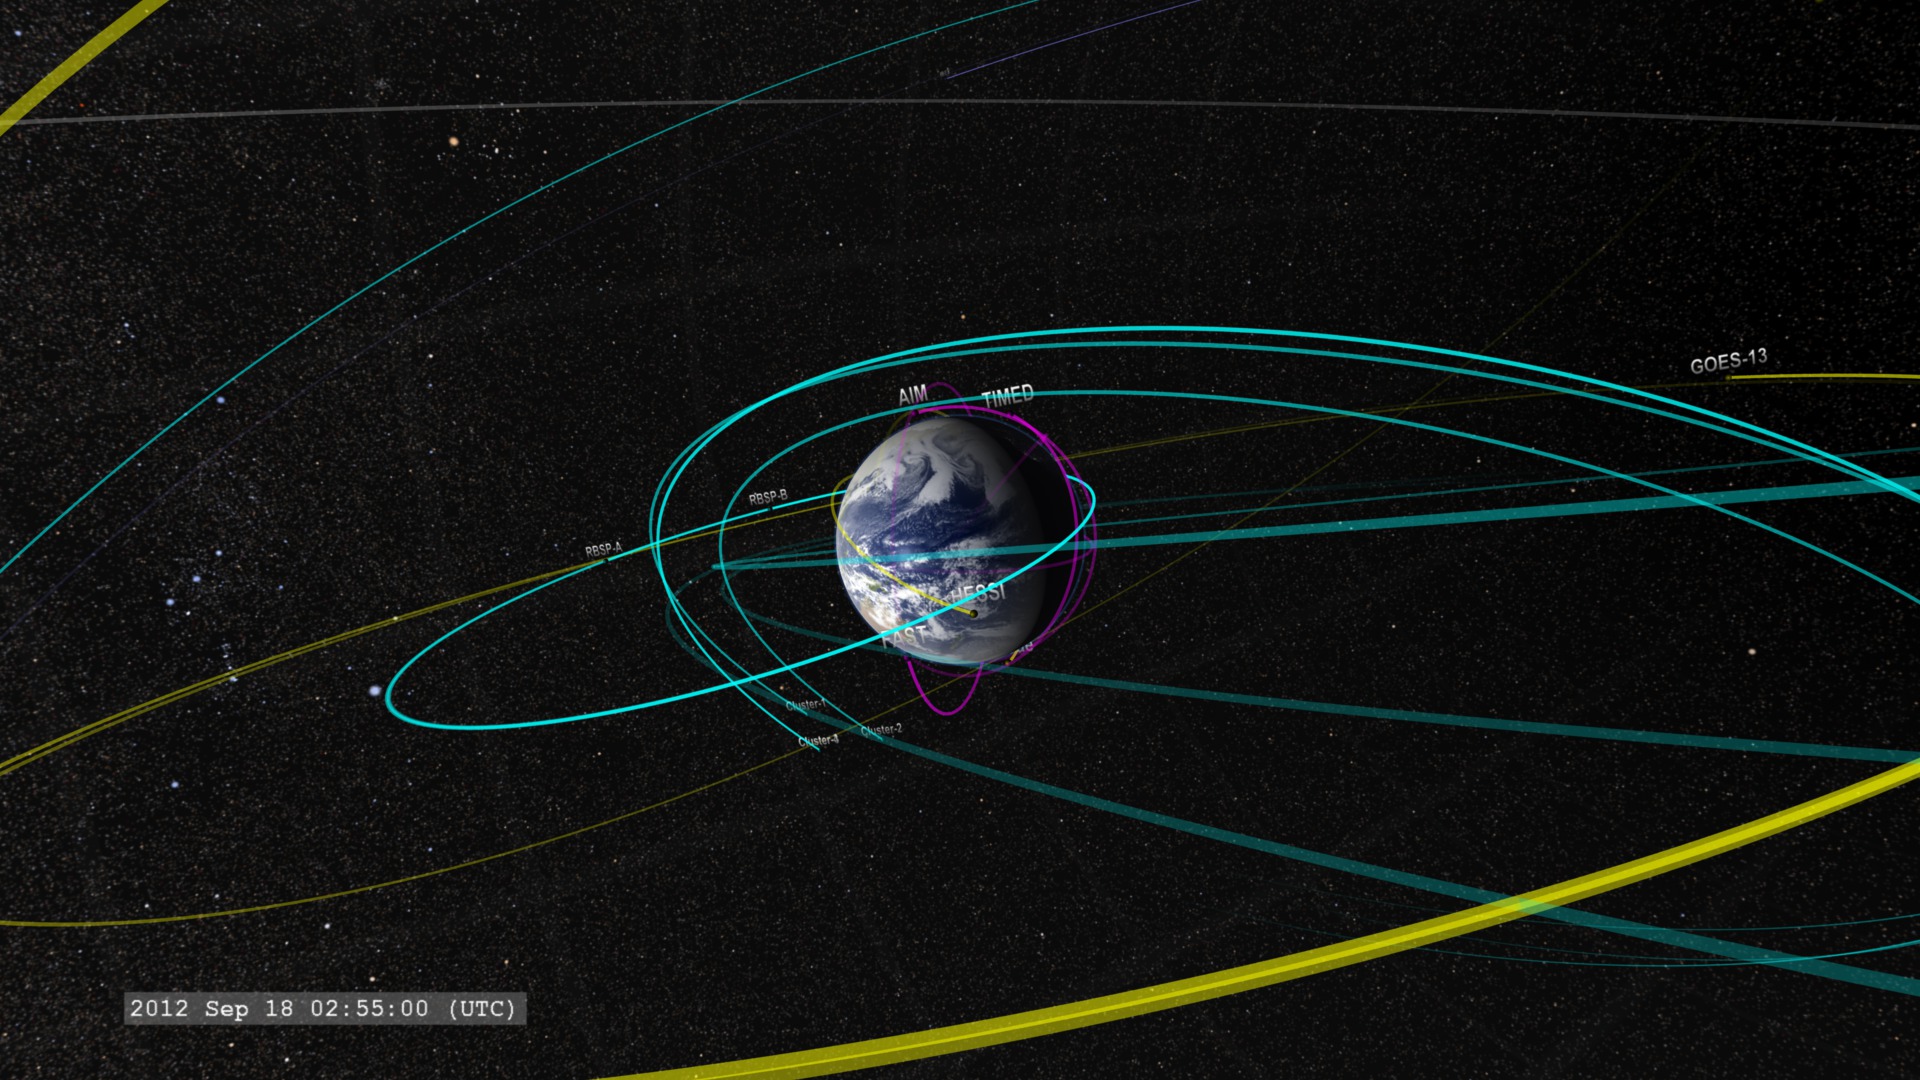
The 2012 Earth-Orbiting Heliophysics Fleet
Go to this pageSince Sentinels of the Heliosphere in 2008, there have been a few new missions, and a few missions have been shut down. As of Fall of 2012, here's a tour of the NASA Near-Earth Heliophysics fleet, covering the space from near-Earth orbit out to the orbit of the Moon.Revision (November 9, 2012): The RBSP mission has been renamed the Van Allen Probes. NASA Press Release.The satellite orbits are color coded for their observing program:Magenta: TIM (Thermosphere, Ionosphere, Mesosphere) observationsYellow: solar observations and imageryCyan: Geospace and magnetosphereViolet: Heliospheric observationsNear-Earth Fleet:Hinode: Observes the Sun in multiple wavelengths up to x-rays. SVS pageRHESSI : Observes the Sun in x-rays and gamma-rays. SVS pageTIMED: Studies the upper layers (40-110 miles up) of the Earth's atmosphere.FAST: Measures particles and fields in regions where aurora form.CINDI: Measures interactions of neutral and charged particles in the ionosphere. SORCE: Monitors solar intensity across a broad range of the electromagnetic spectrum.AIM: Images and measures noctilucent clouds. SVS pageRBSP: (Renamed the Van Allen Probes) Designed to study the impact of space weather on Earth's radiation belts. SVS pageGeosynchronous Fleet:SDO: Solar Dynamics Observatory keeps the Sun under continuous observation at 16 megapixel resolution.GOES: The newest GOES satellites include a solar X-ray imager operated by NOAA.Geospace Fleet:Geotail: Conducts measurements of electrons and ions in the Earth's magnetotail. Cluster: This is a group of four satellites which fly in formation to measure how particles and fields in the magnetosphere vary in space and time. SVS pageTHEMIS: This is a fleet of three satellites to study how magnetospheric instabilities produce substorms. Two of the original five satellites were moved into lunar orbit to become ARTEMIS. SVS page IBEX: The Interstellar Boundary Explorer measures the flux of neutral atoms from the heliopause.Lunar Orbiting FleetARTEMIS: Two of the THEMIS satellites were moved into lunar orbit to study the interaction of the Earth's magnetosphere with the Moon.Note: A number of near-Earth missions had their orbits generated from Two-Line orbital elements valid in July 2012. Orbit perturbations since then may result in significant deviation from the actual satellite position for the time frame of this visualization. ||
Space Weather
When the Sun burps, the Earth can tremble...
- ID: 3902 Visualization
A Coronal Mass Ejection strikes the Earth!
Go to this pageEnergetic events on the Sun have impacts throughout the Solar System. This visualization, developed for the Dynamic Earth dome show, utilizes data from space weather models based on a real coronal mass ejection (CME) event from mid-December 2003. Particles are used to represent the flow of solar material from the Sun around the Earth. It is important to note that the flowing material of the CME are actually ions and electrons far too small to see. This visualization tries to represent the motions of these tiny particles in a form large enough for us to see. We open with a close-up view of the Earth, the particles representing the solar wind streaming around the Earth due to extended influence of the Earth's magnetic field. We pull out from the Earth and move so that we see the Sun in the distance. The enormous density enhancement in the solar wind is the coronal mass ejection. As the CME reaches the Earth, we see how effective the Earth's magnetic field is at diverting the solar material around the Earth. As the CME passes, we move earthward, and reveal the field lines representing the Earth's magnetic field, emanating from the magnetic poles and blown behind the Earth due to the influence of the solar wind. For simplicity, we have represented the Earth's magnetic field as unchanging, but it is actually very dynamic in its response to a CME or other change in the solar wind. ||
- ID: 3867 Visualization
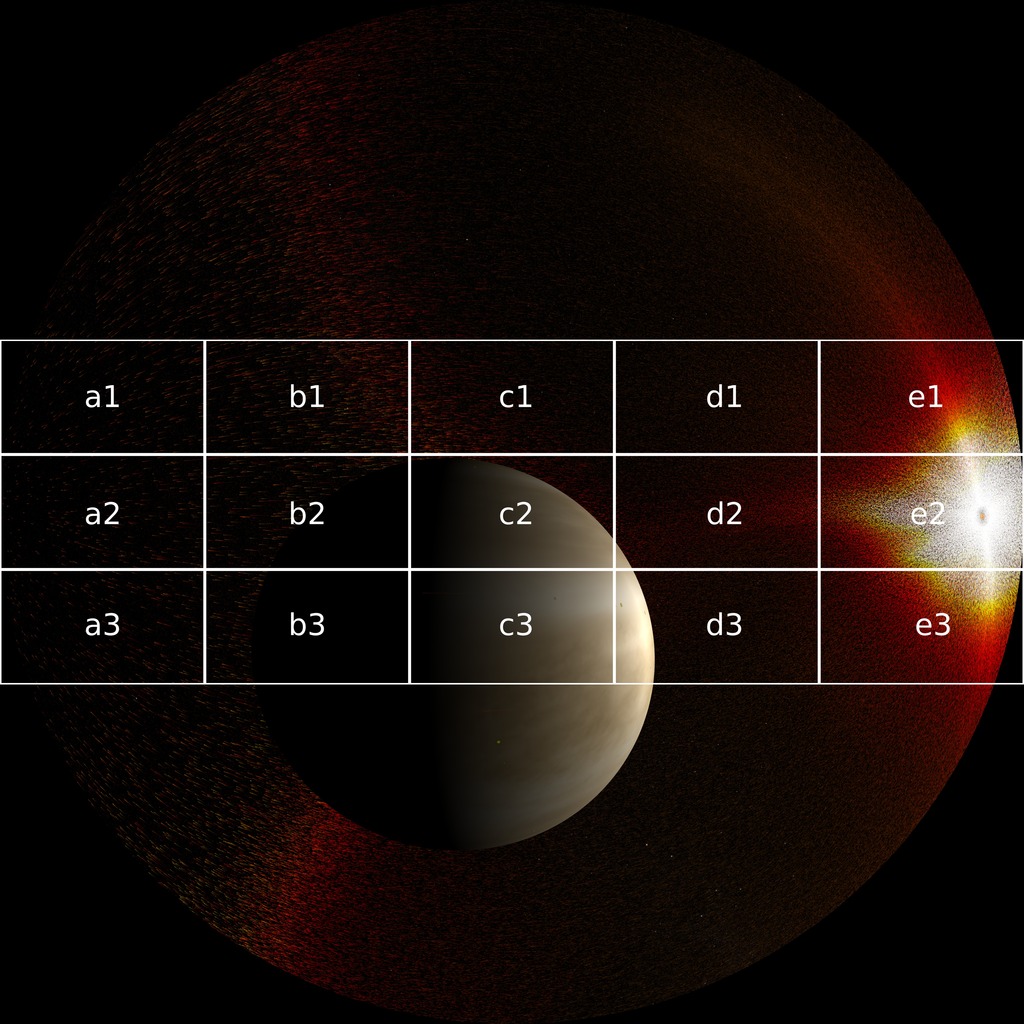
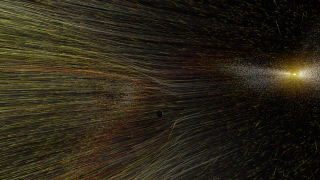
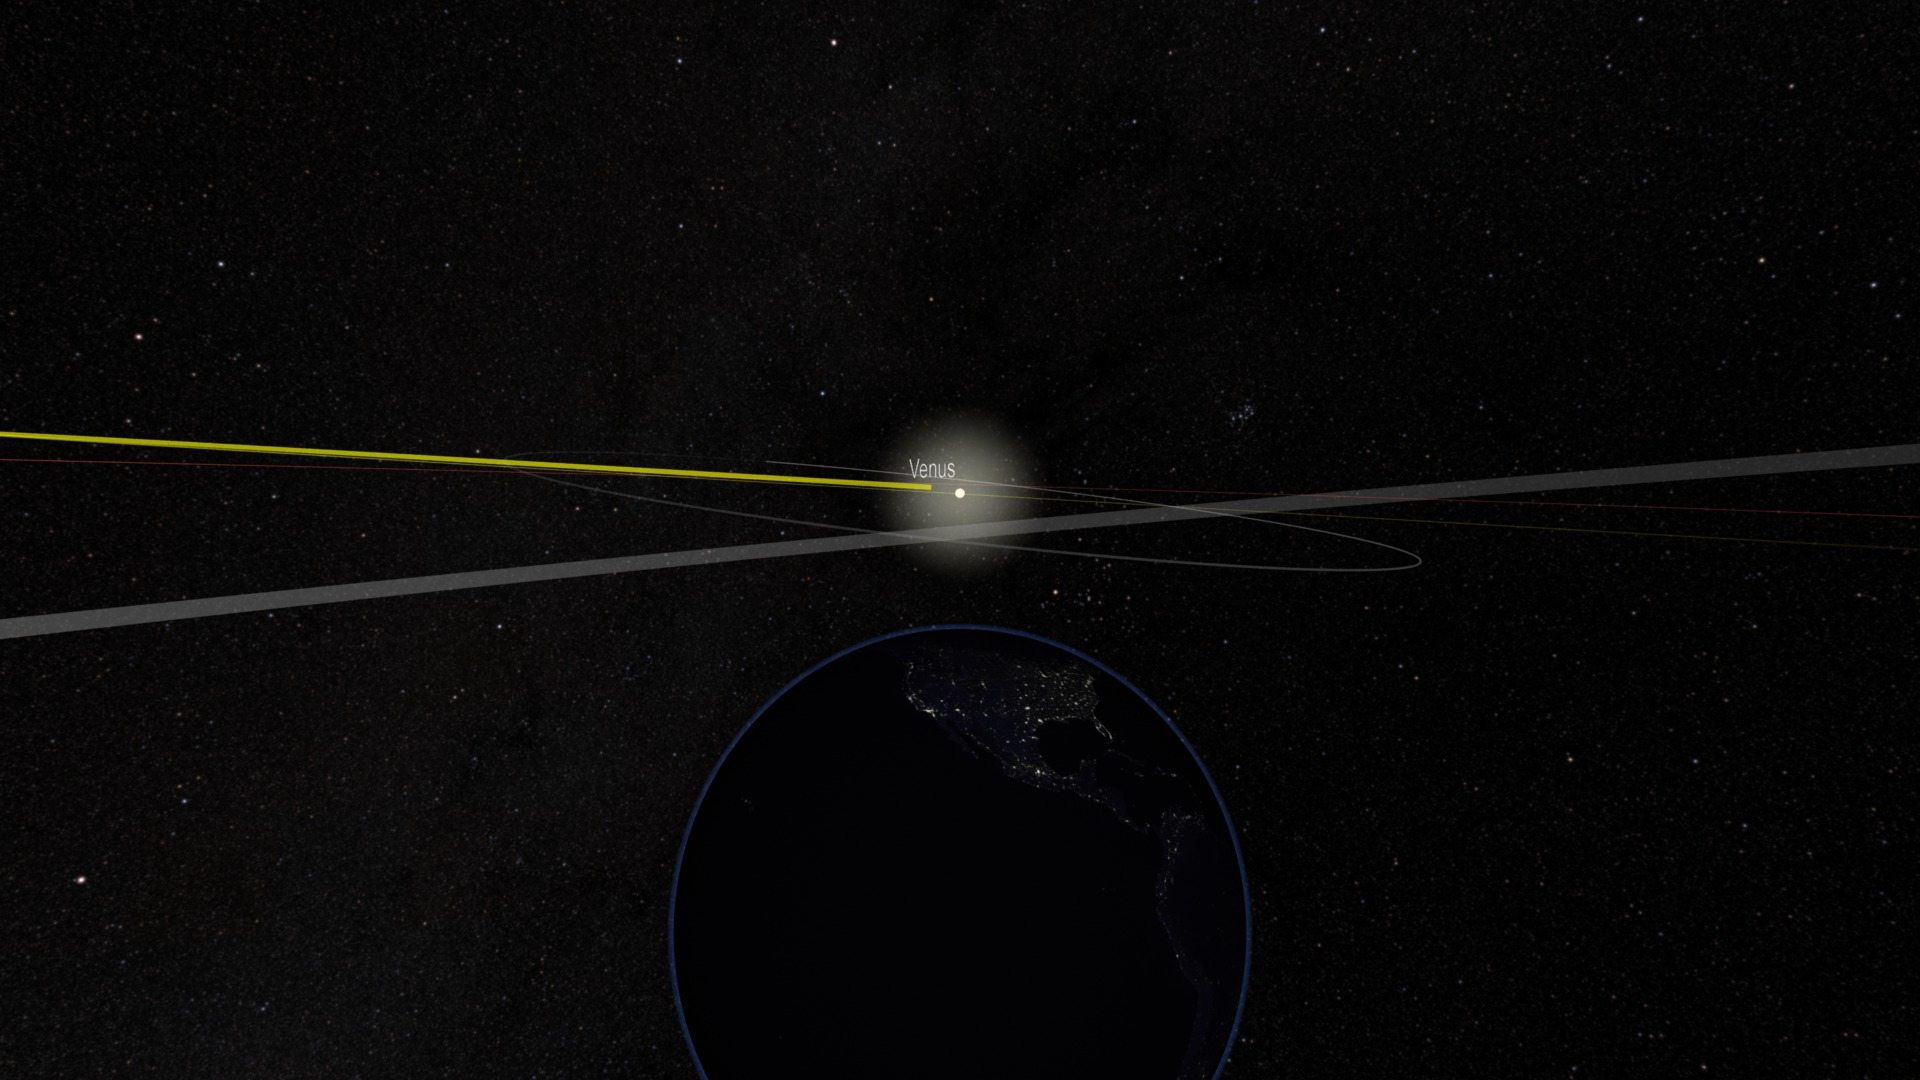
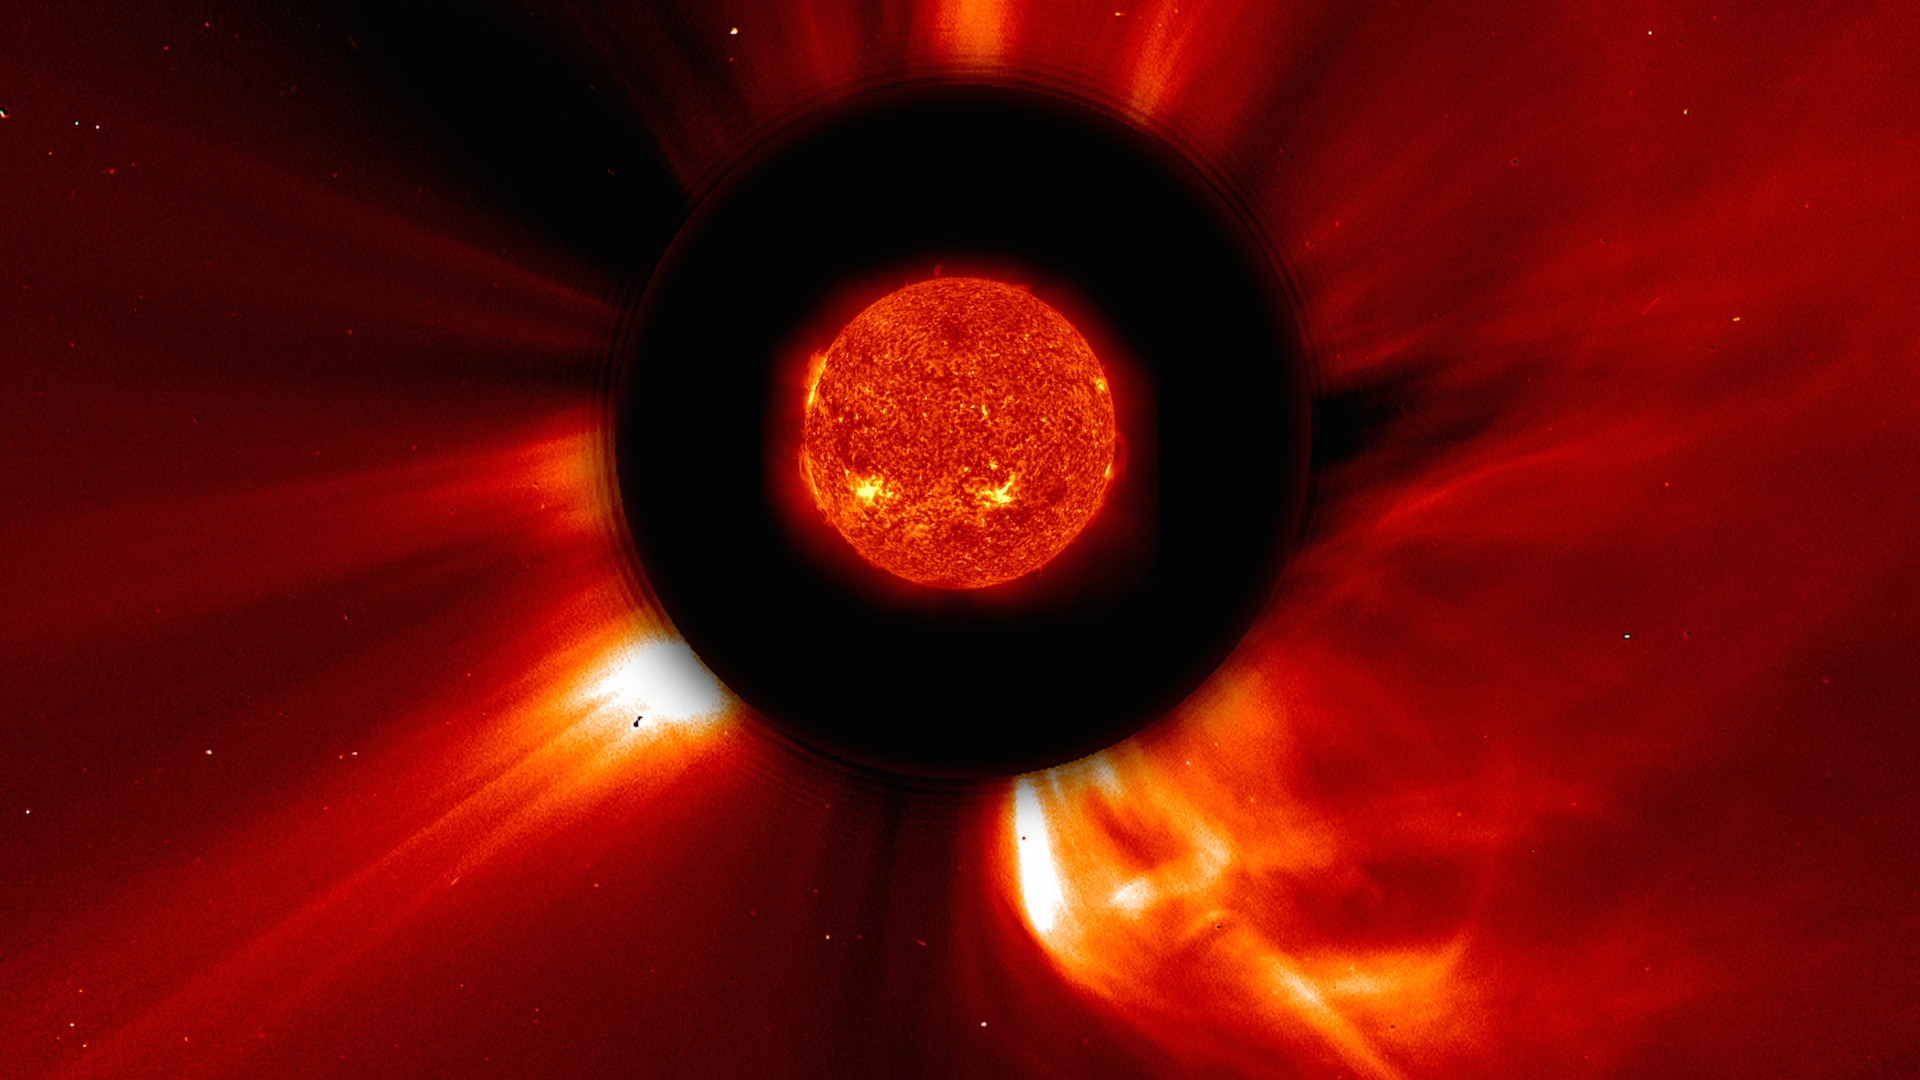
A Coronal Mass Ejection strikes Venus!
Go to this pageEnergetic events on the Sun have impacts throughout the Solar System. This visualization, developed for the "Dynamic Earth" dome show, opens with a closeup view of the Sun. The solar imagery was collected from the Solar Dynamics Observatory (SDO) using an ultraviolet filter (wavelength 304 Ångstroms or 30.4 nanometers). We can observe jets of ionized gases, called prominences, erupting from the solar surface, and often constrained to loop-shaped trajectories due to the solar magnetic field.We pull out from the Sun to reveal the solar wind, which continuously streams outward from the Sun.We eventually reach the orbit of the planet Venus, the solar wind still streaming around us.But a massive eruption, called a coronal mass ejection, or CME, takes place on the Sun, sending a much higher density of particles (ions and electrons) outward into the solar wind.The wave of particles eventually strikes the planet Venus. But Venus has no significant magnetic field, and the particles make it directly to the atmosphere of the planet. These energetic solar events slowly blow away the atmosphere of the planet.The next part of this sequence is "The Coronal Mass Ejection strikes the Earth!".Technical DetailsThis is the dome show component moving from the Sun to Venus being hit by the CME.The domemaster format was created by rendering 7 separate camera tiles. The tiles were then stitched together to form final domemaster layers at 4096x4096 resolution and 16 bits per channel with premultiplied alpha and no gamma correction. There are 3 domemaster layers that should be composited as follows:- Earth and orbits- Sun- star field (no alpha channel)In addition to the final domemaster frames and movies, the individual camera tiles are included as well. Each domemaster layer has a set of camera tiles. There are 7 cameras numbered 00 through 06 that represent the itiles. Camera 00 is in the center of the domemaster, camera 01 is looking below camera 00, cameras 01 through 06 look around the outside of the dome master in counter-clockwise order. These frames are probably only useful if a better re-stitching algorithm is ever required to be run on the tiles. ||
- ID: 3551 Visualization

The Coronal Mass Ejection strikes the Earth!
Go to this pageThis visualization is the sequel to animation ID 3867.The CME we saw before continues to expand from the Sun, and its outer boundary is approaching the Earth. Will the Earth be pummeled like its sister planet, Venus?Not this time, for the Earth has a fairly strong geomagnetic field.The geomagnetic field helps deflect the incoming blast of solar particles around the Earth, dramatically reducing the impact of the event.It is important to note that the flowing material of the CME are actually ions and electrons far too small to see. This visualization tries to represent the motions of these tiny particle in a form large enough for us to see.Technical DetailsThis is the dome show component where the CME strikes the Earth.The domemaster format was created by rendering 7 separate camera tiles. The tiles were then stitched together to form final domemaster layers at 4096x4096 resolution and 16 bits per channel with premultiplied alpha and no gamma correction. There are 2 domemaster layers that should be composited as follows:- Earth, Sun and particles- star field (no alpha channel)In addition to the final domemaster frames and movies, the individual camera tiles are included as well. Each domemaster layer has a set of camera tiles. There are 7 cameras numbered 00 through 06 that represent the itiles. Camera 00 is in the center of the domemaster, camera 01 is looking below camera 00, cameras 01 through 06 look around the outside of the dome master in counter-clockwise order. These frames are probably only useful if a better re-stitching algorithm is ever required to be run on the tiles. ||
- ID: 3890 Visualization
From the Sun to the Earth: CME Enhancement
Go to this pageThis visualization shows the dataset from STEREO-A processed to enhance the visibility of the coronal mass ejection (CME) in entry #3846. The data are combined from the SECCHI instrument, which includes an ultraviolet image of the Sun (EUVI), two coronographs (COR-1 & COR-2), and the wide-angle Heliospheric Imagers (HI-1 & HI-2).Because the enhancement process for the CME involves computing differences from a number of sequential HI-1 and HI-2 images, the Earth (left side) and Venus (middle) are masked and oversized icons are installed to mark their position. The dark shape on the left of the field of view is created by an occulting tab that was installed to (occasionally) hide the bright Earth in the view.The little cross markers label three other planets in the view of STEREO. Uranus is almost invisible in the scale of this imagery, but is visible in full-resolution datasets. ||
- ID: 3846 Visualization
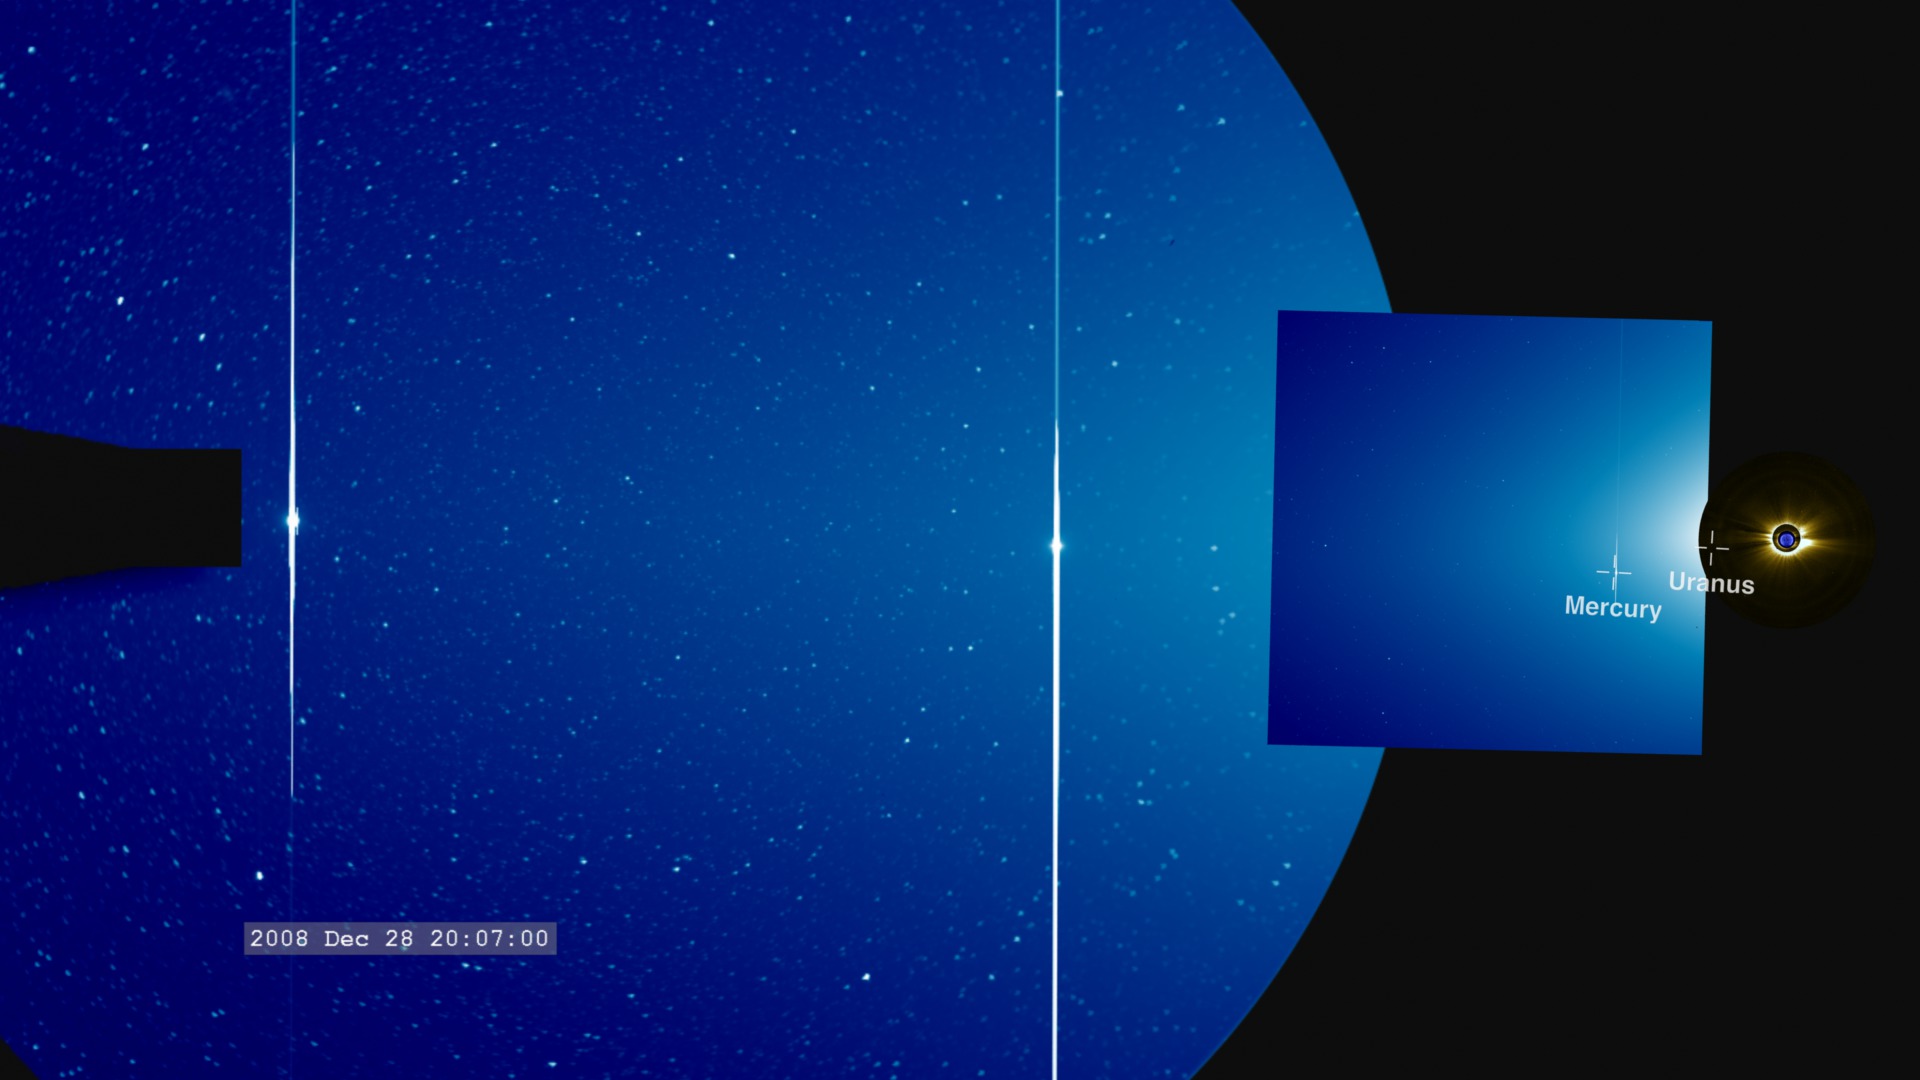
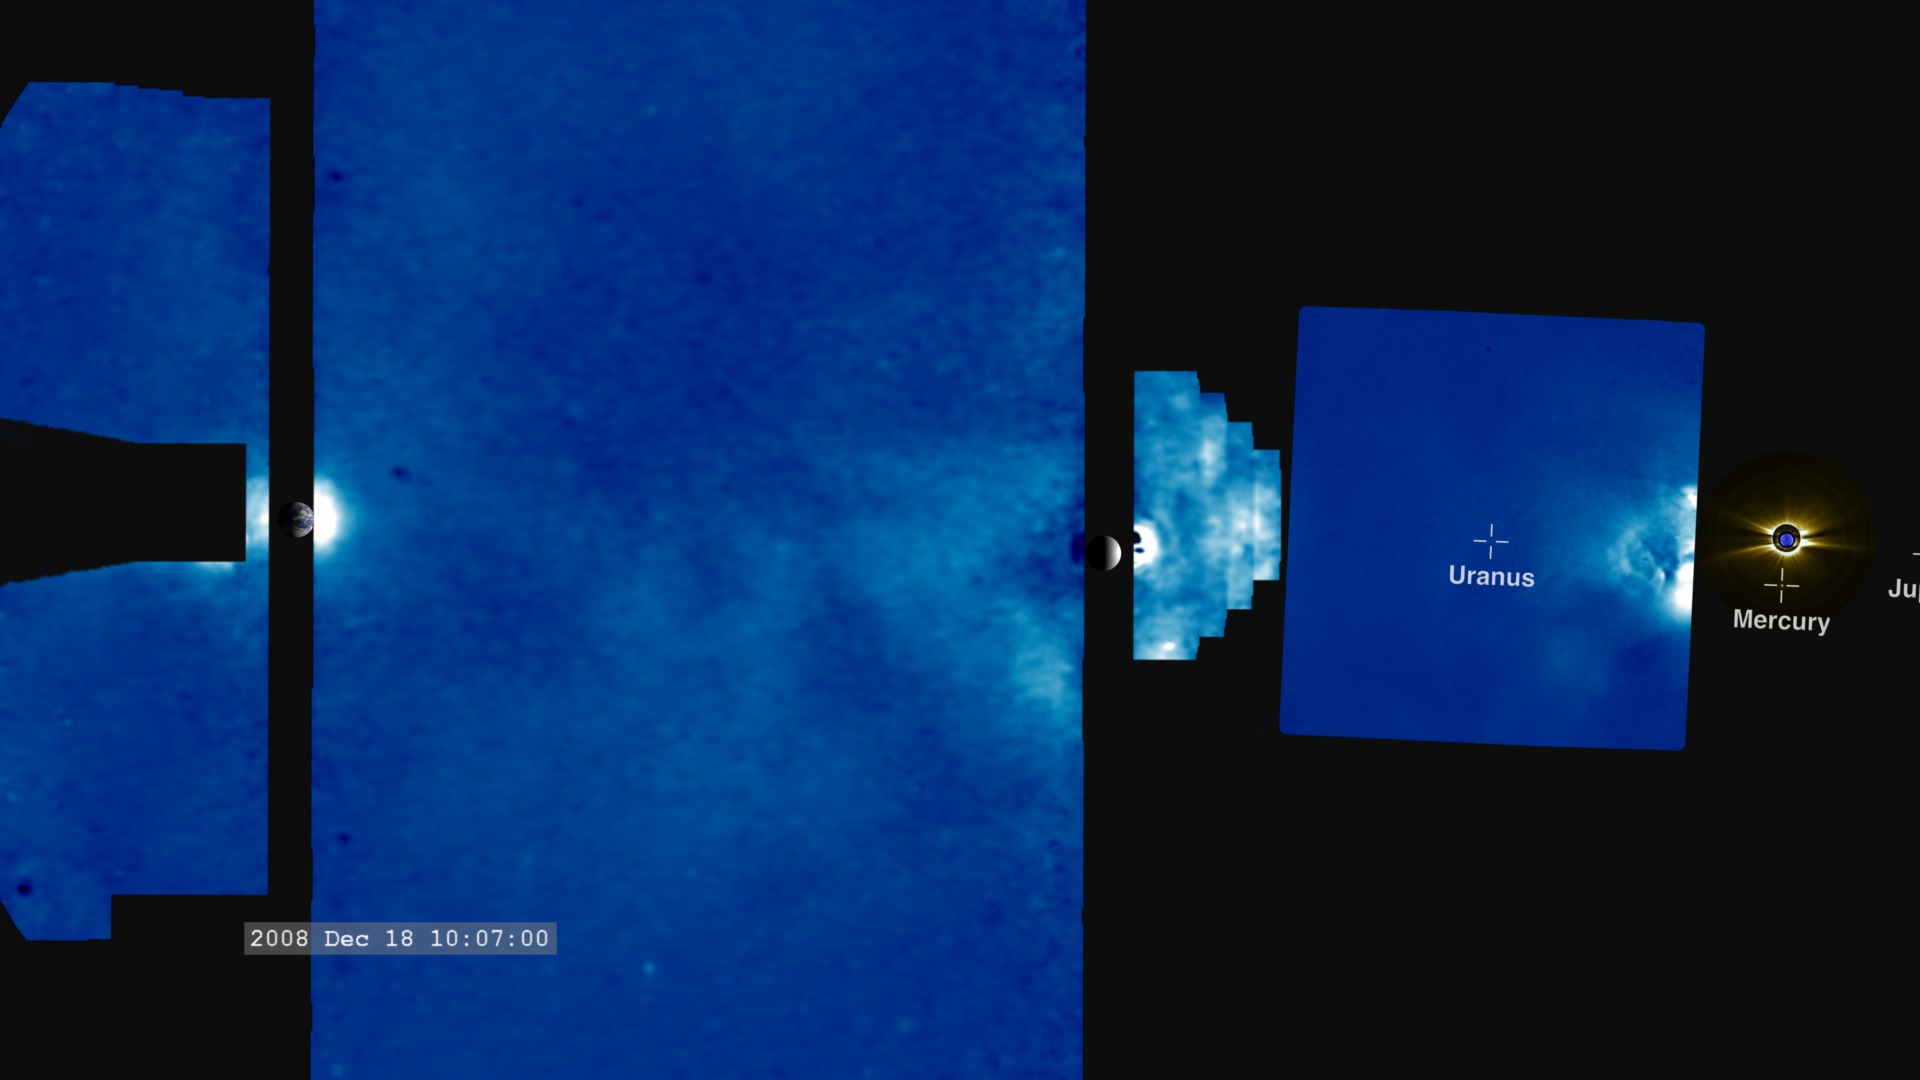
From the Sun to the Earth: The View from STEREO-A with no CME Enhancement
Go to this pageThis visualization shows the original dataset from STEREO-A used to extract the motion of the coronal mass ejection (CME) in ID 3890. The data are combined from the SECCHI instrument, which includes an ultraviolet image of the Sun (EUVI), two coronographs (COR-1 & COR-2), and the wide-angle Heliospheric Imagers (HI-1 & HI-2).On this scale, the CME is so faint as to be invisible. However, the Heliospheric Imagers support such a broad range of image intensity that it is possible to observe the CME propagating through the field of view by computing differences of images with the preceeding image. This process is shown in animation #3890.The Earth (left side) and Venus (middle) are so bright as to 'bloom' along the readout line of the CCD (Charge-coupled device) pixels, which creates the bright vertical lines that move slightly with time. The dark shape on the left of the field of view is created by an occulting tab that was installed to (occasionally) hide the bright Earth in the view.The little cross markers label three other planets in the view of STEREO. Uranus is almost invisible in the scale of this imagery, but is visible in full-resolution datasets. ||
- ID: 4010 Visualization
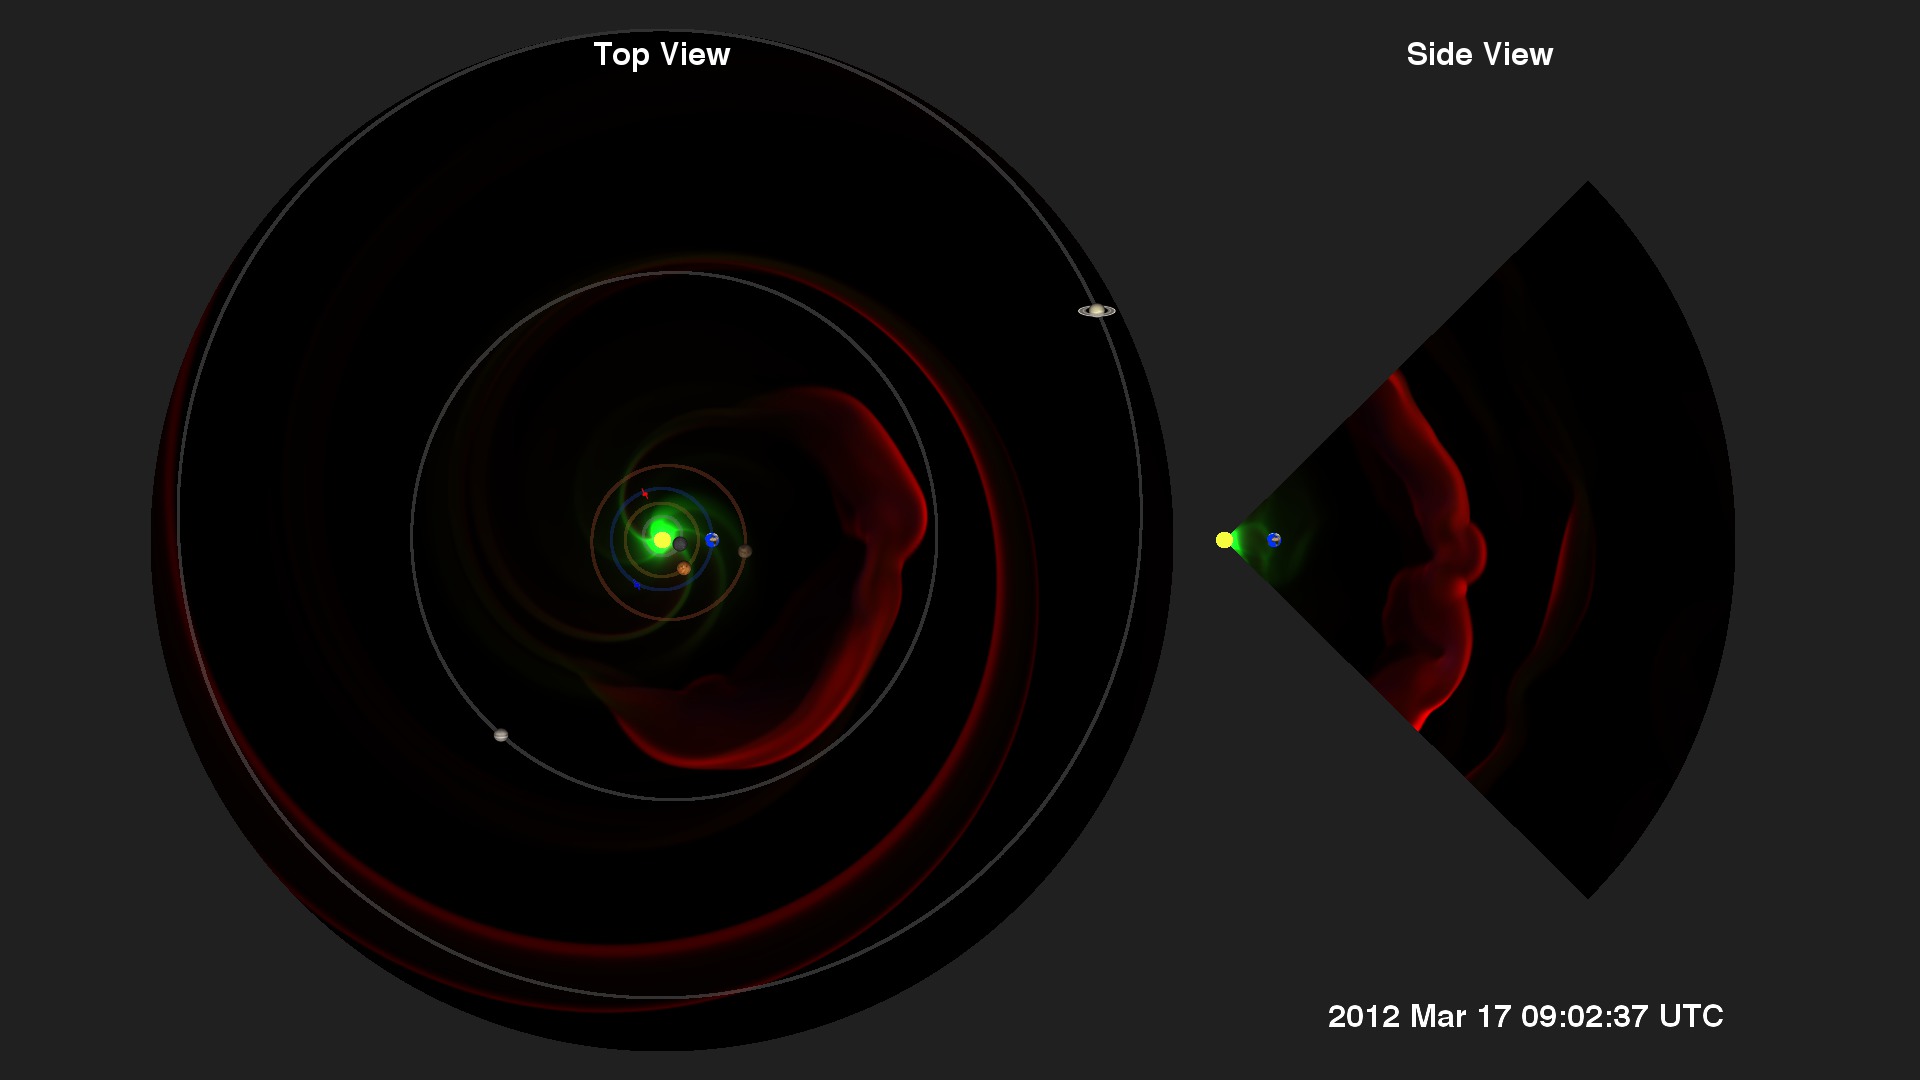
Space Weather Research: The CME of March 2012
Go to this pageForecasting space weather is of vital importance in protecting NASA assets around the solar system. For this reason, NASA routinely tests various space weather models at the Community-Coordinated Modeling Center (CCMC).This visualization is constructed from a computer model run of a coronal mass ejection (CME) launched from the sun in early March, 2012. The preliminary CME parameters were measured from instruments on the STEREO (the red and blue satellite icons) and SDO (in Earth orbit) satellites. The Enlil model was used to propagate those parameters through the solar system. From this model, they can estimate the strength and time of arrival of the CME at various locations around the solar system. This allows other missions to either safe-mode their satellites for protection, or allow them to conduct measurements to test the accuracy of the model. ||
- ID: 4083 Visualization
CMEpalooza: The Complete Series
Go to this pageMid-May 2013 marked a series of active solar events, the likes of which have not been seen since near the peak of solar cycle 23 in October-November of 2003 (see Looking Back at 2003s Spooky Halloween Solar Storms).Five distinct coronal mass ejections, or CMEs, were launched from the sun from Active Regions AR 1748 starting May 13, 2013, through May 20, 2013. Some of the CMEs were associated with preceding M- and X-class flares. The CMEs were not a major threat to Earth technologies as most of them missed Earth, but they did impact various NASA satellites around the solar system. The last of the series of CMEs brushed by Earth. ||
- ID: 11003 Produced Video
Excerpt from "Dynamic Earth"
Go to this pageA giant explosion of magnetic energy from the sun, called a coronal mass ejection, slams into and is deflected completely by the Earth's powerful magnetic field. The sun also continually sends out streams of light and radiation energy. Earth's atmosphere acts like a radiation shield, blocking quite a bit of this energy.Much of the radiation energy that makes it through is reflected back into space by clouds, ice and snow and the energy that remains helps to drive the Earth system, powering a remarkable planetary engine — the climate. It becomes the energy that feeds swirling wind and ocean currents as cold air and surface waters move toward the equator and warm air and water moves toward the poles — all in an attempt to equalize temperatures around the world.A jury appointed by the National Science Foundation (NSF) and Science magazine has selected "Excerpt from Dynamic Earth" as the winner of the 2013 NSF International Science and Engineering Visualization Challenge for the Video category. This animation will be highlighted in the February 2014 special section of Science and will be hosted on ScienceMag.org and NSF.govThis animation was selected for the Computer Animation Festival's Electronic Theater at the Association for Computer Machinery's Special Interest Group on Computer Graphics and Interactive Techniques (SIGGRAPH), a prestigious computer graphics and technical research forum. This is an excerpt from the fulldome, high-resolution show 'Dynamic Earth: Exploring Earth's Climate Engine.' The Dynamic Earth dome show was selected as a finalist in the Jackson Hole Wildlife Film Festival Science Media Awards under the category "Best Immersive Cinema - Fulldome". ||
Carrington-Class Event
A collection of visualizations related to a REALLY BIG coronal mass ejection observed in July 2012.
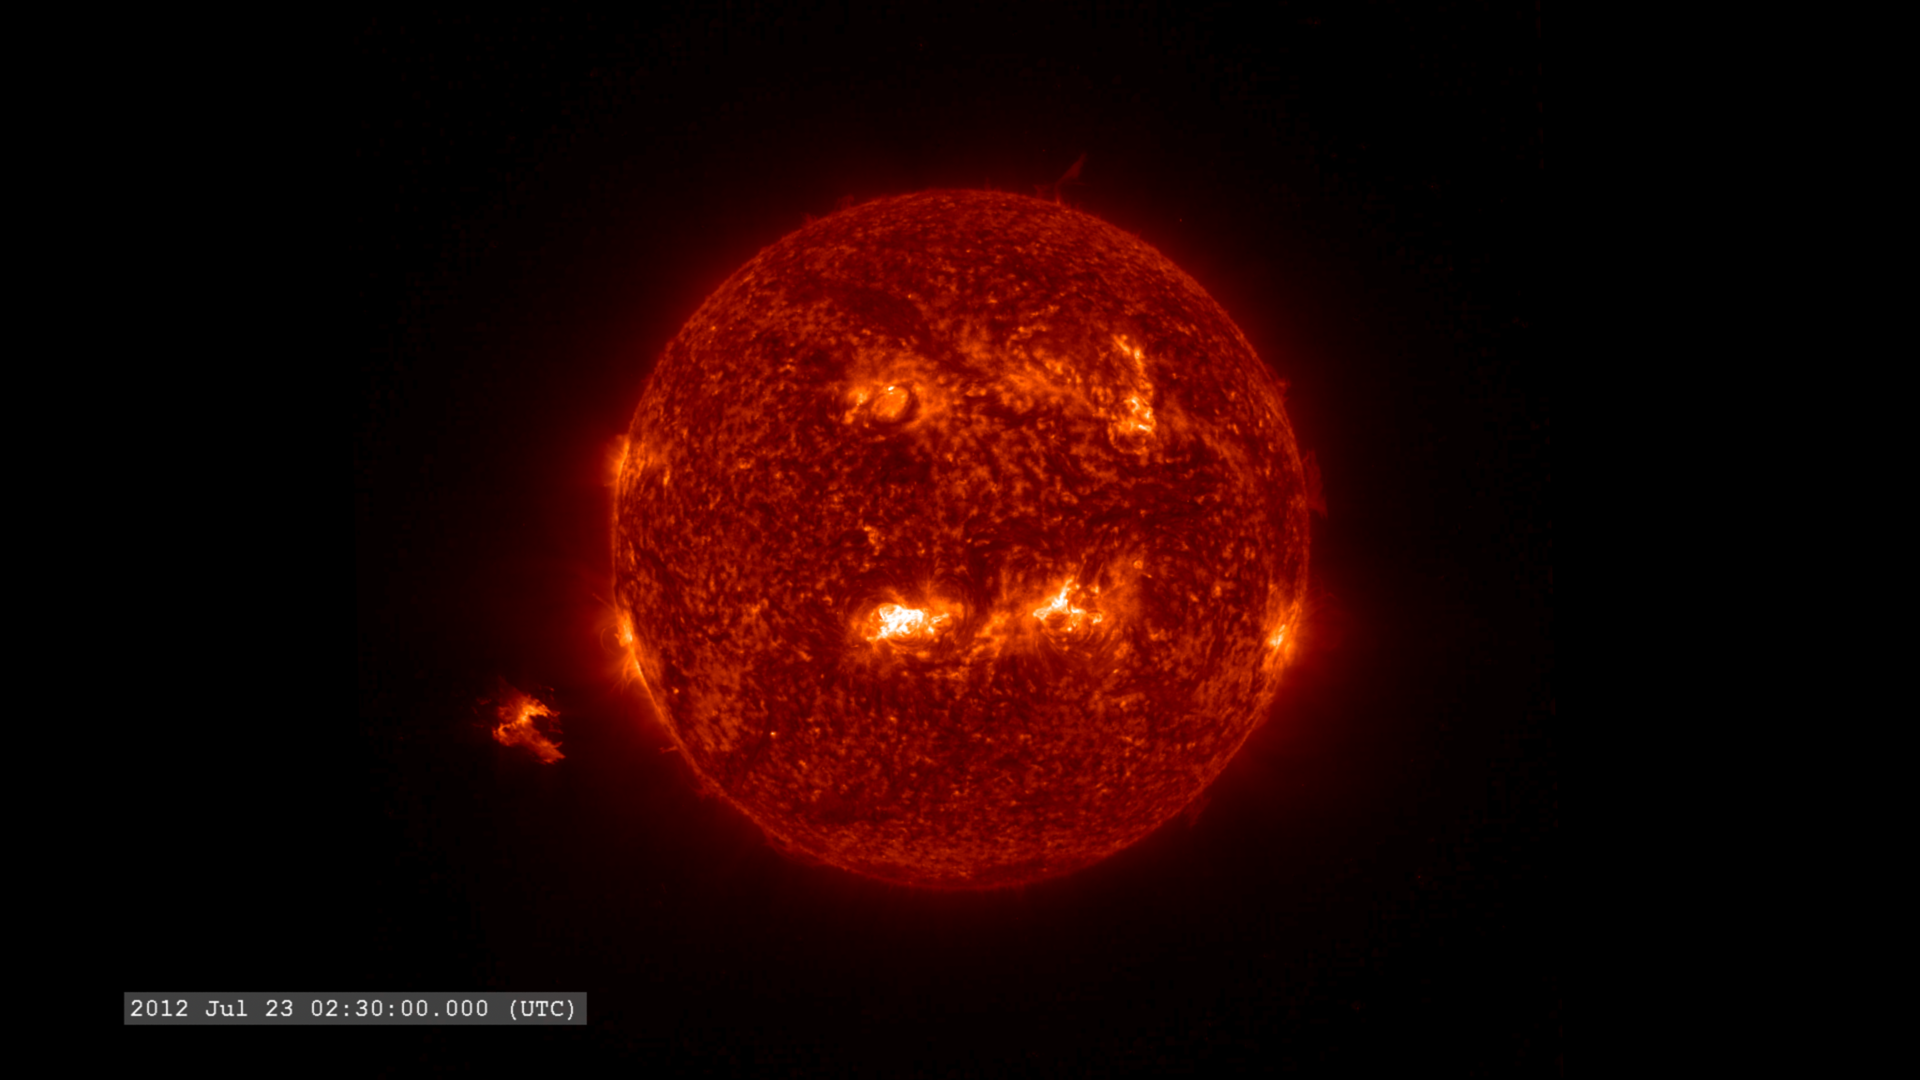
- ID: 4167 Visualization
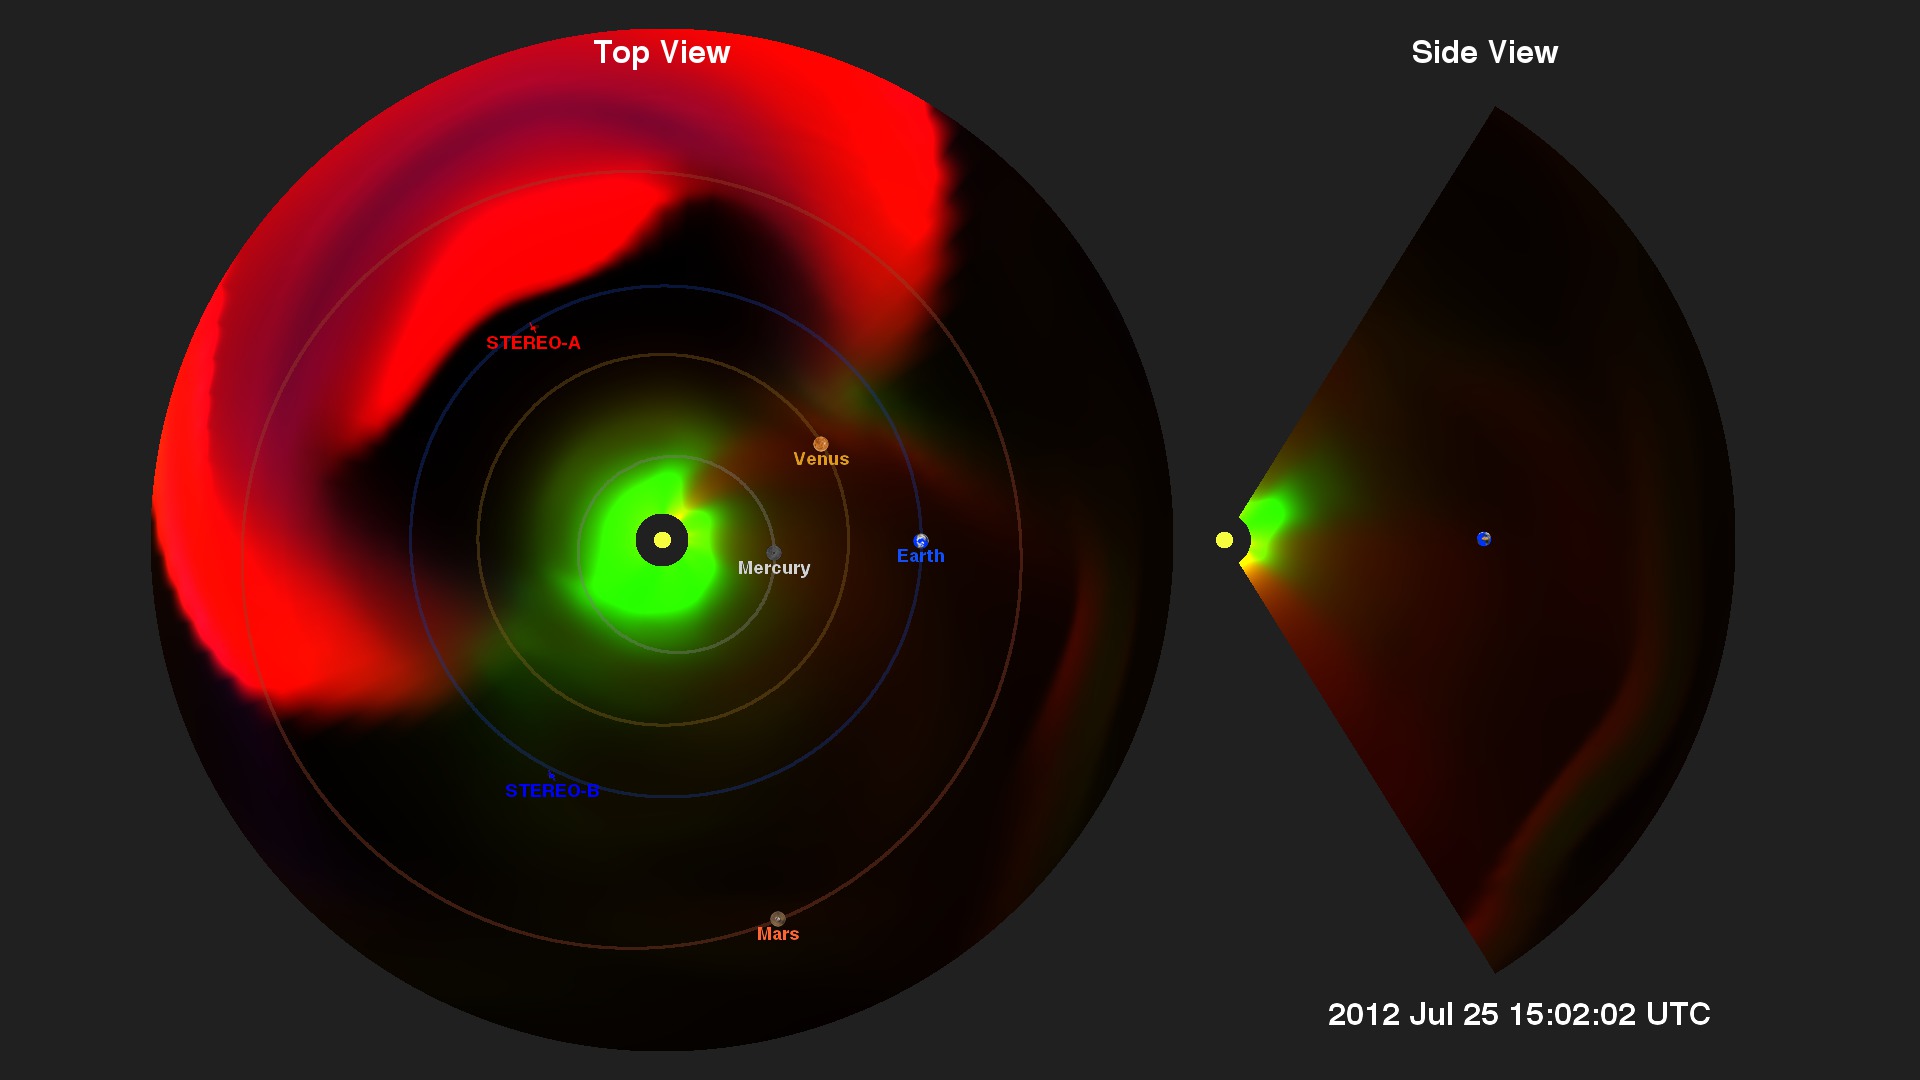
The Big CME that Missed Earth
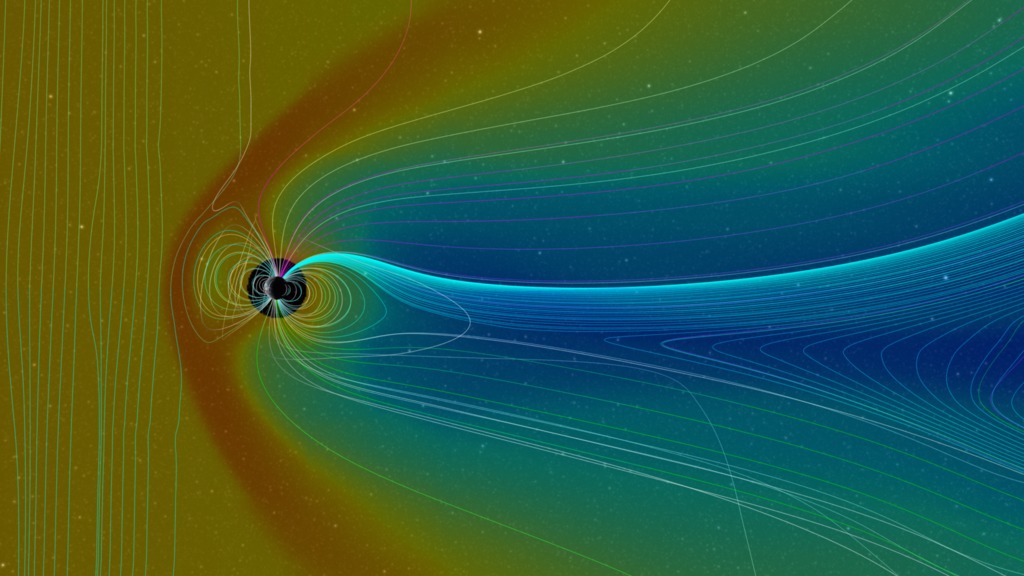
Go to this pageJuly of 2012 witnessed the eruption of a very large and fast solar coronal mass ejection (CME) (see NASA STEREO Observes One of the Fastest CMEs On Record and Carrington-class CME Narrowly Misses Earth ). While not directed at Earth, it was sufficiently large that it could have seriously disrupted the global electrical infrastructure. The event did impact STEREO-A of NASA's heliophysics fleet which provided a host of measurements (see Sentinels of the Heliosphere).One of the conditions which contributed to the high speed of this event is that two smaller CMEs were launched a little earlier, and these events cleared out much of the solar wind material, leaving little to slow the outflow of the July 23 event (UTC).In the visualizations below, generated from the Enlil space weather model, green represents particle density, usually protons and other ions. In green, we see the Parker spiral moving out from the sun generated by the sun's current sheet (Wikipedia). Red represents particles at high temperatures and shows the CME is hotter than the usual solar wind flow. Large changes in density are represented in blue. These three colors sometimes combine to tell us more about the characteristics of the event (noted in the 3-color Venn diagram below).However, if this CME had struck Earth's magnetosphere, which has a much stronger magnetic field, the changing magnetic field would induce much larger voltages in systems with long electrical conductors, such as power lines that run over long distances. These significantly higher voltages can damage power transformers. ||
- ID: 4188 Visualization
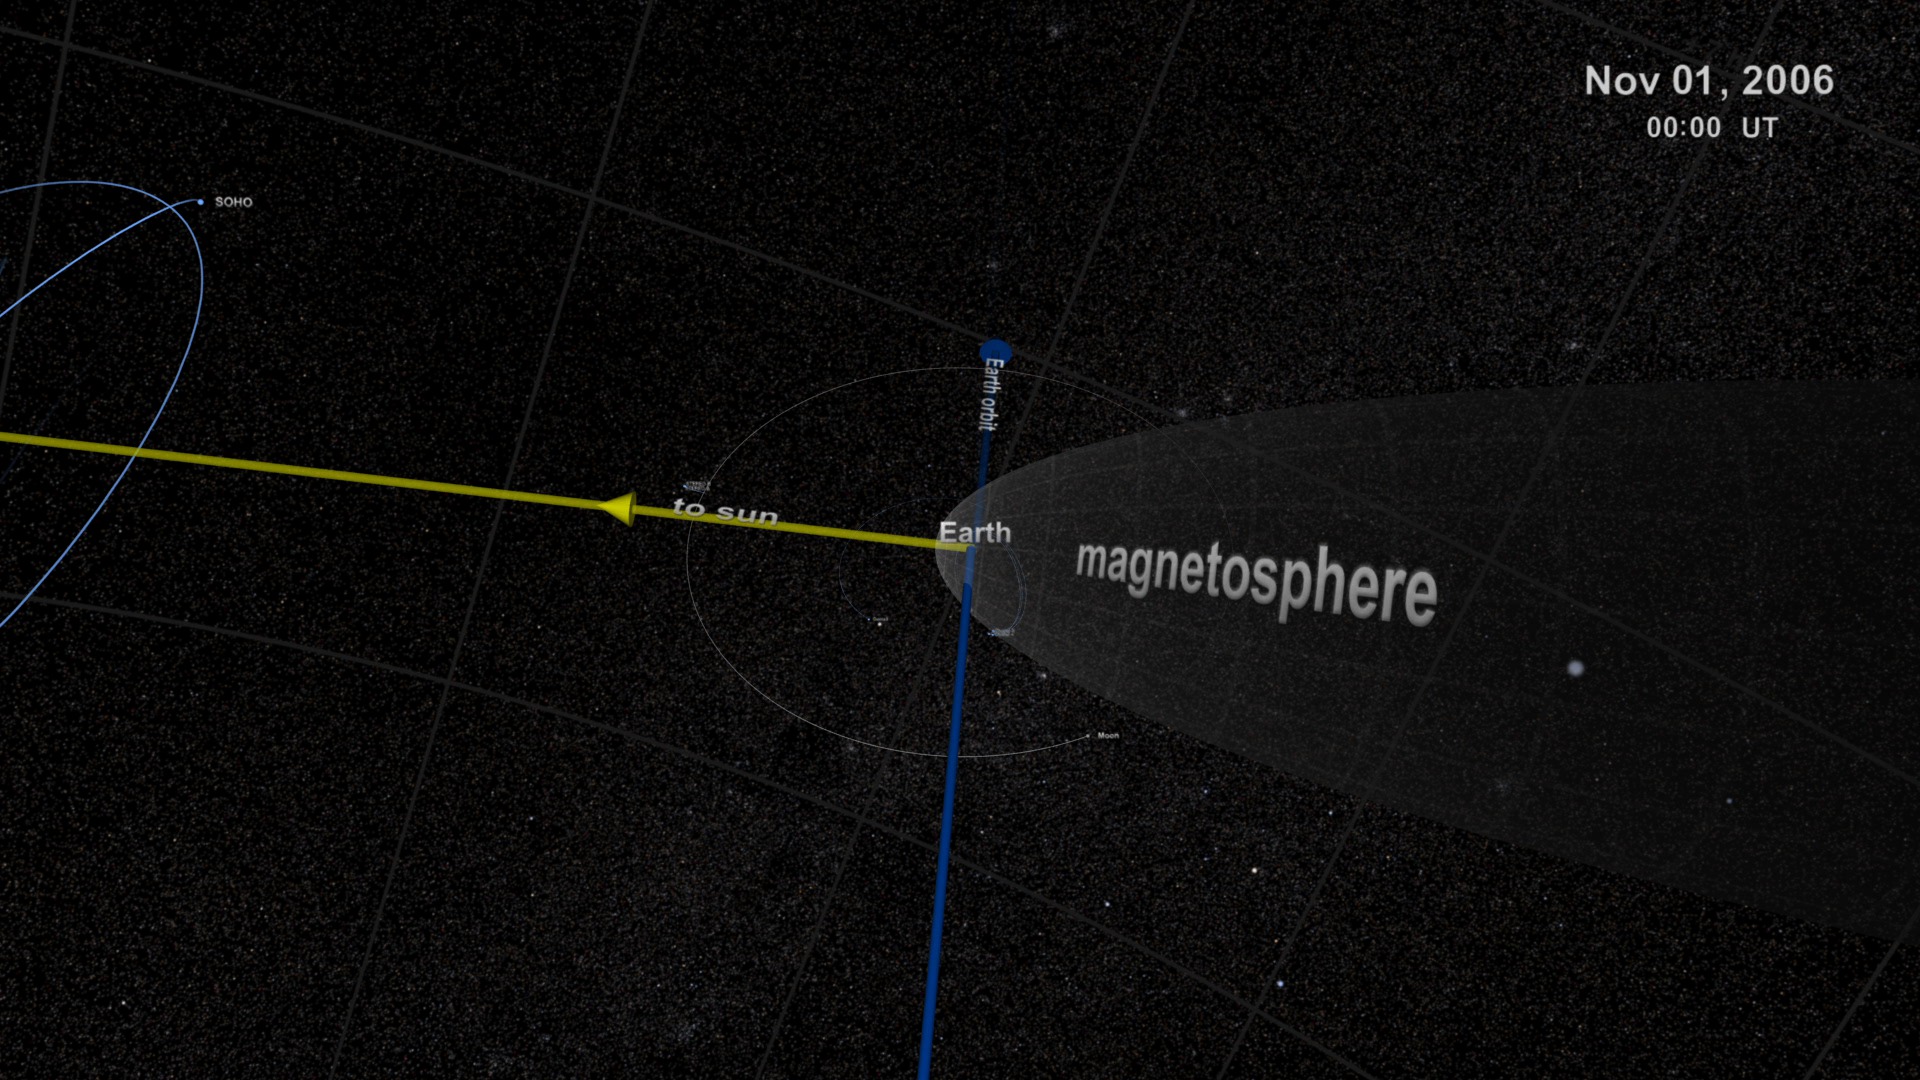
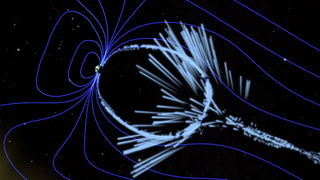
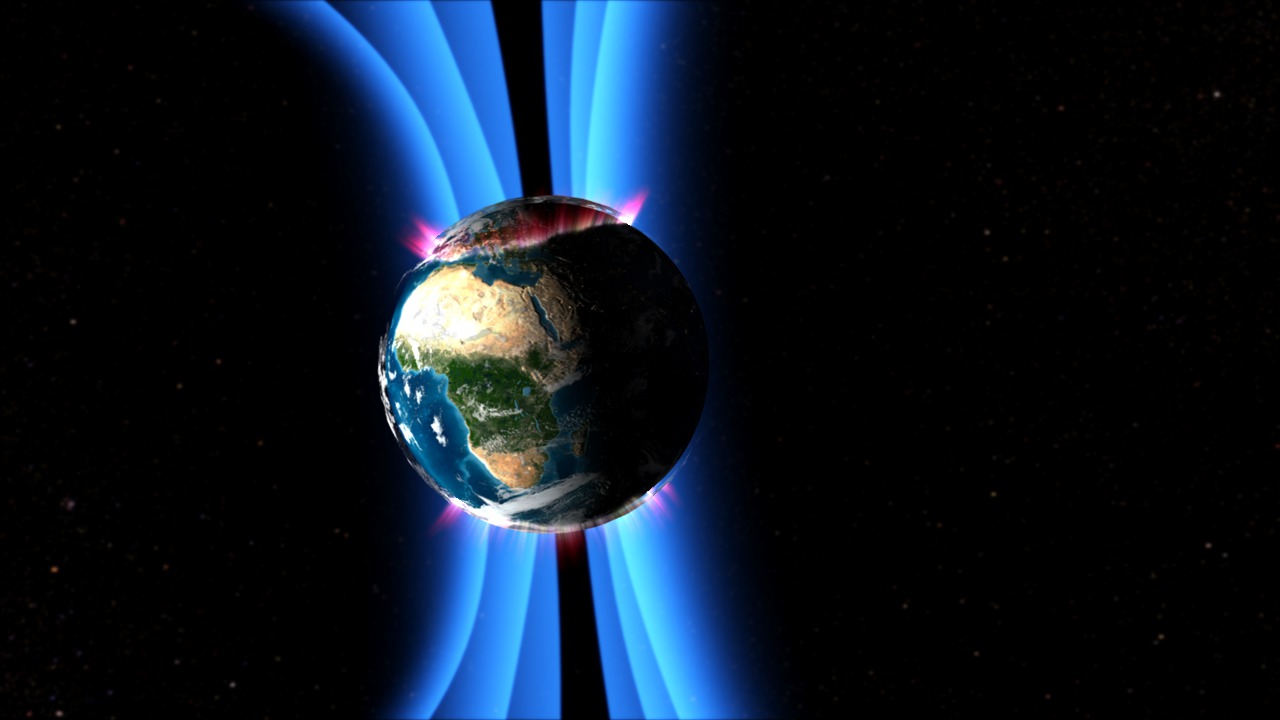
Comparative Magnetospheres: A Noteworthy Coronal Mass Ejection
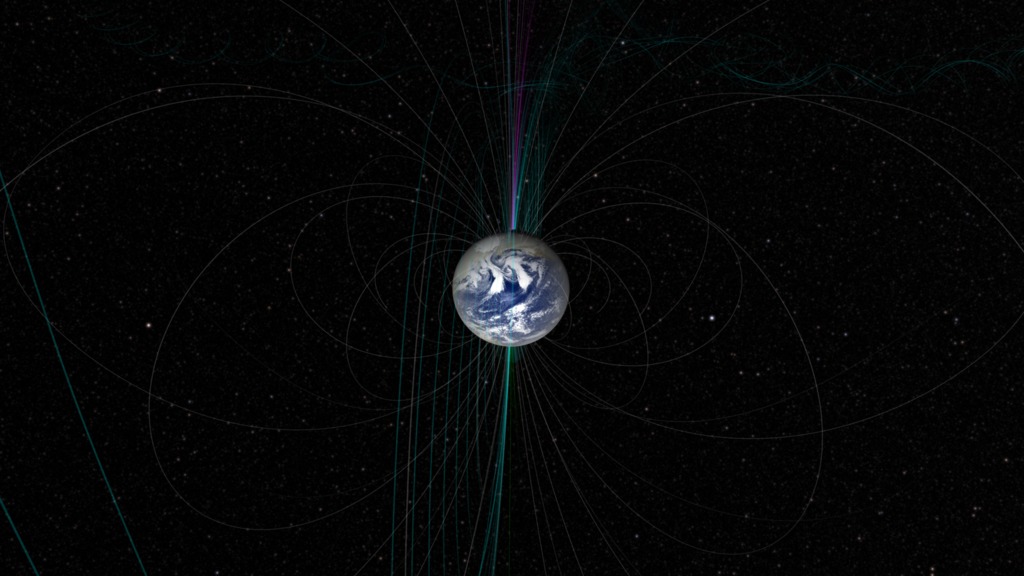
Go to this pageIn an effort to understand and predict the impact of space weather events on Earth, the Community-Coordinated Modeling Center (CCMC) at NASA Goddard Space Flight Center, routinely runs computer models of the many historical events. These model runs are then compared to actual data to determine ways to improve the model, and therefore forecasts of the impacts of future space weather events.In mid-December of 2006, the Sun erupted with a bright flare and coronal mass ejection (CME) that launched particles Earthward. While not the brightest or largest event observed, its impact on Earth was substantial, requiring some effort to protect satellites (ESA: Reacting to a solar flare).The visualization presented here is a CCMC run of a BATS-R-US model simulating the impact of this event on Earth. Here, lines are used to represent the 'flow direction' of magnetic field of the solar wind impacting Earth, as well as the effects on Earth's geomagnetic field. A 'cut-plane' through the data illustrates the changes in the particle density in the solar wind and magnetosphere. The color of the data represents a logarithmic scaling of density, with red as the highest (1000 particles per cubic centimeter) down to blue (0.01 particles per cubic centimeter). In this simulation, each frame of the movie corresponds to two minutes of real time.In the movie, we see vertical field lines of magnetic field carried by the solar wind, coming in from the left. As this field, and the plasma carrying it, strike Earth's magnetic field, they bend and reconnect, around the Earth. Some field lines actually reconnect to the polar regions of the Earth, providing a ready flow-path for particles to reach the ionosphere and generate aurora. This interaction between the solar wind and the plasma trapped in Earth's magnetosphere also creates a density enhancement between Earth and the solar wind helping to shield Earth from some of the effects. A lower density wake forms behind Earth (the blue region). There is a circular 'hole' around the Earth which is a gap in the model. ||
- ID: 4189 Visualization
Comparative Magnetospheres: A Carrington-Class CME
Go to this pageIn an effort to understand and predict the impact of space weather events on Earth, the Community-Coordinated Modeling Center (CCMC) at NASA Goddard Space Flight Center, routinely runs computer models of the many historical events. These model runs are then compared to actual data to determine ways to improve the model, and therefore forecasts of the impacts of future space weather events.But sometimes we don't have an actual event where we have lots of data for comparison. Extreme space weather events are one example where we must test models with a rather limited set of data.This is a model run used to examine the consequences if a large coronal mass ejection (CME) such as The Carrington-Class CME of 2012 had actual hit Earth. Such model runs allow us to estimate consequences of a large event hitting Earth so we can better protect power grids and satellites.Some of the conclusions from this model run are (documented in the paper linked below):The magnetopause is compressed to the point it is moved inside the orbits of our geosynchronous satellites.Large field-aligned currents are created on the night-side of Earth, generating large ionospheric potentials.At high latitudes, geo-electric fields of 26 volts per kilometer can be generated.For comparison, the geo-electric field of the March 1989 storm which generated an extensive power outage in Canada (Wikipedia) had a value of only about 6 volts per kilometer; and the 2003 Halloween solar storms (see Halloween Solar Storms 2003) generated a field of about 12 volts per kilometer. ||
- ID: 4172 Visualization
As Seen by SDO: The Carrington-Class CME of 2012
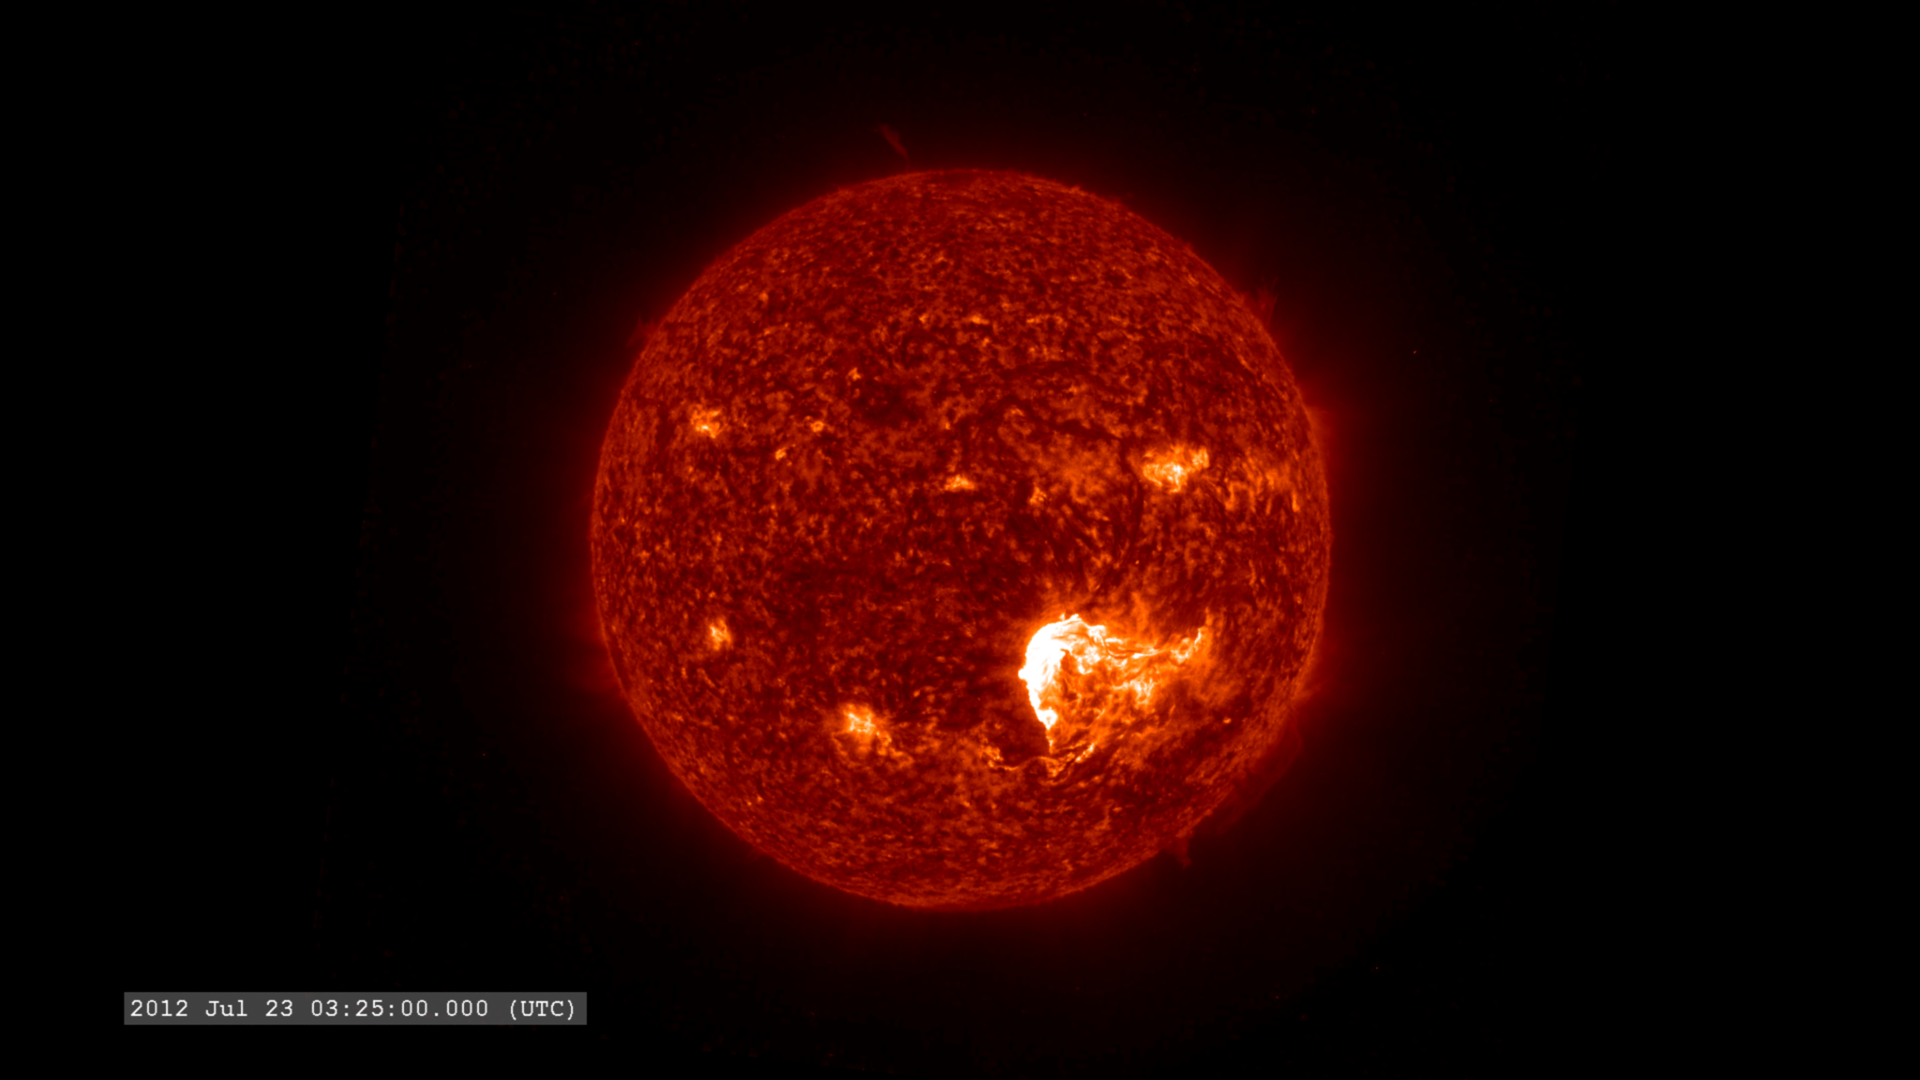
Go to this pageWhile SDO did not have a direct view of the region which launched the large coronal mass ejection (CME) of July 23, 2012, it still managed to catch a glimpse of the solar plasma as it launched into space. The eruption becomes visible at timestamp 02:14:24 UTC in the lower right side of the movies below. ||
- ID: 4177 Visualization
As Seen by STEREO-A: The Carrington-Class CME of 2012
Go to this pageSTEREO-A, at a position along Earth's orbit where it has an unobstructed view of the far side of the Sun, could clearly observe possibly the most powerful coronal mass ejection (CME) of solar cyle 24 on July 23, 2012. The visualizations on this page cover the entire day.We see the flare erupt in the lower right quadrant of the solar disk from a large active region. The material is launched into space in a direction towards STEREO-A. This creates the ring-like 'halo' CME visible in the STEREO-A coronagraph, COR-2 (blue circular image).As the CME expands beyond the field of view of the COR-2 imager, the high energy particles reach STEREO-A, creating the snow-like noise in the image. The particles also strike the HI-2 imager (blue square) brightening the image.The HI-1 imager has had 'bloom removal' enabled and filled with contents of the immediately previous HI-1 image, which creates a linear artifact above and below bright stars and planets. ||
- ID: 4178 Visualization
As Seen by STEREO-B: The Carrington-Class CME of 2012
Go to this pageLike SDO, STEREO-B did not have a direct view of the coronal mass ejection (CME) launched by the sun on July 23, 2012. However, the active region involved was very close to the limb of the sun (lower left quadrant) and STEREO-B provided an excellent view of plasma launched in both ultraviolet light and the white-light coronagraph. ||
Halloween 2003 Solar Storms from SOHO
Over a week of heavy solar activity from the solar maximum from solar cycle 23.
- ID: 3566 Visualization
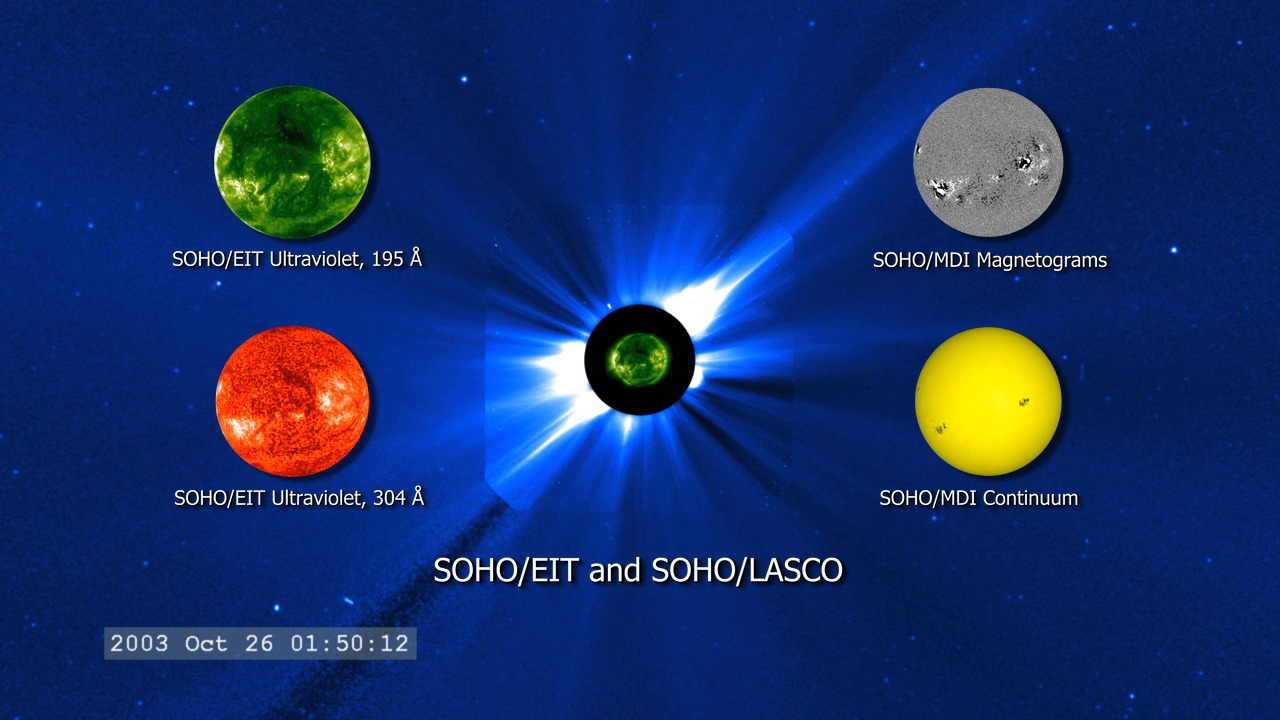
Multi-Sun Composition
Go to this pageThis movie is a composition of multiple solar datasets synchronized in time. The time frame is late October and early November of 2003, the time of some record-breaking solar activity.The background of the movie shows the view of the wide-angle coronagraphs (blue/white), or LASCO instruments, aboard SOHO. They show streams of electrons outbound from the Sun, part of the solar atmosphere. The central green image is the Sun in ultraviolet light from the EIT instrument. Note that flashes of solar flares in the ultraviolet quickly propagate out from the Sun and are visible in LASCO. These events are coronal mass ejections, or CMEs.Overlaid on the upper left is a better view of the EIT ultraviolet image at a wavelength of 195 angstroms (19.5 nanometers).On the lower left, the orange movie is the EIT ultraviolet movie at 304 angstroms (30.4 nanometers).On the upper right is a solar magnetogram, taken by the MDI instrument. The white regions correspond to positive (north) magnetic flux and the dark regions to negative (south) magnetic flux.The colors for the sequences above are not real. They are chosen by convention since the properties recorded by the cameras are not visible to the human eye.The final image on the lower right is also from MDI. It is a combination of several optical wavelengths and is the best representation from SOHO of the Sun in visible light, as we would see it through ground-based telescopes.The movies that are part of this composition are also available individually on the SVS site: Halloween Solar Storms 2003: SOHO/EIT and SOHO/LASCOHalloween Solar Storms 2003: SOHO/EIT Ultraviolet, 195 angstromsHalloween Solar Storms 2003: SOHO/EIT Ultraviolet, 304 angstromsHalloween Solar Storms 2003: SOHO/MDI ContinuumHalloween Solar Storms 2003: SOHO/MDI Magnetograms ||
- ID: 3500 Visualization
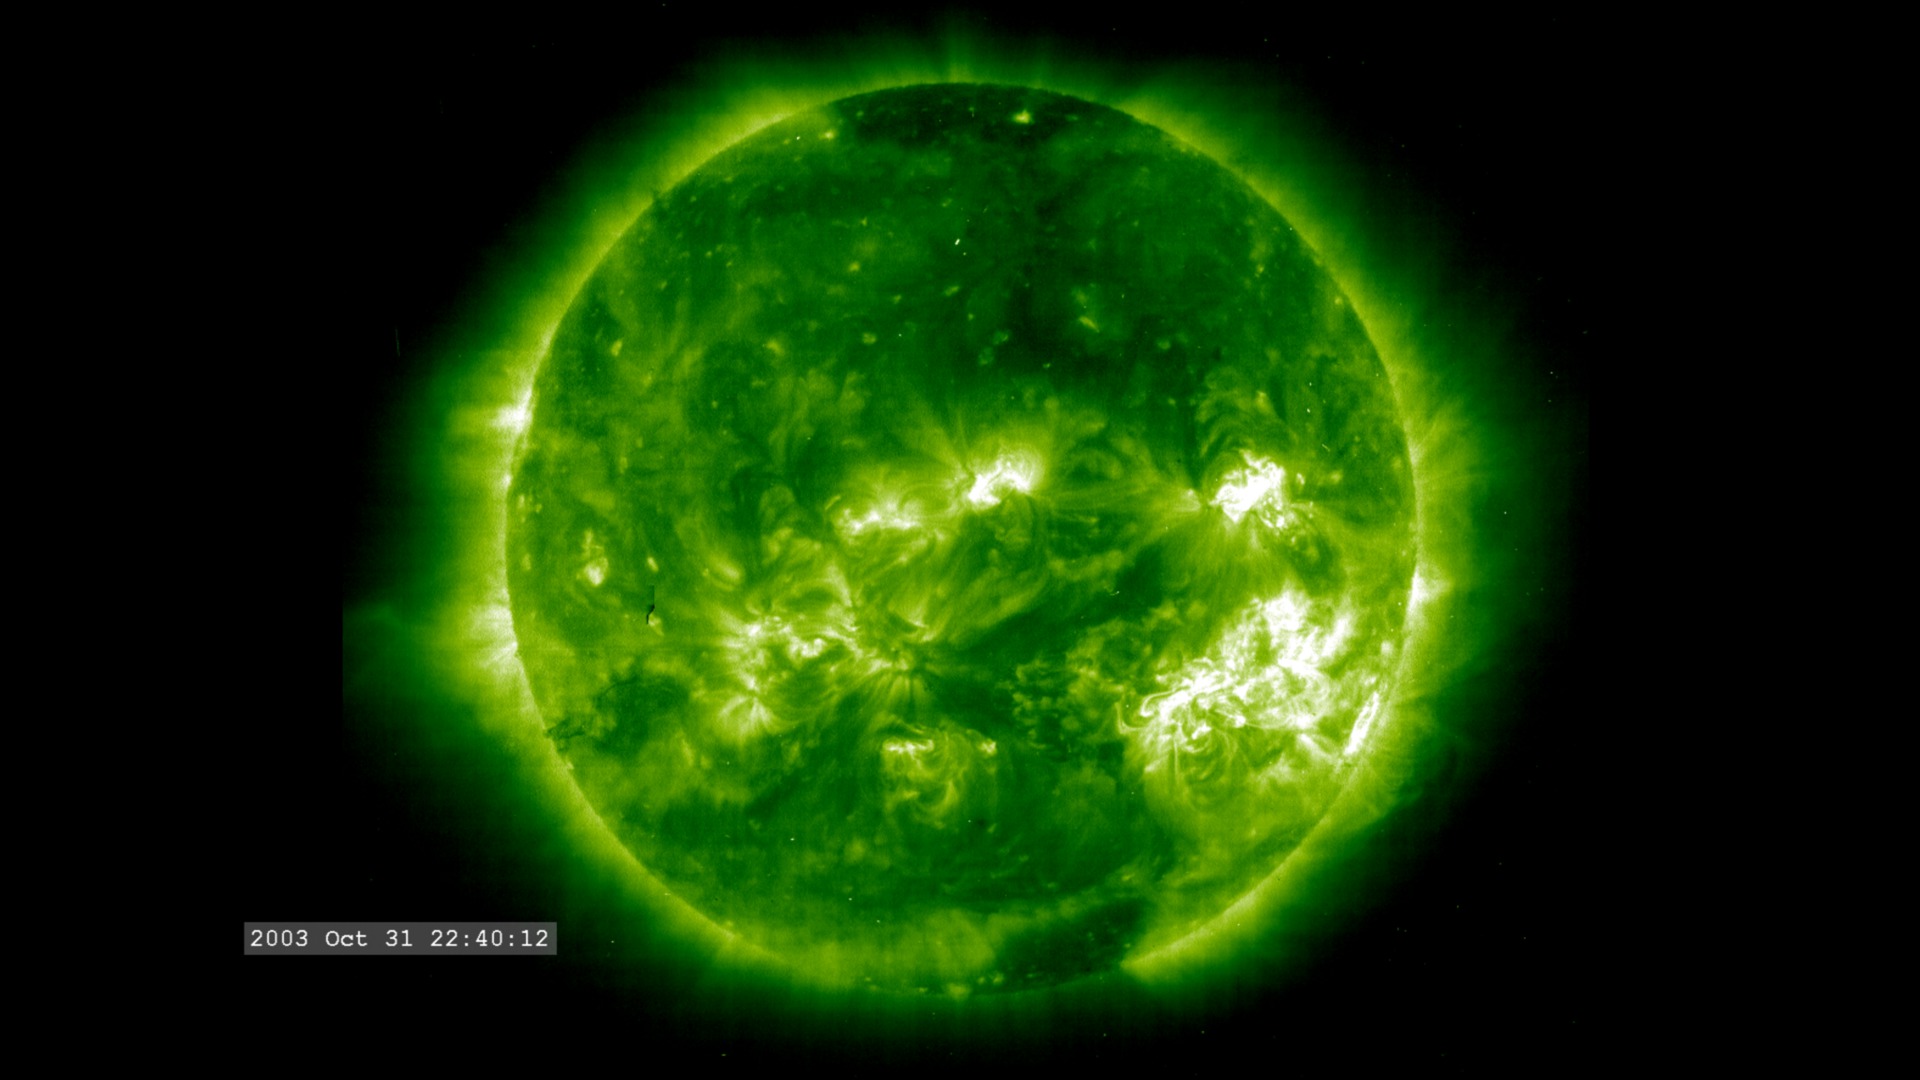
Halloween 2003 Solar Storms: SOHO/EIT Ultraviolet, 195 Angstroms
Go to this pageHere is a view of the full solar disk during a two-week period in October and November of 2003 which exhibited some of the largest solar activity events since the advent of space-based solar observing. The Extreme ultraviolet Imaging Telescope (EIT) collects solar images in an extremely short wavelength of ultraviolet light, not visible from the surface of the Earth. The narrow wavelength band at 195 angstroms corresponds (19.5 nanometers) corresponds to a spectral line of multiply-ionized iron atoms. This movie is part of a series of movies with matching cadence designed to play synchronously with each other. The other movies in this series are Halloween 2003 Solar Storms: SOHO/EIT Ultraviolet, 304 A Halloween 2003 Solar Storms: SOHO/MDI Continuum Halloween 2003 Solar Storms: SOHO/MDI Magnetograms Halloween 2003 Solar Storms: SOHO/EIT and SOHO/LASCO For more information, visit the SOHO project page. ||
- ID: 3501 Visualization
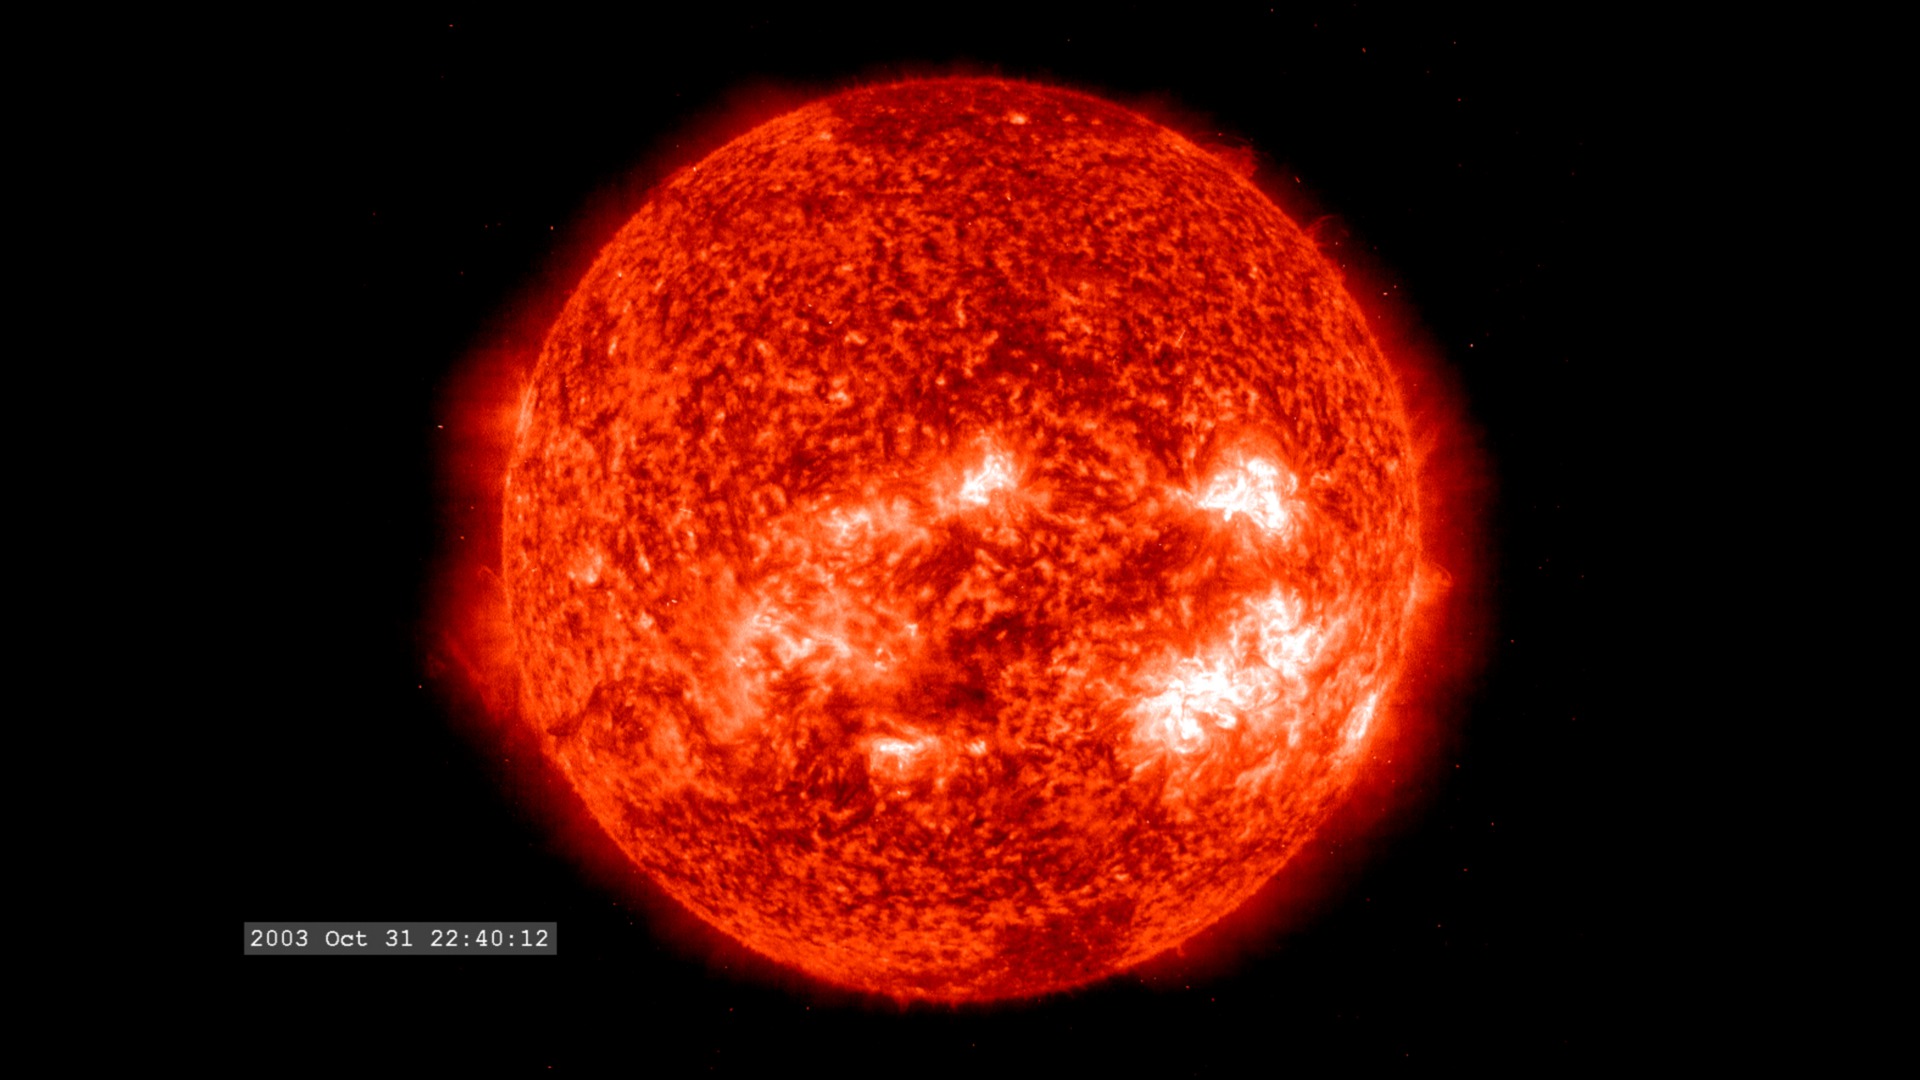
Halloween 2003 Solar Storms: SOHO/EIT Ultraviolet, 304 Angstroms
Go to this pageHere is a view of the full solar disk during a two-week period in October and November of 2003 which exhibited some of the largest solar activity events since the advent of space-based solar observing. The Extreme ultraviolet Imaging Telescope (EIT) collects solar images in an extremely short wavelength of ultraviolet light, not visible from the surface of the Earth. The narrow wavelength band at 304 Ångstroms corresponds (30.4 nanometers) corresponds to a spectral line of multiply-ionized iron atoms. This movie is part of a series of movies with matching cadence designed to play synchronously with each other. The other movies in this series are Halloween 2003 Solar Storms: SOHO/EIT Ultraviolet, 195 ÅHalloween 2003 Solar Storms: SOHO/MDI Continuum Halloween 2003 Solar Storms: SOHO/MDI Magnetograms Halloween 2003 Solar Storms: SOHO/EIT and SOHO/LASCO For more information, visit the SOHO project page. ||
- ID: 3502 Visualization
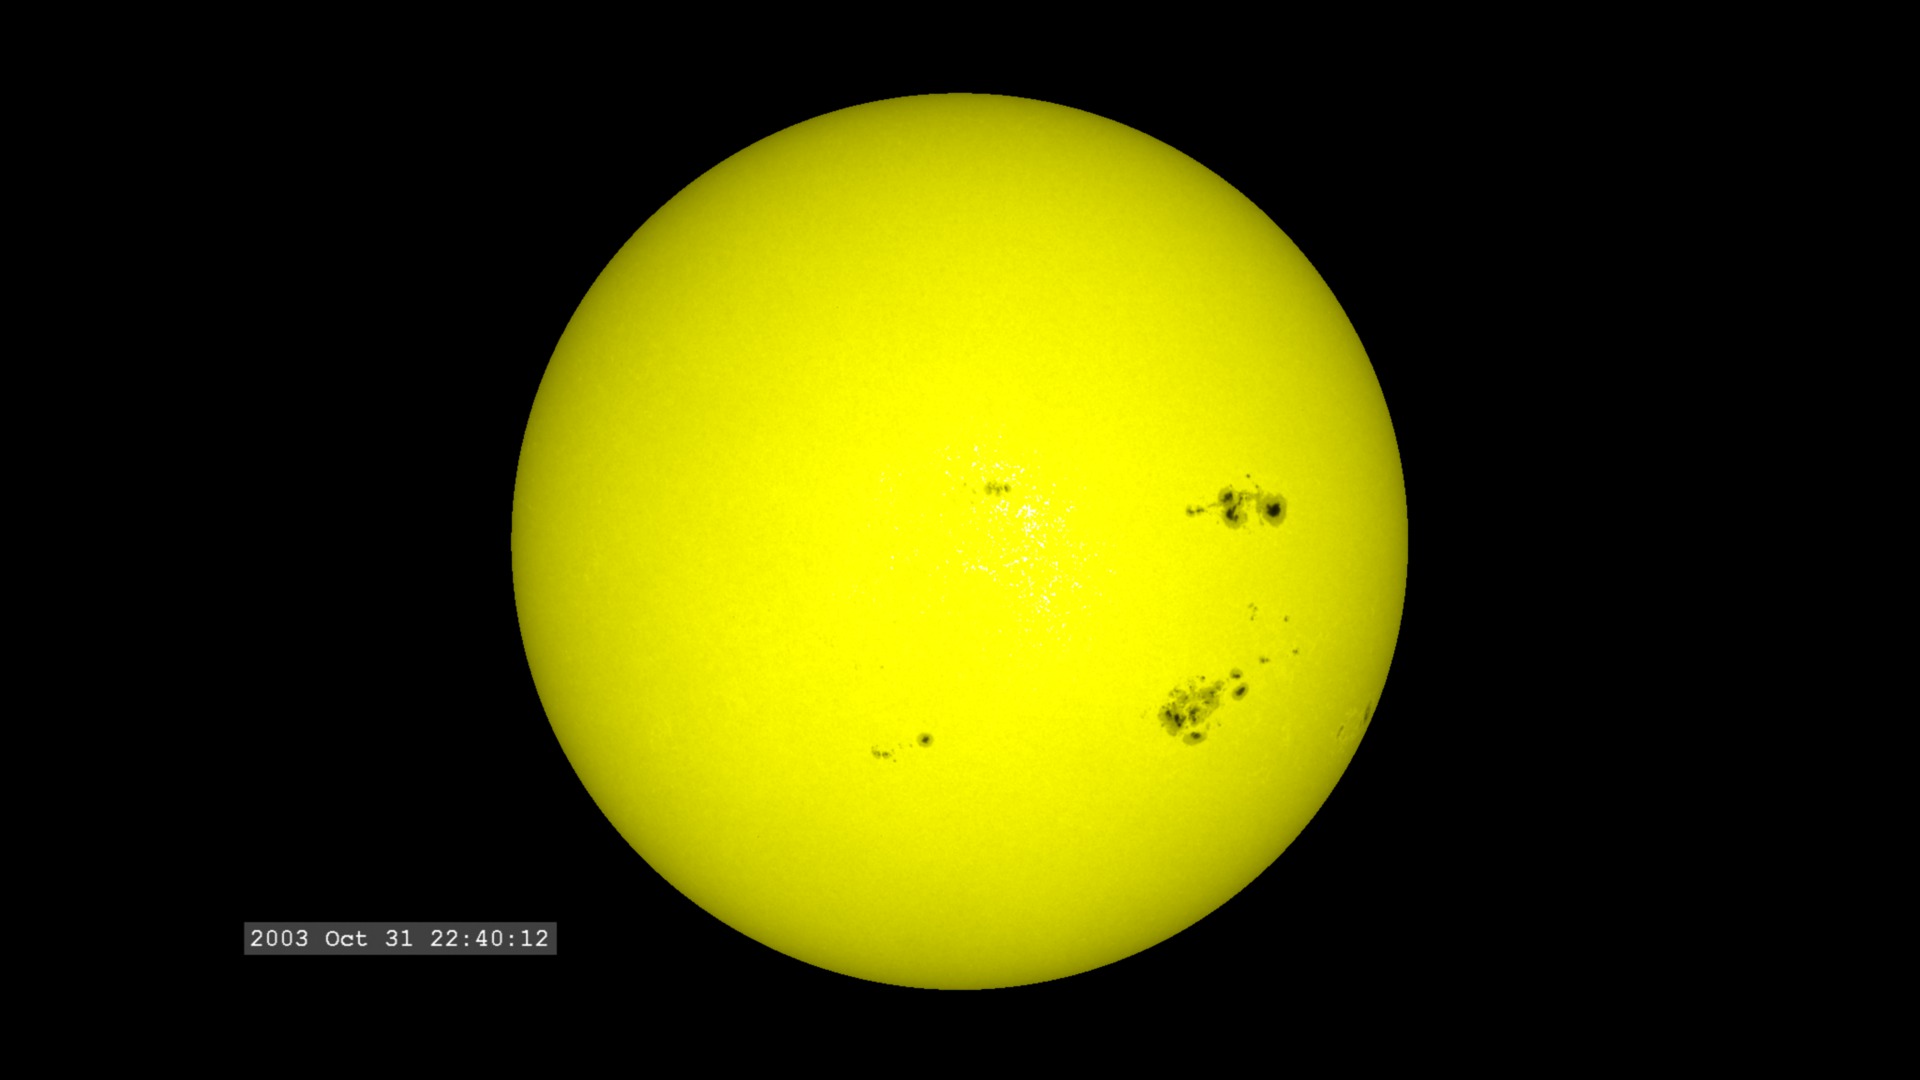
Halloween 2003 Solar Storms: SOHO/MDI Continuum
Go to this pageHere is a view of the full solar disk during a two-week period in October and November of 2003 which exhibited some of the largest solar activity events since the advent of space-based solar observing. The Michelson Doppler Interferometer (MDI) records images at several very narrow wavelength bands in the visible light. These images are often used as proxies for white-light solar images. This movie is part of a series of movies with matching cadence designed to play synchronously with each other. The other movies in this series are Halloween 2003 Solar Storms: SOHO/EIT Ultraviolet, 195 angstroms Halloween 2003 Solar Storms: SOHO/EIT Ultraviolet, 304 angstroms Halloween 2003 Solar Storms: SOHO/MDI Magnetograms Halloween 2003 Solar Storms: SOHO/EIT and SOHO/LASCO For more information, visit the SOHO project page. ||
- ID: 3503 Visualization
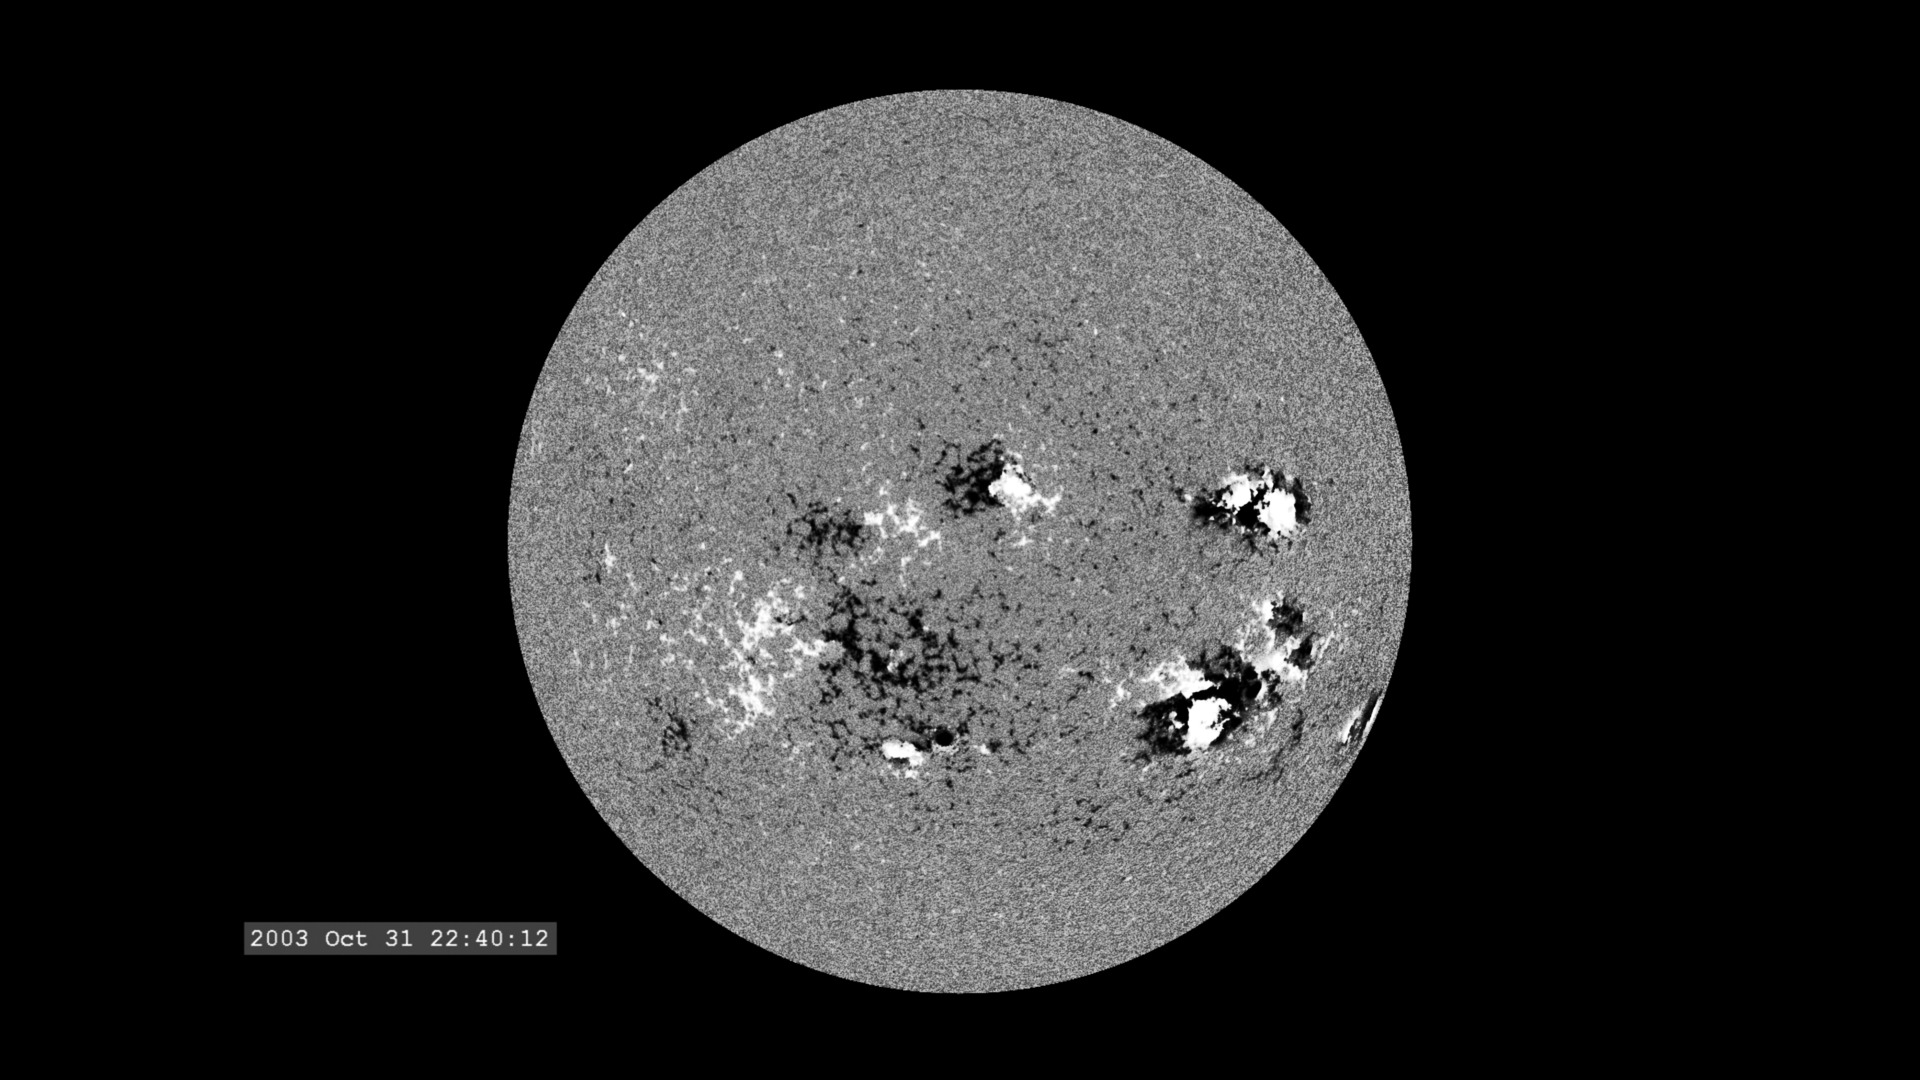
Halloween 2003 Solar Storms: SOHO/MDI Magnetograms
Go to this pageHere is a view of the full solar disk during a two-week period in October and November of 2003 which exhibited some of the largest solar activity events since the advent of space-based solar observing.The Michelson Doppler Interferometer (MDI) takes images of the Sun at five very narrow wavelength bands and four different polarizations in visible light. For this sequence, the images are processed in a form that reveals the magnetic field strength on the solar photosphere. Other combinations of the images act as white-light images and dopplergrams (which measure the velocity of the solar 'surface').This movie is part of a series of movies with matching cadence designed to play synchronously with each other. The other movies in this series are Halloween 2003 Solar Storms: SOHO/EIT Ultraviolet, 195 angstroms Halloween 2003 Solar Storms: SOHO/EIT Ultraviolet, 304 angstroms Halloween 2003 Solar Storms: SOHO/MDI Continuum Halloween 2003 Solar Storms: SOHO/EIT and SOHO/LASCO For more information, visit the SOHO project page.. ||
- ID: 3504 Visualization
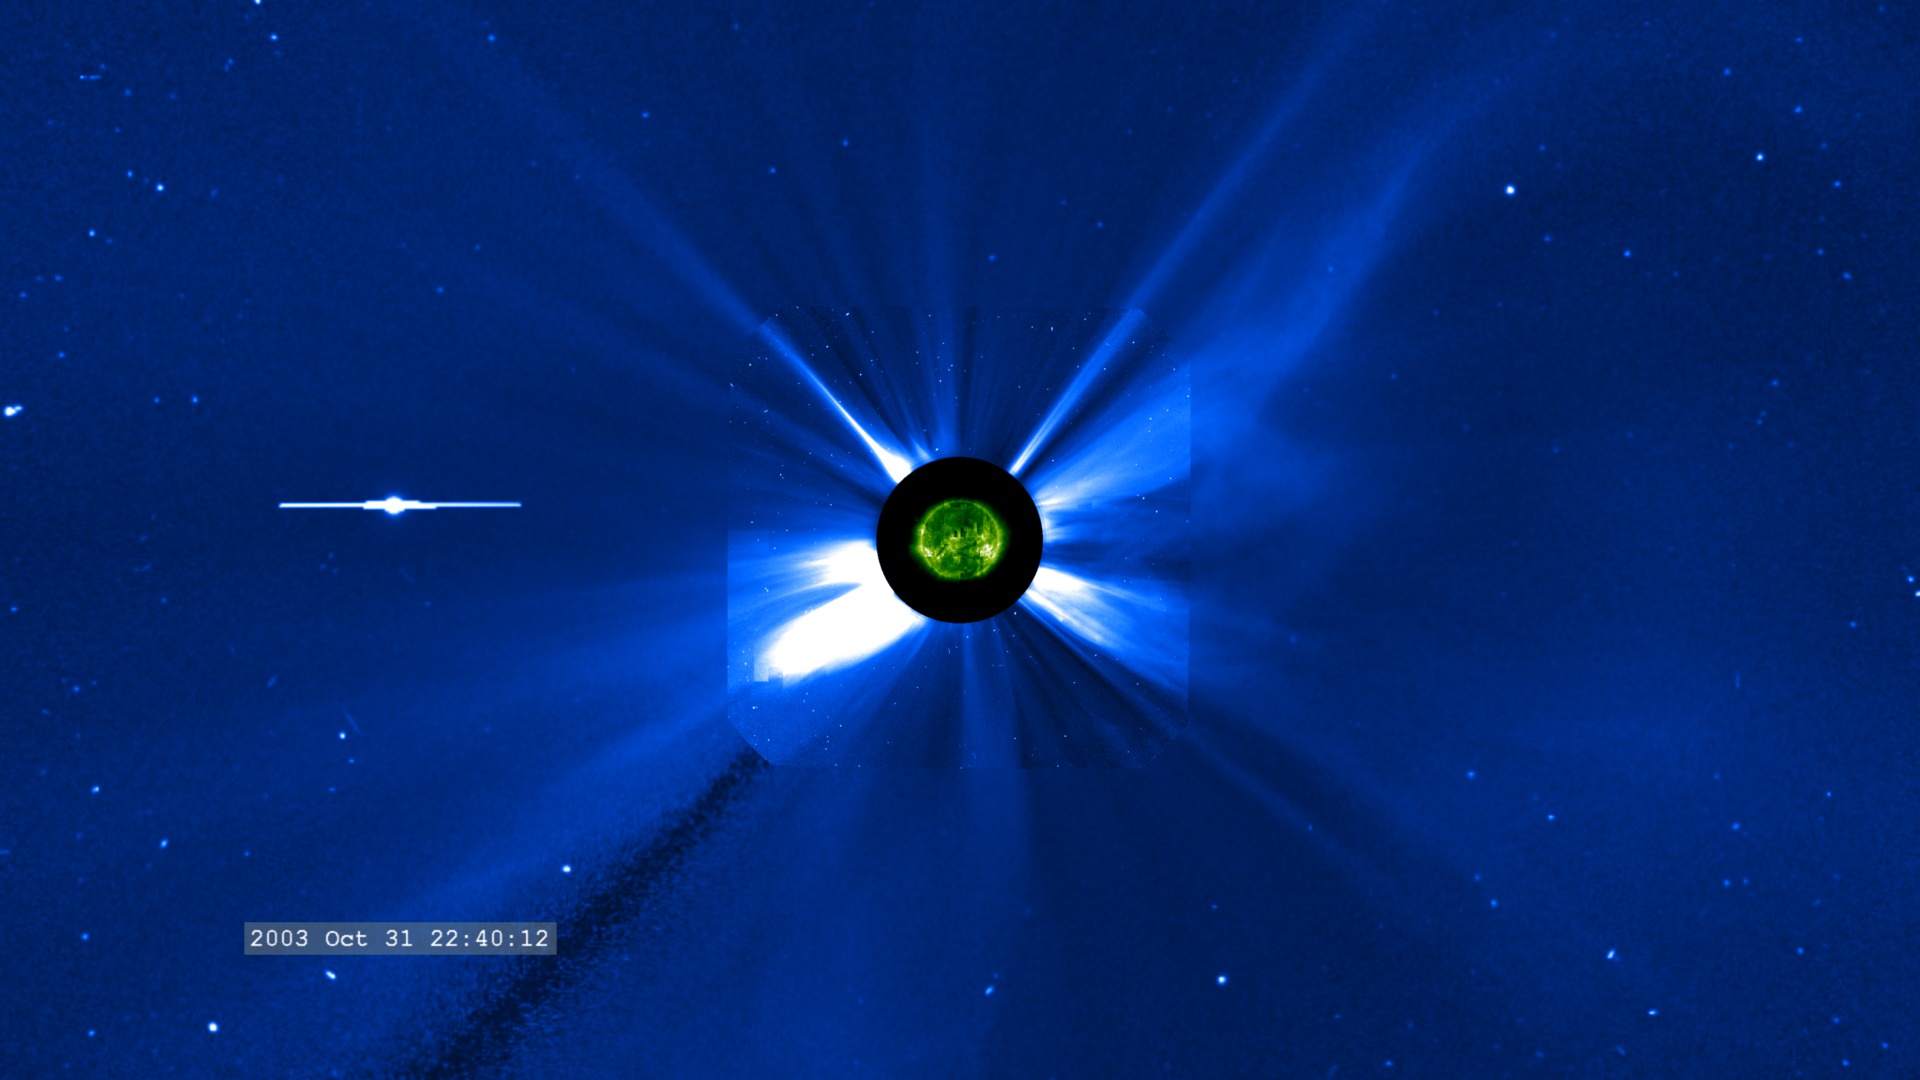
Halloween 2003 Solar Storms: SOHO/EIT and SOHO/LASCO
Go to this pageHere is a view of the solar disk in 195 Å ultraviolet light (colored green in this movie) and the Sun's extended atmosphere, or corona, (blue and white in this movie). The corona is visible to the SOHO/LASCO coronagraph instruments, which block the bright disk of the Sun so the significantly fainter corona can be seen. In this movie, the inner coronagraph (designated C2) is combined with the outer coronagraph (C3). This movie covers a two week period in October and November 2003 which exhibited some of the largest solar activity events since the advent of space-based solar observing.As the movie plays, we can observe a number of features of the active Sun. Long streamers radiate outward from the Sun and wave gently due to their interaction with the solar wind. The bright white regions are visible due to their high density of free electrons which scatter the light from the photosphere towards the observer. Protons and other ionized atoms are there as well, but are not as visible since they do not interact with photons as strongly as electrons. Coronal Mass Ejections (CMEs) are occasionally observed launching from the Sun. Some of these launch particle events which can saturate the cameras with snow-like artifacts.Also visible in the coronagraphs are stars and planets. Stars are seen to drift slowly to the right, carried by the relative motion of the Sun and the Earth. The planet Mercury is visible as the bright point moving left of the Sun. The horizontal 'extension' in the image is called 'blooming' and is due to a charge leakage along the readout wires in the CCD imager in the camera.This movie is part of a series of movies with matching cadence designed to play synchronously with each other. The other movies in this series are Halloween 2003 Solar Storms: SOHO/EIT Ultraviolet, 195 angstromHalloween 2003 Solar Storms: SOHO/EIT Ultraviolet, 304 angstromHalloween 2003 Solar Storms: SOHO/MDI Continuum Halloween 2003 Solar Storms: SOHO/MDI Magnetograms For more information, visit the SOHO project page.. ||
- ID: 3535 Visualization
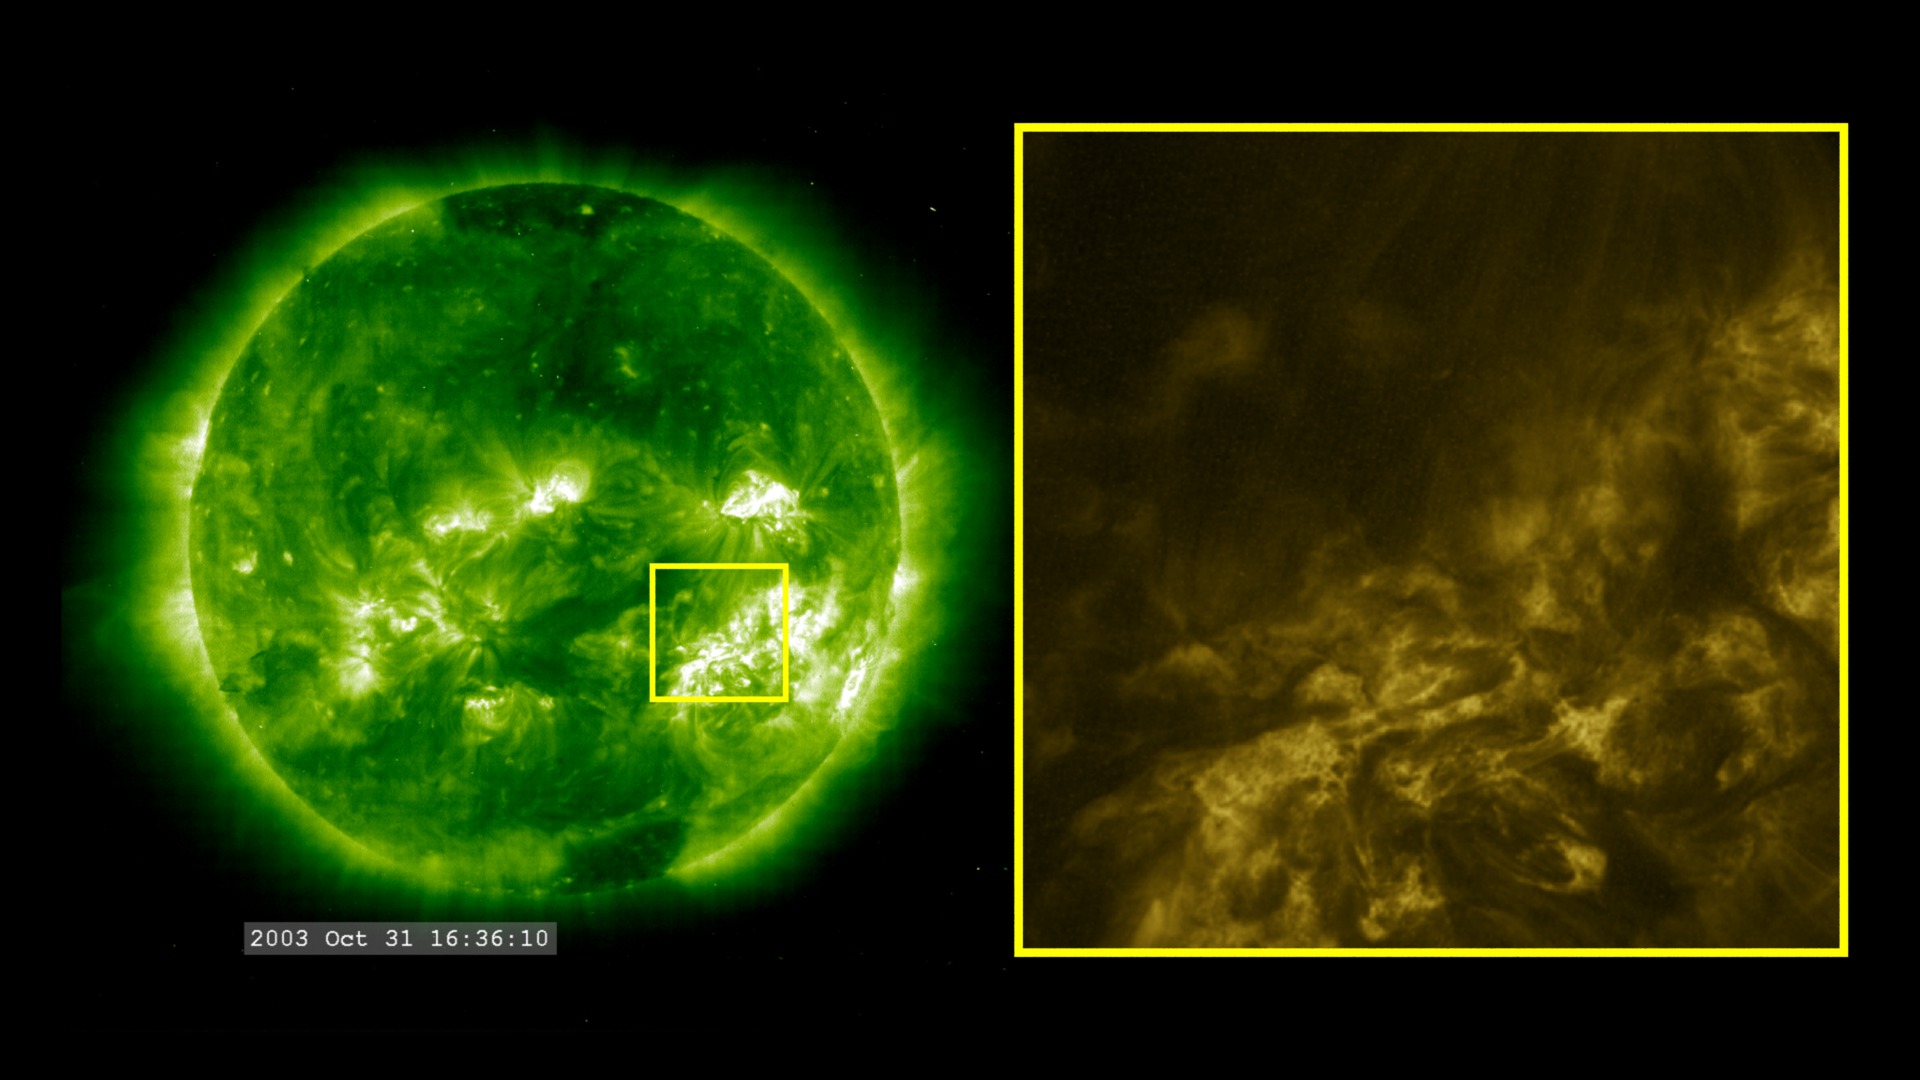
Halloween Storms 2003: SOHO/EIT and TRACE at 195 Angstroms
Go to this pageThis visualization compares the full-disk solar view of SOHO/EIT (green, on the left) with the small field of view of the TRACE ultraviolet telescope (gold, on the right). The yellow border of the TRACE imagery is projected on the appropriate location on the green EIT imagery. Notice that TRACE can track features as they move across the solar disk. The instrument pointing is adjusted on a regular basis, which can produce a considerable amount of jittering in the image. This is a variation on the treatment of the same data as Solar Dynamics Observatory (SDO): Data Collection Comparison.Note that this movie does not play synchronous with the other animations that are part of the SDO Prelaunch package. ||
Comets - Nature's solar probes
- ID: 3932 Visualization
Survivor 2011: Comet Lovejoy vs. The Sun
Go to this pageComet Lovejoy makes a close pass to the Sun, and survives.The Solar Dynamics Observatory (SDO) is actually repointed to better observe the comet's approach to the Sun. ||
- ID: 4017 Visualization
Comet ISON Approaches Perihelion
Go to this pageCurrently located beyond the orbit of Jupiter, Comet ISON is heading for a very close encounter with the sun next year. In November 2013, it will pass less than 0.012 Astronomical Units (Wikipedia) (1.8 million kilometers) from the center of the Sun, 1.2 million kilometers from the solar surface. The fierce heating it experiences in that approach could turn the comet into a bright naked-eye object.NOTE: This visualization was revised in March 2013 to fix an ephemeris error. Other enhancements were included in the revision. Also fixed an error where perihelion distance was mistakenly labeled as distance from solar surface. ||
- ID: 4098 Visualization
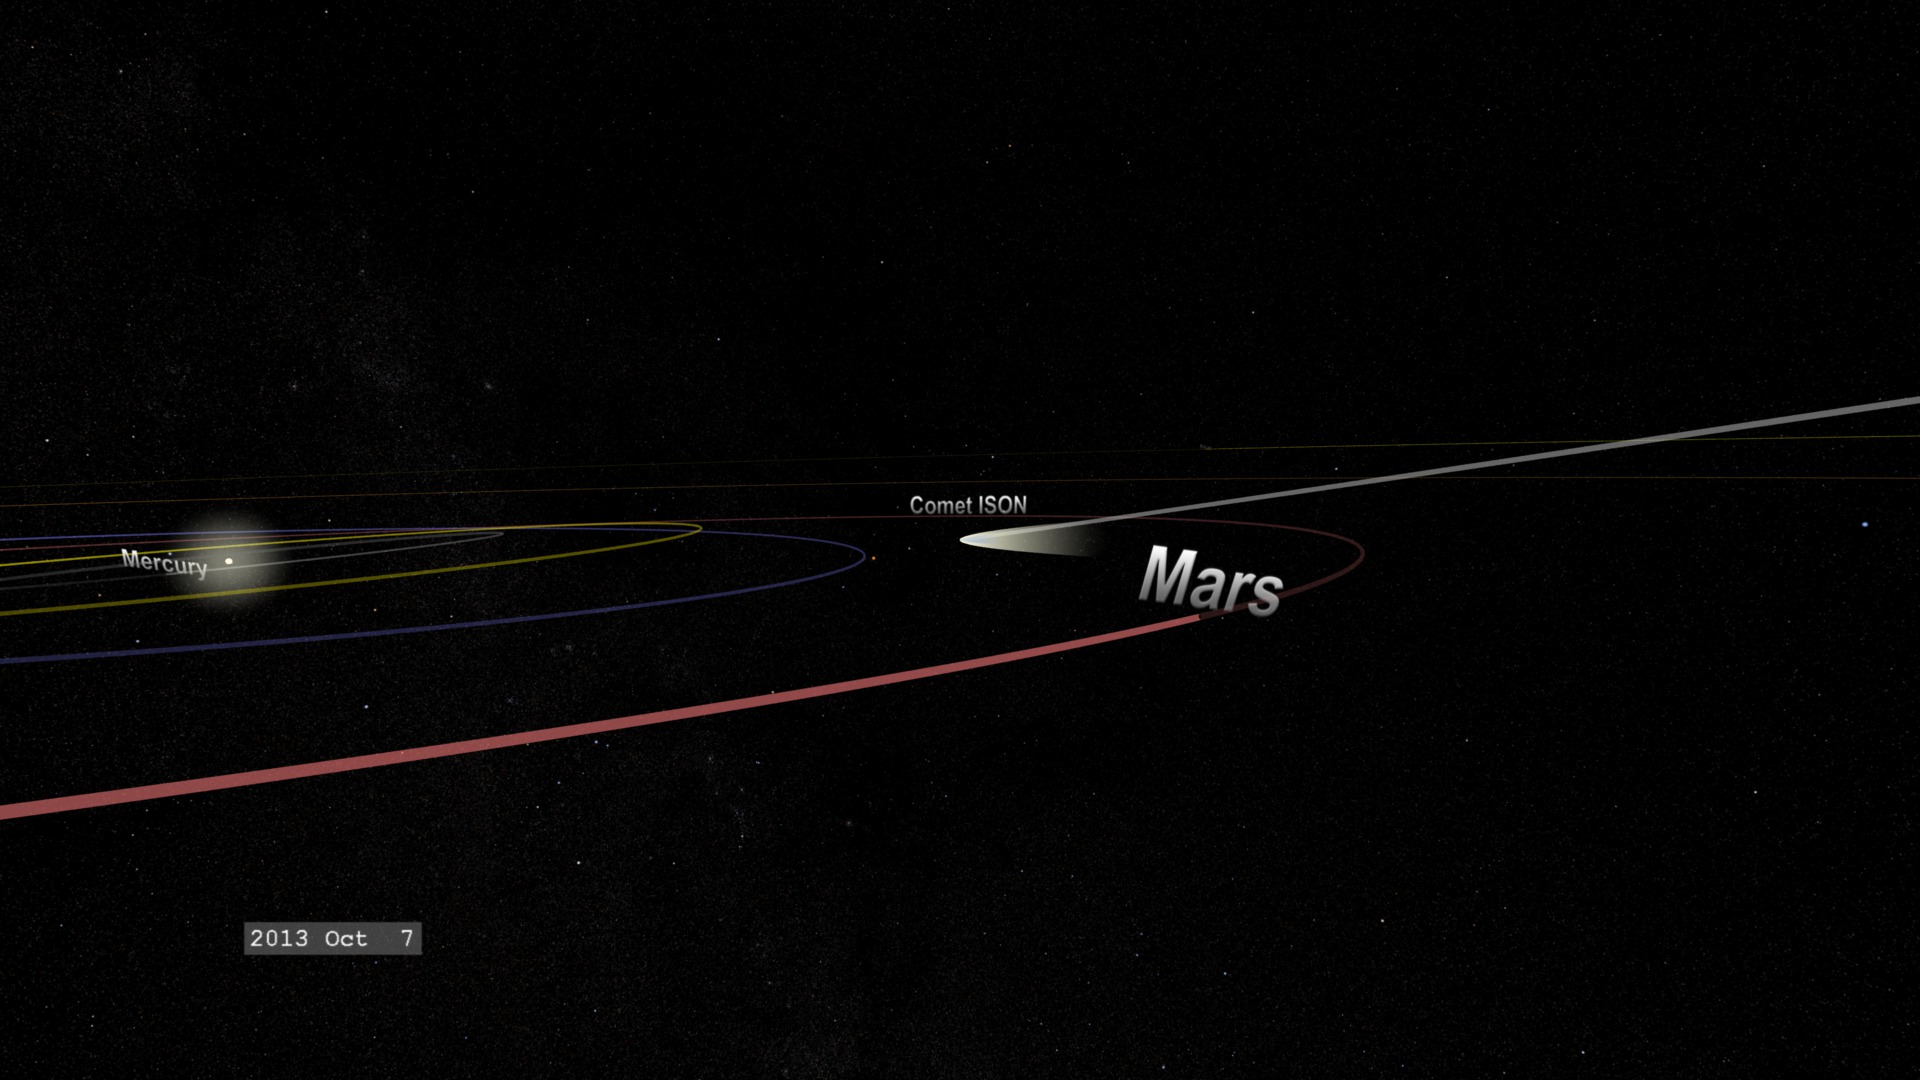
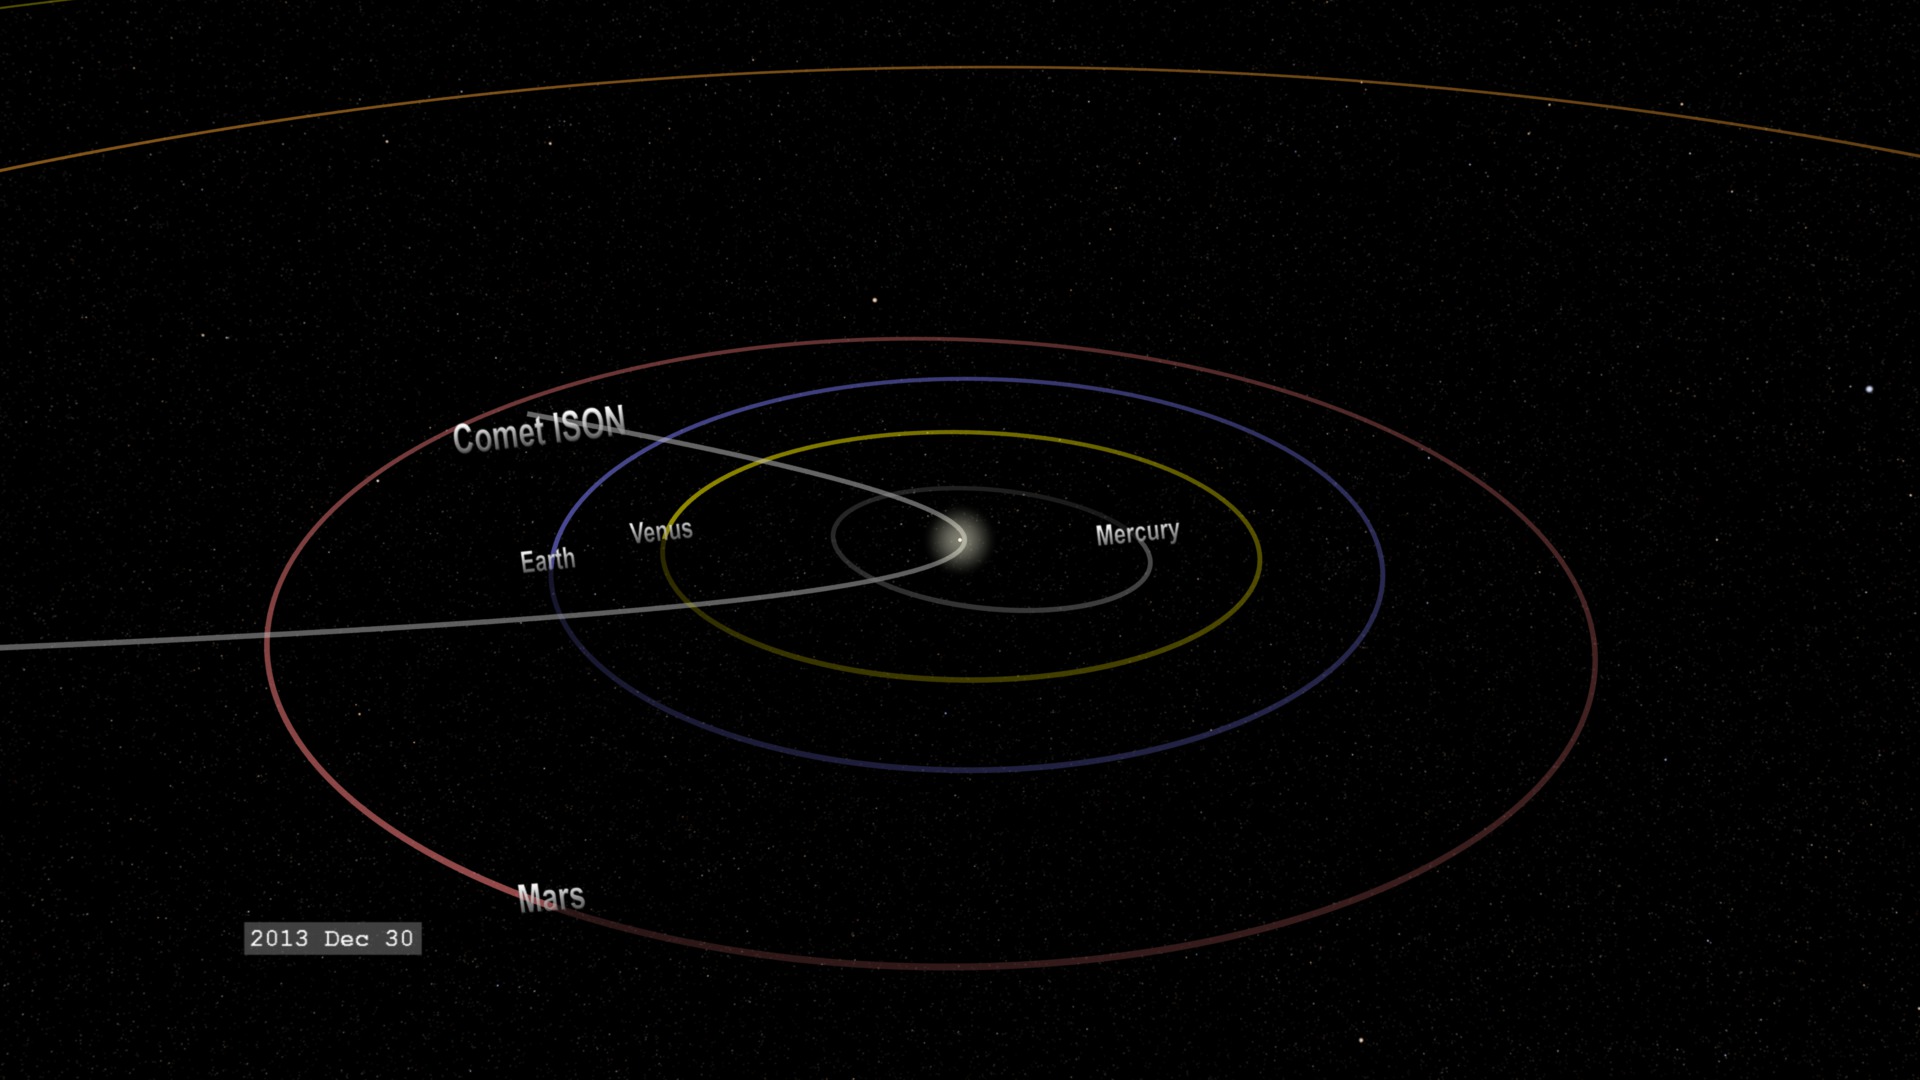
Chasing Comet ISON
Go to this pageComet ISON approaches the inner solar system having just passed the orbit of Jupiter. It passes very close to Mars in early October 2013 before dipping below the ecliptic on its way towards perihelion on November 28, 2013. Comet ISON will make its closest pass to the Earth in January 2014 when it should be visible in the northern hemisphere.In these movies, the cameras chase the comet from two different points of view. ||
Transits
There's a little black spot on the Sun today...
- ID: 3943 Visualization
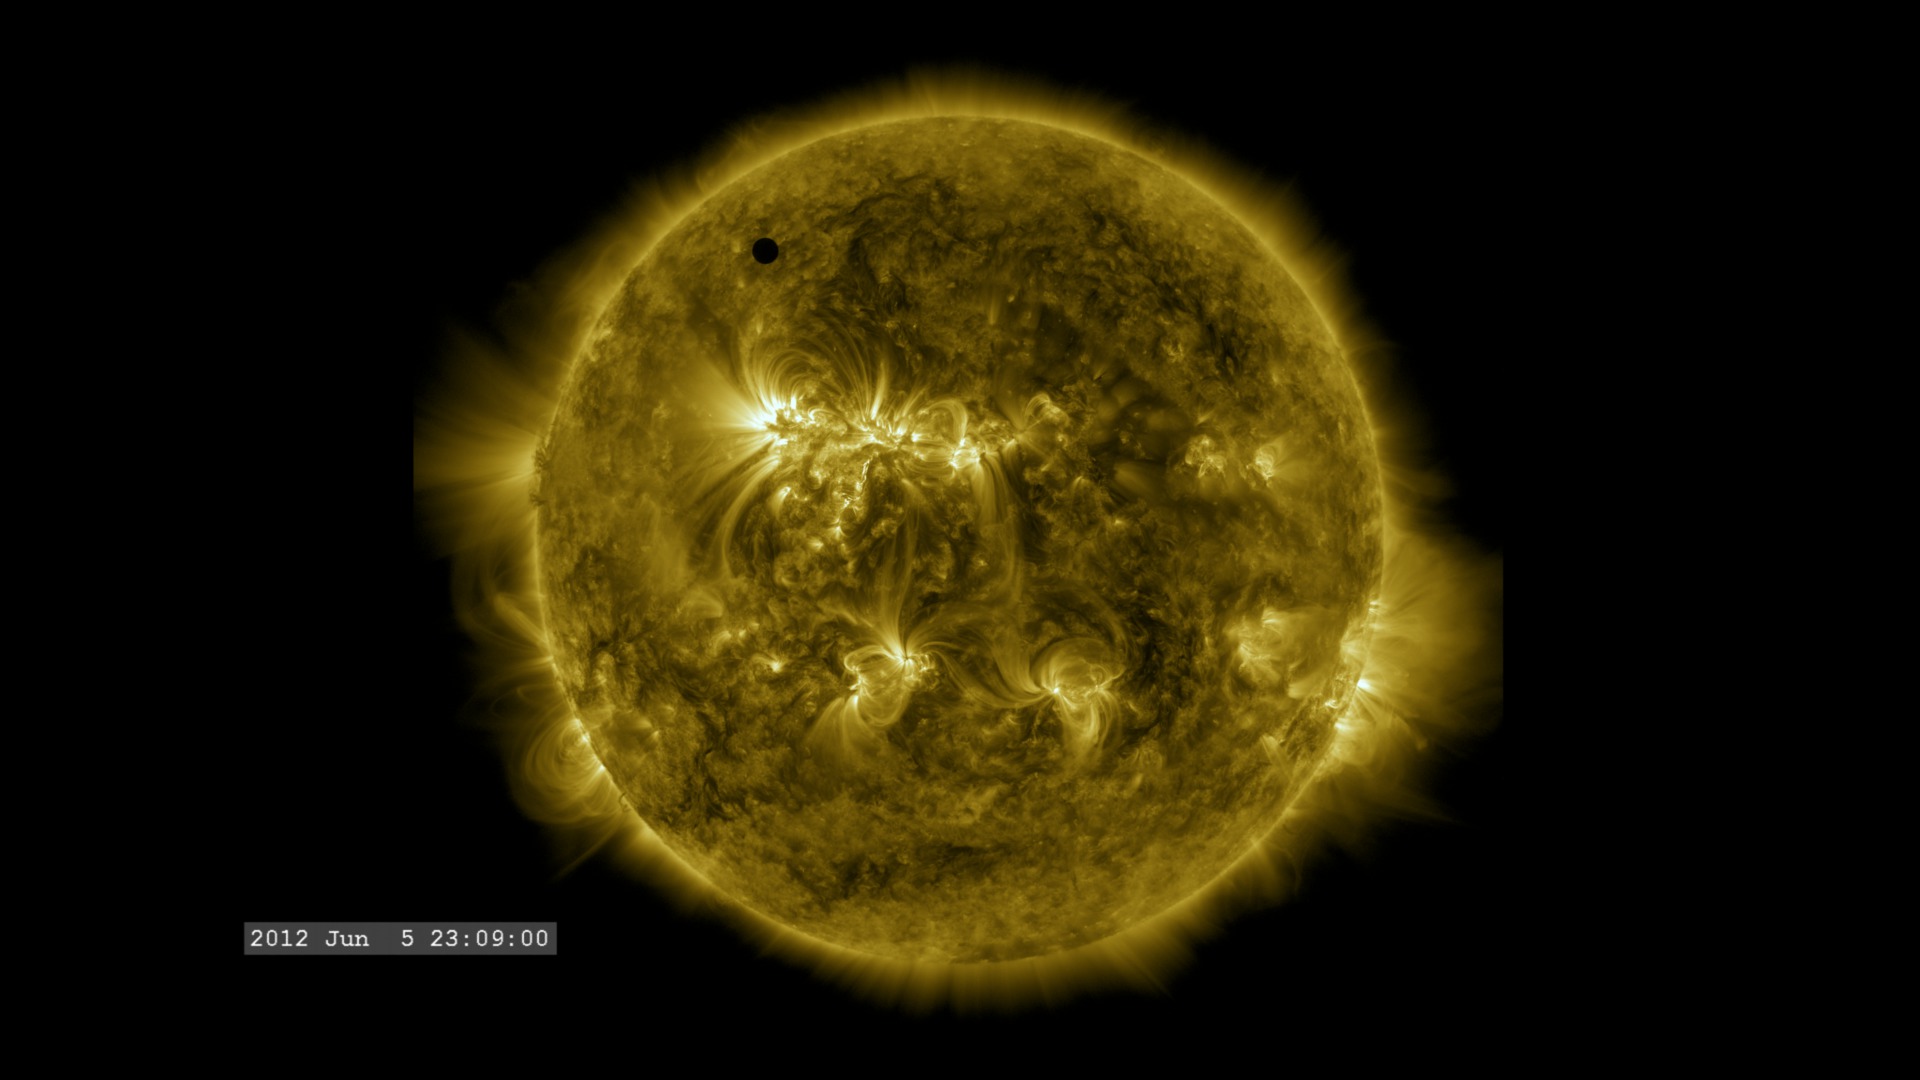
Venus Transit - 2012
Go to this pageIt was your last chance for the next 105 years.A transit is when a planet passes directly between the Sun and the Earth and we see the planet as a small dot moving slowly across the face of the Sun. A Venus transit occurred in 2004 (see Venus Transit from GOES/SXI). Prior to that it was 1882. The last Venus transit occurred on June 5-6, 2012 and the next one won't occur until 2117 (See the NASA Eclipse Web Site).To understand the significance of these events, it helps to know the history of how the Venus transits provided one of the first estimates of the size of the Solar System, and eventually the Universe (see A Brief History of the Transit of Venus).In this visualization, there are a few things which should be noted. 1) The camera view is NOT from anywhere on the surface of the Earth, but corresponds to an observer positioned along the Earth-Sun line, but over the north pole of the Earth. This causes the path of Venus to cross the solar disk lower (closer to the solar equator) than it would appear to an observer on the surface of the Earth.2) The ephemeris used for computing the planetary positions was not the high-precision JPL ephemeris (DE-421), but a lower-precision approximation. Yet, when tracked in detail, the transit takes place only about five hours later. It was decided that since the view of the transit in this visual does not correspond to any actual location ON the Earth, it might be misleading to present high-precision timing of the event.This visualization was developed for conceptual illustration and not meant for precision scientific use. ||
- ID: 3941 Visualization
Venus Transit 2012 Composited Visuals
Go to this pageThese visualizations were generated by compositing the small field-of-view, high-cadence closeups of Venus with the full-disk, low-cadence imagery from Solar Dynamics Observatory (SDO). Two different instruments are used: the Helioseismic and Magnetic Imager (HMI) which sees light in the visible range, and the Atmospheric Imaging Assembly (AIA) which sees light in several wavelengths in the ultraviolet range. To find out more information about these instruments, check out The Atmospheric Imaging Assembly Tutorial.Some artifacts may be visible from the compositing, but you have to look pretty closely to see them.The color table threshold was raised for these images, reducing the amount of noise visible in the images. Note: There is an interesting artifact worthy of mention and clarification, and that is as Venus crosses the solar limb, the limb appears to be visible through the planet in some of the imagers (most notably the ultraviolet channels). Discussion with the scientists who built the imagers suggest this might be 'crosstalk' between the readouts of the four CCD panels that make up a complete image. It is an artifact of the imaging system. ||
- ID: 4075 Visualization
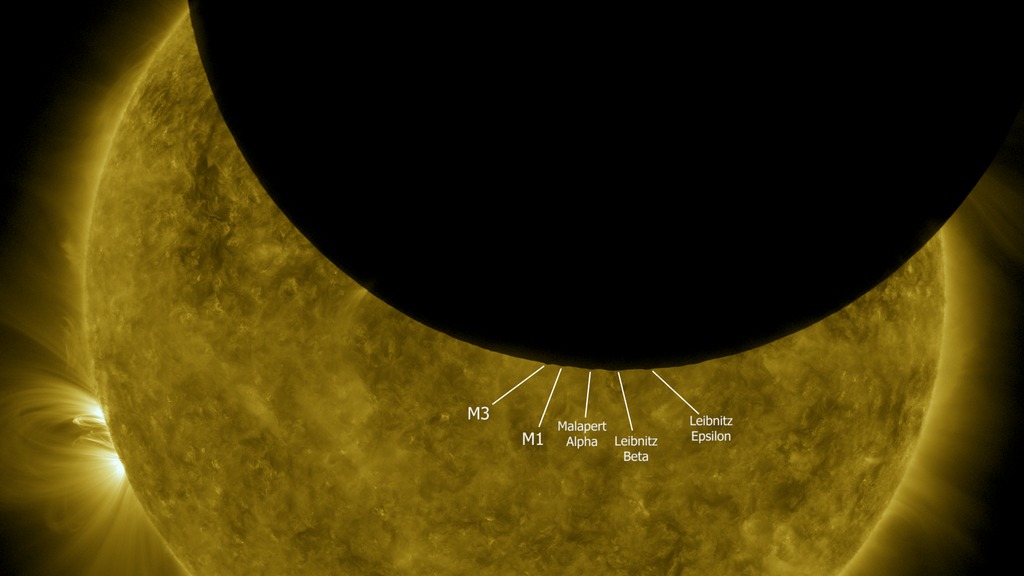
Lunar Transit from Solar Dynamics Observatory (2010)
Go to this pageJust as we do on Earth, the Solar Dynamics Observatory satellite periodically crosses the Moon's shadow and experiences a solar eclipse. During the eclipse witnessed by SDO on October 7, 2010, the southern hemisphere of the Moon was silhouetted against the solar disk, revealing some especially prominent mountain peaks near the Moon's south pole. By using elevation data from Lunar Reconnaissance Orbiter to visualize the Moon from SDO's point of view, it's possible to identify these peaks. Although all of these are well-known features, all but one of them have no official names. The following list corresponds to the labels in the animation, from left to right.In his 1954 sketch of the lunar south pole, astronomer Ewen Whitaker labeled this feature "M3." It's a mountain about halfway between the craters Cabeus and Drygalski, at 83.2°S 68°W.Whitaker's "M1," a mountain on the northern rim of Cabeus, 83.4°S 33°W.A mountain on the southern rim of Malapert crater, about halfway between the centers of Malapert and Haworth. Whitaker labels this Malapert Alpha. It's also known as Mons Malapert or Malapert Peak. 85.8°S 0°E.Labeled Leibnitz Beta by Whitaker and now officially named Mons Mouton, this is part of the highlands adjacent to the northern rim of Nobile crater. 84°S 37°E. Part of the Leibnitz mountain range first identified by Johann Schröter in the late 1700s, unrelated to Leibnitz Crater on the lunar far side.A mountain near Amundsen crater, on the western (Earthward) rim of Hédervári crater, 82.2°S 75°E. Whitaker tentatively labels this Leibnitz Epsilon in his sketch.The Moon visualization uses the latest albedo and elevation maps from Lunar Reconnaissance Orbiter (LRO). ||
Helio Event Stories
NASA releases surrounding some helio science events. May include audio which may not play on all Hyperwalls.
- ID: 11558 Produced Video
NASA's Many Views of a Massive CME
Go to this pageOn July 23, 2012, a massive cloud of solar material erupted off the sun's right side, zooming out into space. It soon passed one of NASA's Solar Terrestrial Relations Observatory, or STEREO, spacecraft, which clocked the CME as traveling between 1,800 and 2,200 miles per second as it left the sun. This was the fastest CME ever observed by STEREO. Two other observatories – NASA's Solar Dynamics Observatory and the joint European Space Agency/NASA Solar and Heliospheric Observatory — witnessed the eruption as well. The July 2012 CME didn't move toward Earth, but watching an unusually strong CME like this gives scientists an opportunity to observe how these events originate and travel through space. STEREO's unique viewpoint from the sides of the sun combined with the other two observatories watching from closer to Earth helped scientists create models of the entire July 2012 event. They learned that an earlier, smaller CME helped clear the path for the larger event, thus contributing to its unusual speed. Such data helps advance our understanding of what causes CMEs and improves modeling of similar CMEs that could be Earth-directed. ||
- ID: 11199 Produced Video
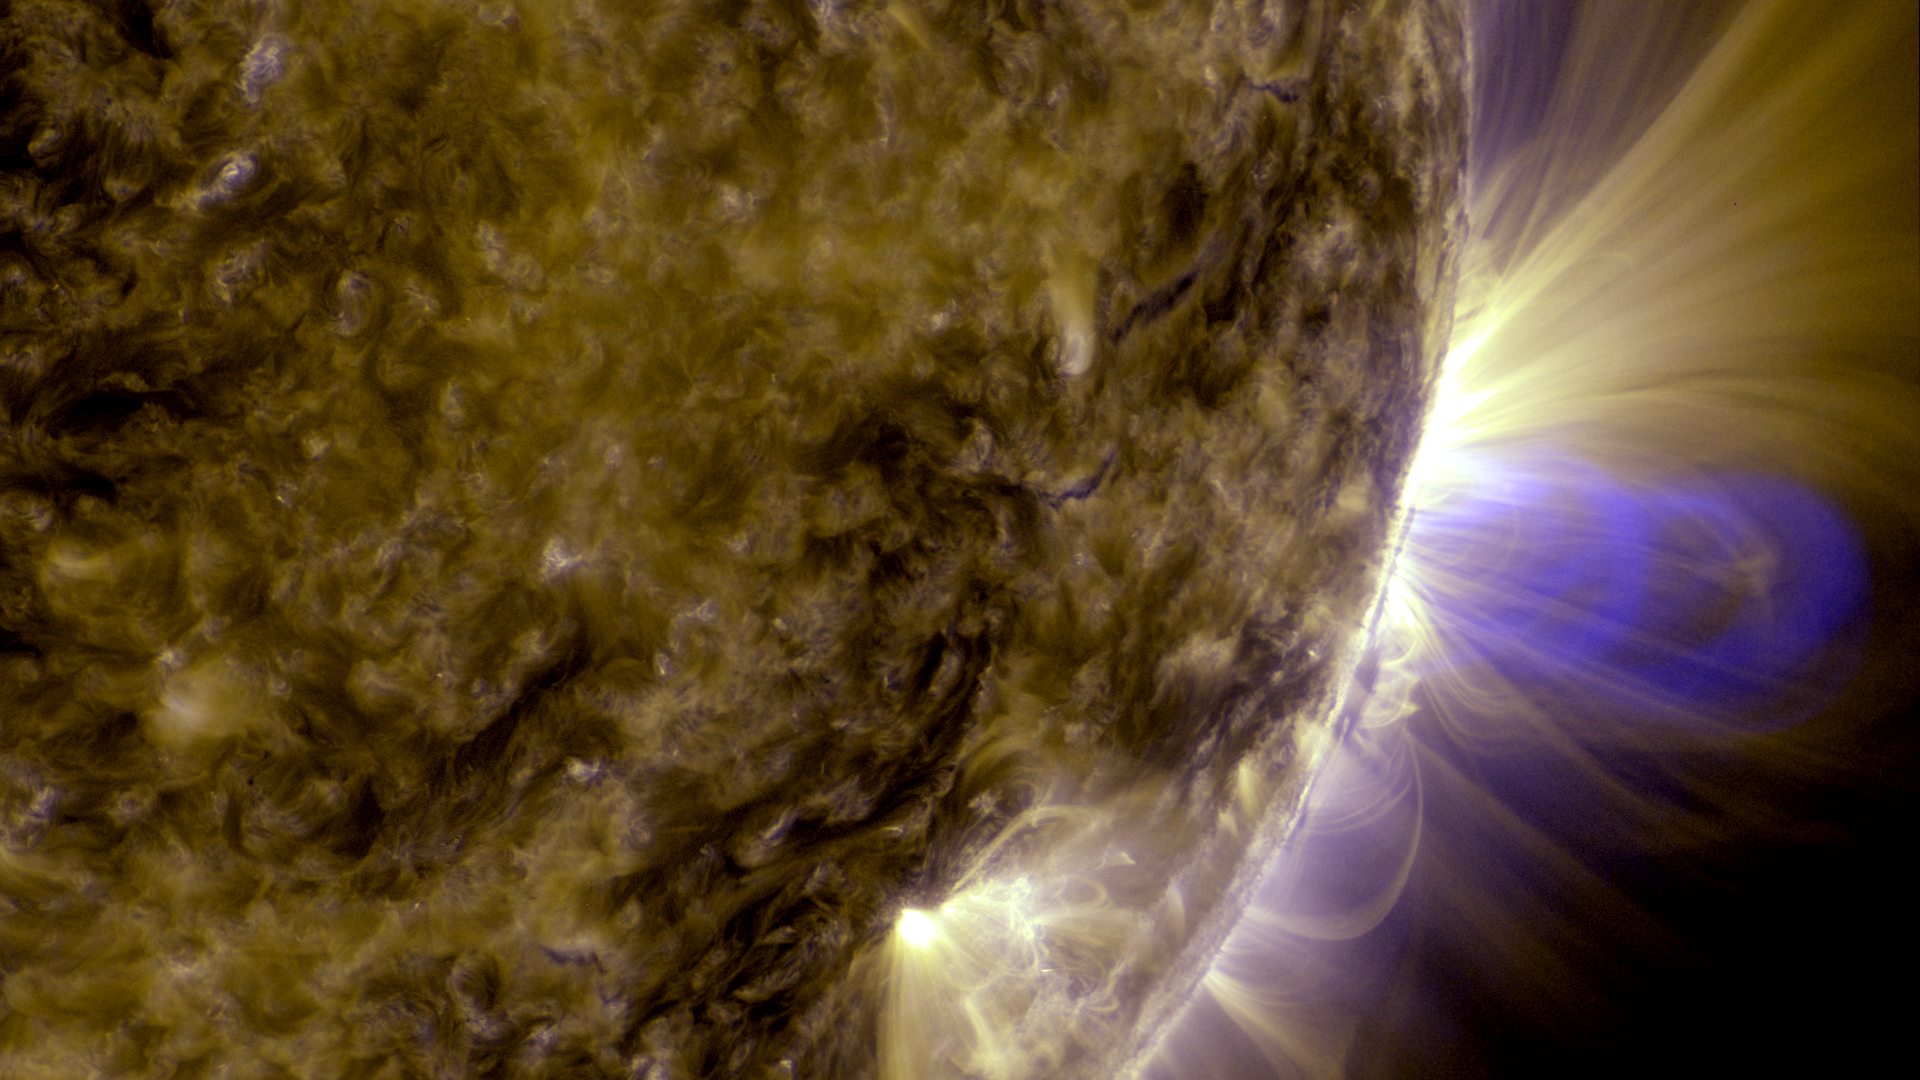
X Marks the Spot: SDO Sees Reconnection
Go to this pageTwo NASA spacecraft have provided the most comprehensive movie ever of a mysterious process at the heart of all explosions on the sun: magnetic reconnection. Magnetic reconnection happens when magnetic field lines come together, break apart, and then exchange partners, snapping into new positions and releasing a jolt of magnetic energy. This process lies at the heart of giant explosions on the sun such as solar flares and coronal mass ejections, which can fling radiation and particles across the solar system. Magnetic field lines, themselves, are invisible, but the sun's charged plasma particles course along their length. Space telescopes can see that material appearing as bright lines looping and arcing through the sun’s atmosphere, and so map out the presence of magnetic field lines. Looking at a series of images from the Solar Dynamics Observatory (SDO), scientists saw two bundles of field lines move toward each other, meet briefly to form what appeared to be an “X” and then shoot apart with one set of lines and its attendant particles leaping into space and one set falling back down onto the sun. To confirm what they were seeing, the scientists turned to a second NASA spacecraft, the Reuven Ramaty High Energy Solar Spectroscopic Imager (RHESSI). RHESSI collects spectrograms, a kind of data that can show where exceptionally hot material is present in any given event on the sun. RHESSI showed hot pockets of solar material forming above and below the reconnection point, an established signature of such an event. By combining the SDO and RHESSI data, the scientists were able to describe the process of what they were seeing, largely confirming previous models and theories, while revealing new, three-dimensional aspects of the process. ||
- ID: 11043 Produced Video

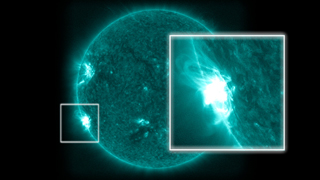
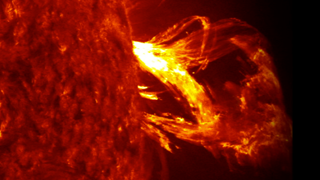
Big Sunspot 1520 Releases X1.4 Class Flare
Go to this pageAn X1.4 class flare erupted from the center of the sun, peaking on July 12, 2012 at 12:52 PM EDT. It erupted from Active Region 1520 which rotated into view on July 6. ||
- ID: 11222 Produced Video
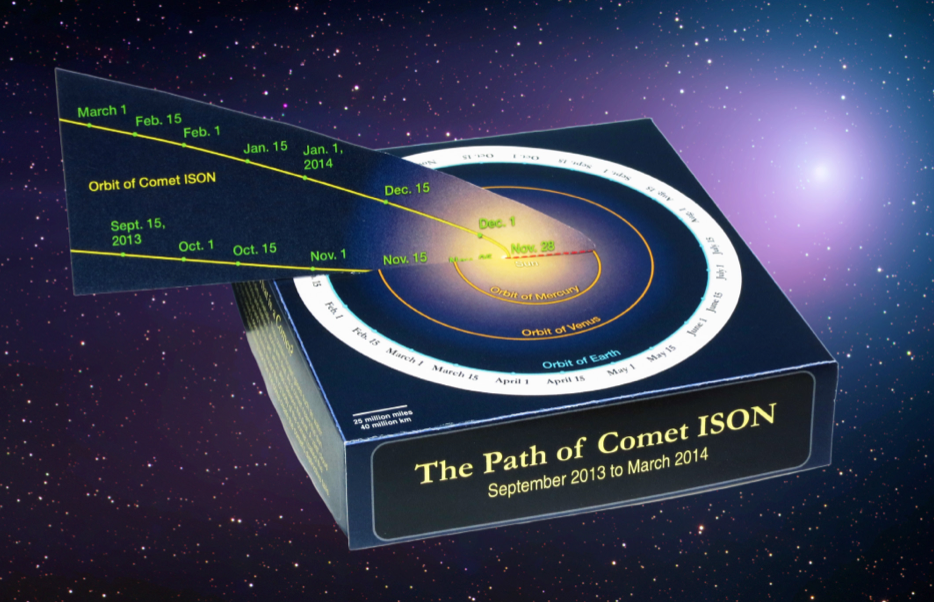
The Path of Comet ISON
Go to this pageComet C/2012 S1, better known as comet ISON, may become a dazzling sight as it traverses the inner solar system in late 2013. During the weeks before its Nov. 28 close approach to the sun, the comet will be observable with small telescopes, and binoculars. Observatories around the world and in space will track the comet during its fiery trek around the sun. If ISON survives its searing solar passage, which seems likely but is not certain, the comet may be visible to the unaided eye in the pre-dawn sky during December.Watch the animations on this page to visualize ISON's voyage through the inner solar system, or build the paper model of its orbit to track the changing positions of Earth and the comet.Like all comets, ISON is a clump of frozen gases mixed with dust. Often described as "dirty snowballs," comets emit gas and dust whenever they venture near enough to the sun that the icy material transforms from a solid to gas, a process called sublimation. Jets powered by sublimating ice also release dust, which reflects sunlight and brightens the comet. On Nov. 28, ISON will make a sweltering passage around the sun. The comet will approach within about 730,000 miles (1.2 million km) of its visible surface, which classifies ISON as a sungrazing comet. In late November, its icy material will furiously sublimate and release torrents of dust as the surface erodes under the sun's fierce heat, all as sun-monitoring satellites look on. Around this time, the comet may become bright enough to glimpse just by holding up a hand to block the sun's glare.Sungrazing comets often shed large fragments or even completely disrupt following close encounters with the sun, but for ISON neither fate is a forgone conclusion.Following ISON's solar swingby, the comet will depart the sun and move toward Earth, appearing in morning twilight through December. The comet will swing past Earth on Dec. 26, approaching within 39.9 million miles (64.2 million km) or about 167 times farther than the moon.The comet was discovered on Sept 21, 2012, by Russian astronomers Vitali Nevski and Artyom Novichonok using a telescope of the International Scientific Optical Network (ISON) located near Kislovodsk.Learn more about sungrazing comets. ||
- ID: 10966 Produced Video
SDO: Year 2
Go to this pageApril 21, 2012 marks the two-year anniversary of the Solar Dynamics Observatory (SDO) First Light press conference, where NASA revealed the first images taken by the spacecraft. This video highlights just some of the amazing events witnessed in SDO's second year. ||
- ID: 11203 Produced Video
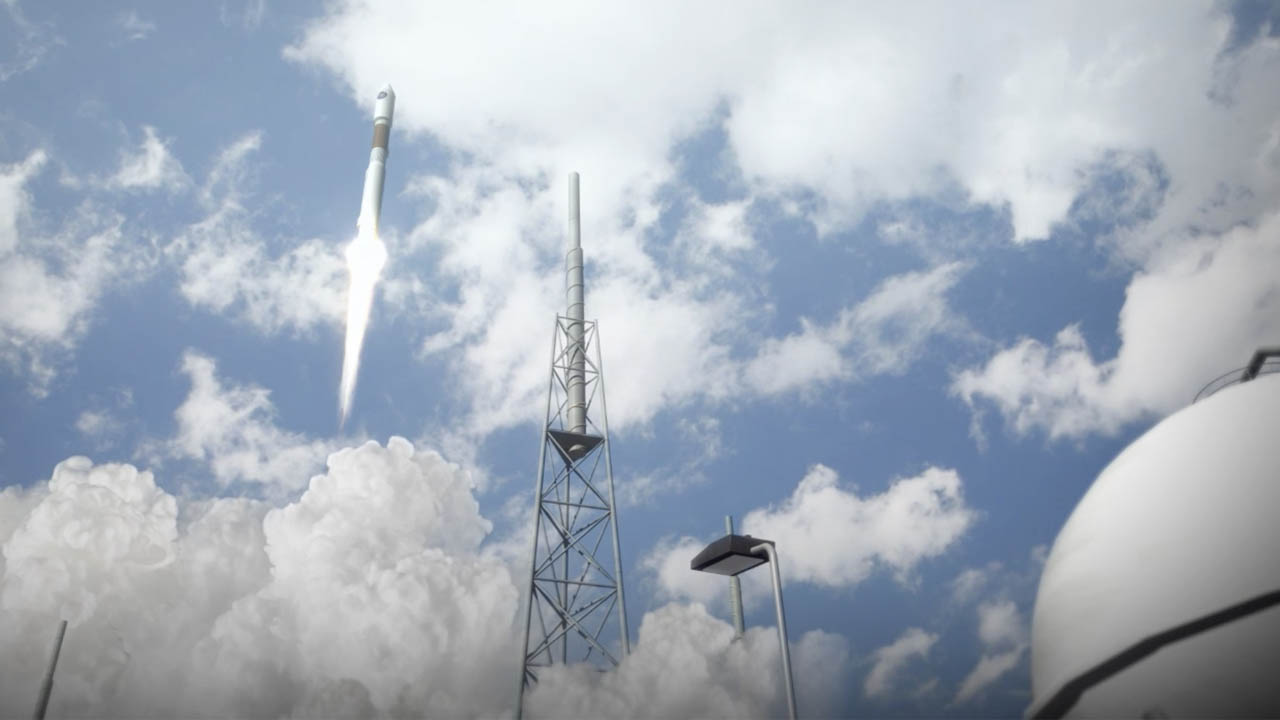
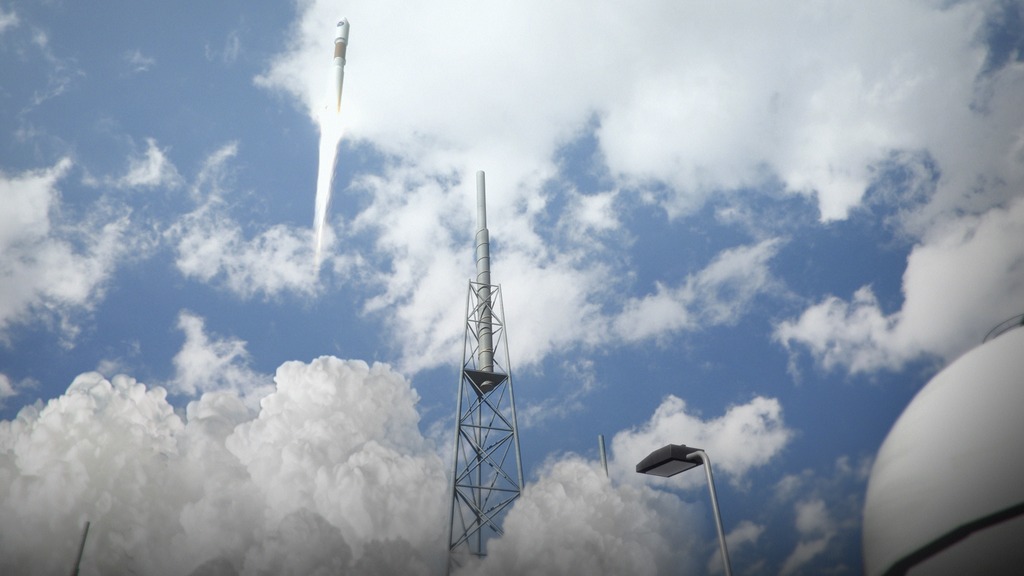
SDO: Year 3
Go to this pageOn Feb. 11, 2010, NASA launched an unprecedented solar observatory into space. The Solar Dynamics Observatory (SDO) flew up on an Atlas V rocket, carrying instruments that scientists hoped would revolutionize observations of the sun. If all went according to plan, SDO would provide incredibly high-resolution data of the entire solar disk almost as quickly as once a second. When the science team released its first images in April of 2010, SDO's data exceeded everyone's hopes and expectations, providing stunningly detailed views of the sun. In the three years since then, SDO's images have continued to show breathtaking pictures and movies of eruptive events on the sun. Such imagery is more than just pretty, they are the very data that scientists study. By highlighting different wavelengths of light, scientists can track how material on the sun moves. Such movement, in turn, holds clues as to what causes these giant explosions, which, when Earth-directed, can disrupt technology in space. SDO is the first mission in a NASA's Living With a Star program, the goal of which is to develop the scientific understanding necessary to address those aspects of the sun-Earth system that directly affect our lives and society. NASA's Goddard Space Flight Center in Greenbelt, Md. built, operates, and manages the SDO spacecraft for NASA's Science Mission Directorate in Washington, D.C.SDO: Year One here.SDO: Year 2 here.Information about the individual clips used in this video is here.Watch this video on YouTube. ||
Van Allen Probes
Exploring Earth's radiation belts.
- ID: 3951 Visualization
The Van Allen Probes (formerly Radiation Belt Storm Probes - RBSP) Explore the Earth's Radiation Belts
Go to this pageThe Radiation Belt Storm Probe (RBSP) is actually two satellites that will travel on a elliptical orbit around the Earth, ranging between 1.5 and 6 Earth radii. This range covers the inner region of the Earth's geomagnetic field. In this region, many of the magnetic field lines intersect the surface of the Earth in the north and south. This means that lower energy ions and electrons, some 'boiled off' the Earth's ionosphere by solar ultraviolet radiation, can be trapped along these field lines. The charged particles spend their time bouncing between the 'mirror points' in the Earth's magnetic field. This trapped population forms the radiation belts around the Earth. The radiation created by this charged particle population can be hazardous to satellites and astronauts so it is important to understand their characteristics. ||
- ID: 4048 Visualization
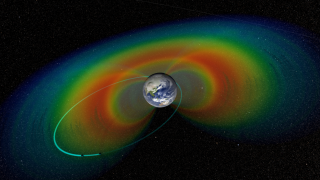
Van Allen Probes New View of the Radiation Belts
Go to this pageThis visualization is constructed from some of the first data from the Van Allen Probes (formerly RBSP).The belts are constructed from particle samples by the probes as they pass through the belt, so each 3-D snapshot corresponds to the outward or inward portion of the probes' orbit.The major result from this early data is the recognition of a third radiation belt (the outer belt appears to actually be two belts). ||
Magnetospheric Multi-Scale Mission (MMS)
- ID: 11308 Produced Video

MMS: Engineering Challenges
Go to this pageIt's hard enough to build one spacecraft, but the Magnetospheric Multiscale Mission (MMS) is building four. Together, the spacecraft will unlock the mysteries of magnetic reconnection, when magnetic fields explosively connect and disconnect, transferring energy. ||
- ID: 11485 Produced Video
MMS Narrated Orbit
Go to this pageScientist John Dorelli explains the MMS mission's orbit and why the four spacecraft fly in a tetrahedron formation. On its journey, MMS will observe a little-understood, but universal phenomenon called magnetic reconnection, responsible for dramatic re-shaping of the magnetic environment near Earth, often sending intense amounts of energy and fast-moving particles off in a new direction. Not only is this a fundamental physical process that occurs throughout the universe, it is also one of the drivers of space weather events at Earth. To truly understanding the process, requires four identical spacecraft to track how such reconnection events move across and through any given space in 3D. ||
- ID: 11526 Produced Video

MMS Mission Trailer
Go to this pageIn March 2015, NASA will launch four identical spacecraft to study how magnetic fields around Earth connect and disconnect, explosively releasing energy – a process known as magnetic reconnection. The Magnetospheric Multiscale, or MMS, mission will provide the first three-dimensional views of this fundamental process that can accelerate particles to nearly the speed of light. MMS uses Earth’s protective magnetic space environment, the magnetosphere, as a natural laboratory to directly measure reconnection. Reconnection is a common processes in our universe; occurring in space near Earth, in the atmosphere of the sun and other stars, in the vicinity of black holes and neutron stars, and at virtually any boundary between space plasmas, including the boundary between our solar system's heliosphere and interstellar space. ||
- ID: 11702 Produced Video
MMS Launch and Deploy - Narrated
Go to this pageIn March of 2015, an unprecedented NASA mission will launch to study a process so mysterious that no one has ever directly measured it in action. To create the first-ever 3-dimensional maps of this process, a process called magnetic reconnection, which occurs all over the universe, the Magnetospheric Multiscale, or MMS, mission uses four separate spacecraft equipped with ultra high speed instruments. Launching four satellites into space simultaneously is a complicated process. In addition, each spacecraft has six booms that will unfold and extend in space once in orbit. A launch and deployment with so many moving parts must be meticulously planned. Watch the video to get a sneak preview of how MMS will make this journey: The four spacecraft are housed in a single rocket on their trip into space. One by one, each ejects out, before moving into a giant pyramid-shaped configuration. Next each spacecraft deploys its six booms. Once in orbit, MMS will fly through regions near Earth where this little-understood process of magnetic reconnection occurs. Magnetic reconnection happens in thin layers just miles thick, but can tap into enough power at times to create gigantic explosions many times the size of Earth. Reconnection happens when magnetic field lines explosively realign and release massive bursts of energy, while hurling particles out at nearly the speed of light in all directions. Magnetic reconnection powers eruptions on the sun and – closer to home – triggers the flow of material and energy from interplanetary space into near-Earth space. The MMS orbit will carry the four spacecraft through reconnection regions near Earth, using this nearby natural laboratory to better understand how reconnection occurs everywhere in space. For more information about MMS, visit: www.nasa.gov/mms ||
- ID: 20210 Animation

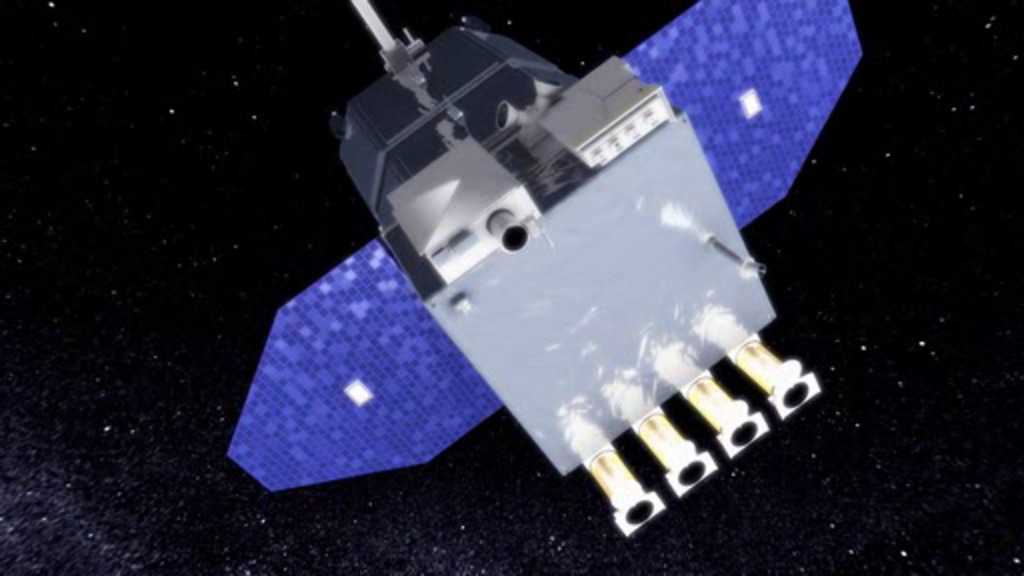
MMS Spacecraft Animation
Go to this pageThe Magnetospheric Multiscale (MMS) mission is a Solar Terrestrial Probes mission comprising four identically instrumented spacecraft that will use Earth’s magnetosphere as a laboratory to study the microphysics of three fundamental plasma processes: magnetic reconnection, energetic particle acceleration, and turbulence. These processes occur in all astrophysical plasma systems but can be studied in situ only in our solar system and most efficiently only in Earth’s magnetosphere, where they control the dynamics of the geospace environment and play an important role in the processes known as “space weather.”Learn more about MMS at www.nasa.gov/mms ||
- ID: 20214 Animation
MMS Launch and Deployment
Go to this pageThis animation follows Magnetosphere Multiscale(MMS) Mission from launch at Kennedy Space Center through deployment and on station doing science. The MMS mission is comprising four identically instrumented spacecraft that will use Earth’s magnetosphere as a laboratory to study the microphysics of three fundamental plasma processes: magnetic reconnection, energetic particle acceleration, and turbulence. ||
Miscellaneous
- ID: 20097 Animation
Substorms
Go to this pageThis animation shows a magnetospheric substorm, during which the reconnection causes energy to be rapidly released along the field lines causing the auroras to brighten. ||
- ID: 20192 Animation

Space Weather
Go to this pageThis movie takes us on a space weather journey from the center of the sun to solar eruptions in the sun's atmosphere all the way to the effects of that activity near Earth. The view starts in the core of the sun where atoms fuse together to create light and energy. Next we travel toward the sun's surface, watching loops of magnetic fields rise up to break through the sun's atmosphere, the corona. In the corona is where we witness giant bursts of radiation and energy known as solar flares, as well as gigantic eruptions of solar material called coronal mass ejections or CMEs. The movie follows one of these CME's toward Earth where it impacts and compresses Earth's own protective magnetic bubble, the magnetosphere. As energy and particles from the sun funnel along magnetic field lines near Earth, they ultimately produce aurora at Earth's poles. ||
- ID: 3514 Visualization

IBEX Orbit Visualization
Go to this pageThe Interstellar Boundary EXplorer (IBEX) mission will observe the boundary between the heliosphere and the interstellar medium from a location near the Earth. The mission will measure the flux of hydrogen Energetic Neutral Atoms (ENAs) which can be directed towards the Sun by an interaction with the heliosheath. In this visualization, we see the orbit of the spacecraft orbit (green) in relation to the Earth, the orbit of the Moon (gray), and Sun. For more information, visit the IBEX Mission Project Page at Southwest Research Institute which is managing the mission. We also have additional video outlining the mission (link). ||
- ID: 4061 Visualization
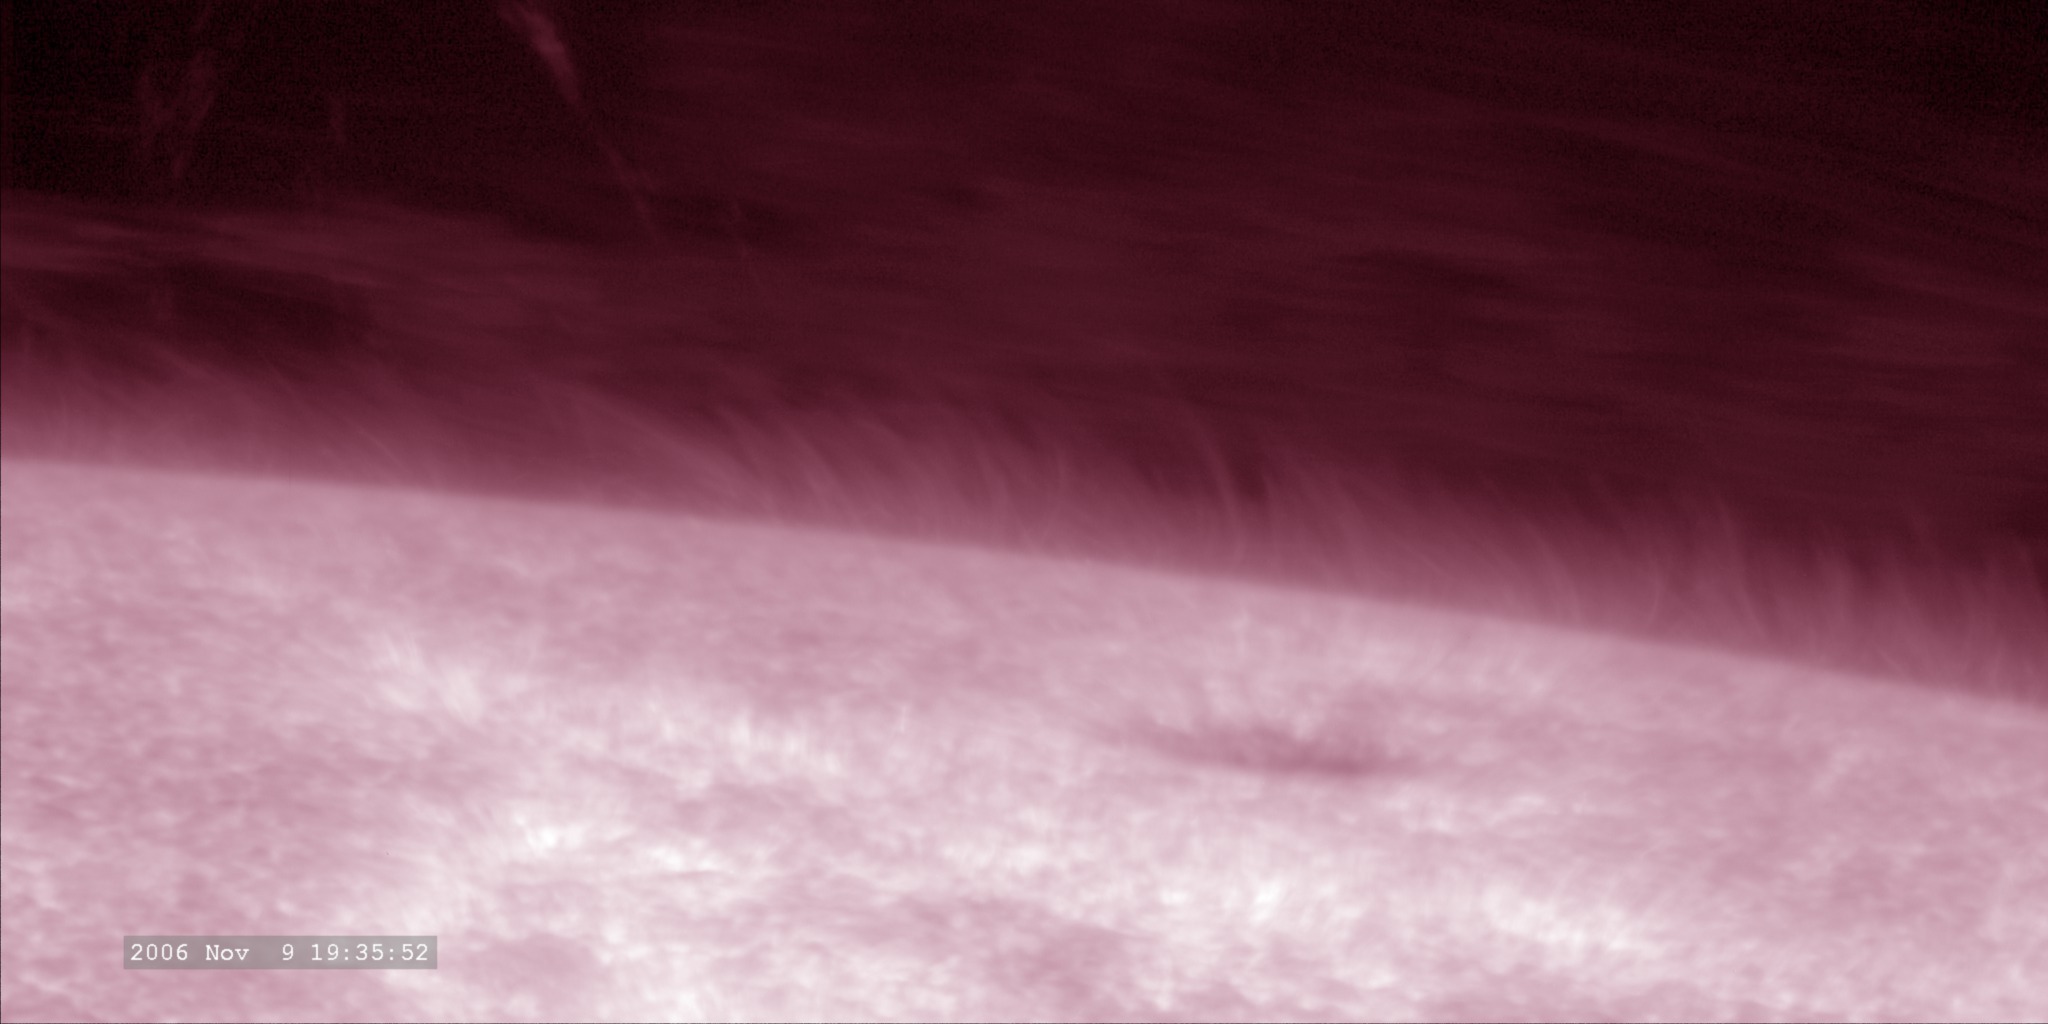
Solar Close-ups with Hinode's Solar Optical Telescope
Go to this pageA collection of movies generated from the Solar Optical Telescope (SOT) of the JAXA/NASA Hinode mission. ||
- ID: 20118 Animation
The Solar Dynamics Observatory (SDO)
Go to this pageSDO is designed to help us understand the Sun's influence on Earth and Near-Earth space by studying the solar atmosphere on small scales of space and time and in many wavelengths simultaneously. ||