Comparative Magnetospheres: A Carrington-Class CME
In an effort to understand and predict the impact of space weather events on Earth, the Community-Coordinated Modeling Center (CCMC) at NASA Goddard Space Flight Center, routinely runs computer models of the many historical events. These model runs are then compared to actual data to determine ways to improve the model, and therefore forecasts of the impacts of future space weather events.
But sometimes we don't have an actual event where we have lots of data for comparison. Extreme space weather events are one example where we must test models with a rather limited set of data.
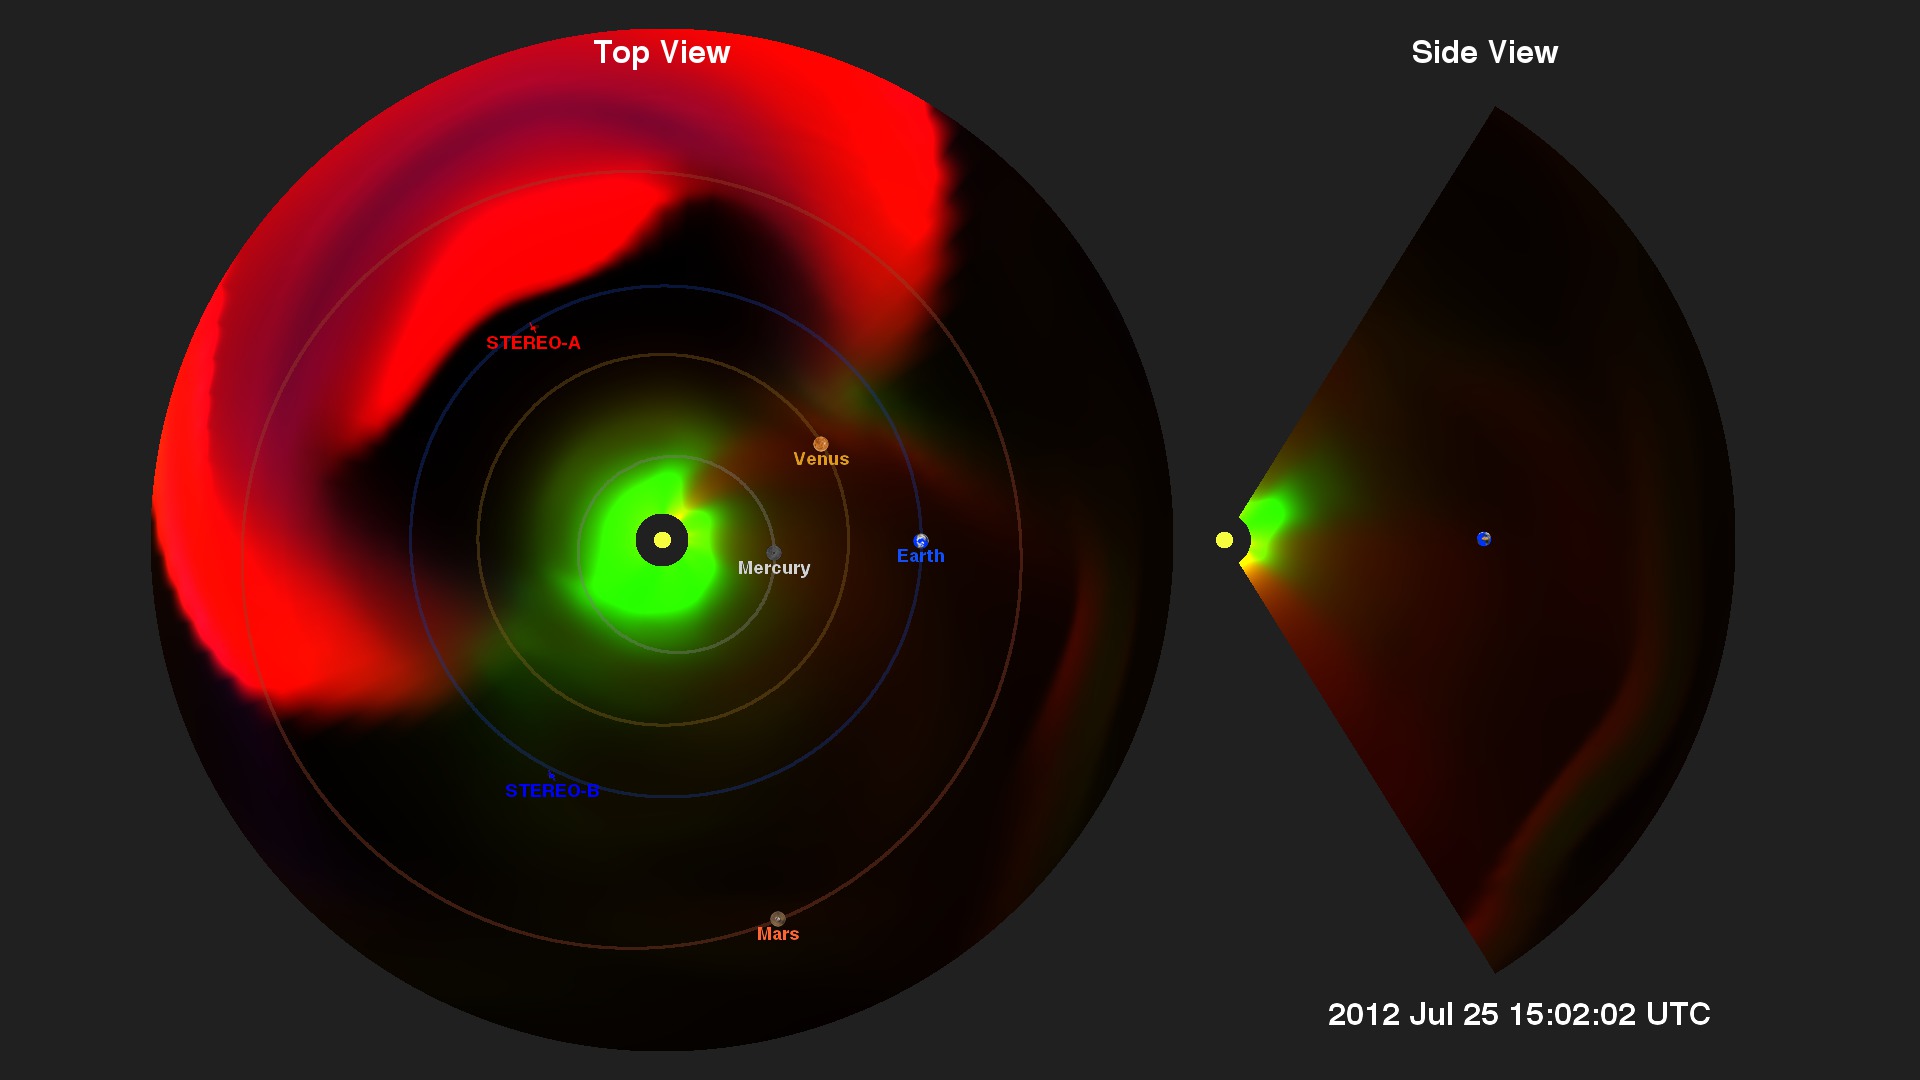
This is a model run used to examine the consequences if a large coronal mass ejection (CME) such as The Carrington-Class CME of 2012 had actual hit Earth. Such model runs allow us to estimate consequences of a large event hitting Earth so we can better protect power grids and satellites.
Some of the conclusions from this model run are (documented in the paper linked below):
- The magnetopause is compressed to the point it is moved inside the orbits of our geosynchronous satellites.
- Large field-aligned currents are created on the night-side of Earth, generating large ionospheric potentials.
- At high latitudes, geo-electric fields of 26 volts per kilometer can be generated.
For comparison, the geo-electric field of the March 1989 storm which generated an extensive power outage in Canada (Wikipedia) had a value of only about 6 volts per kilometer; and the 2003 Halloween solar storms (see Halloween Solar Storms 2003) generated a field of about 12 volts per kilometer.
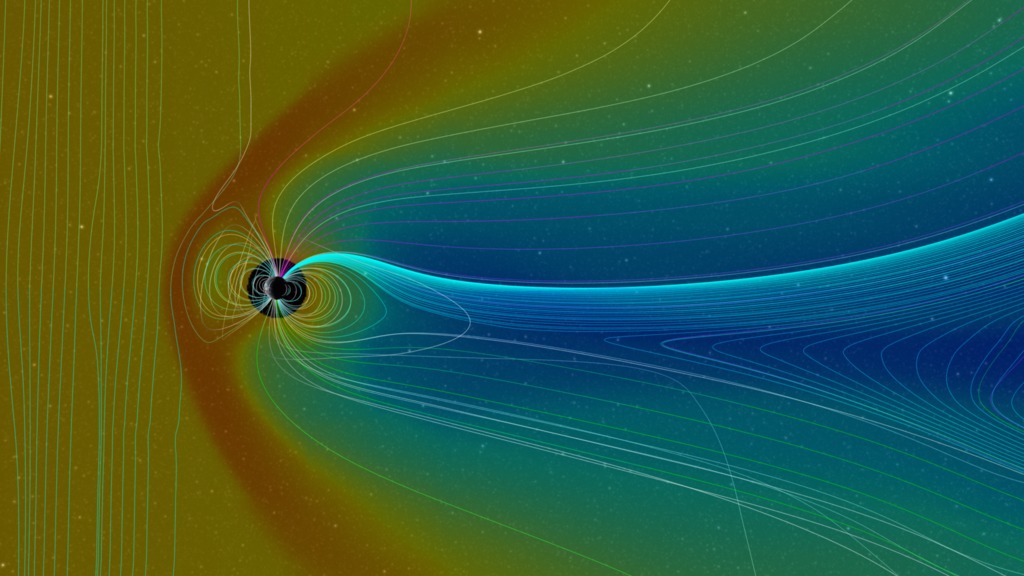
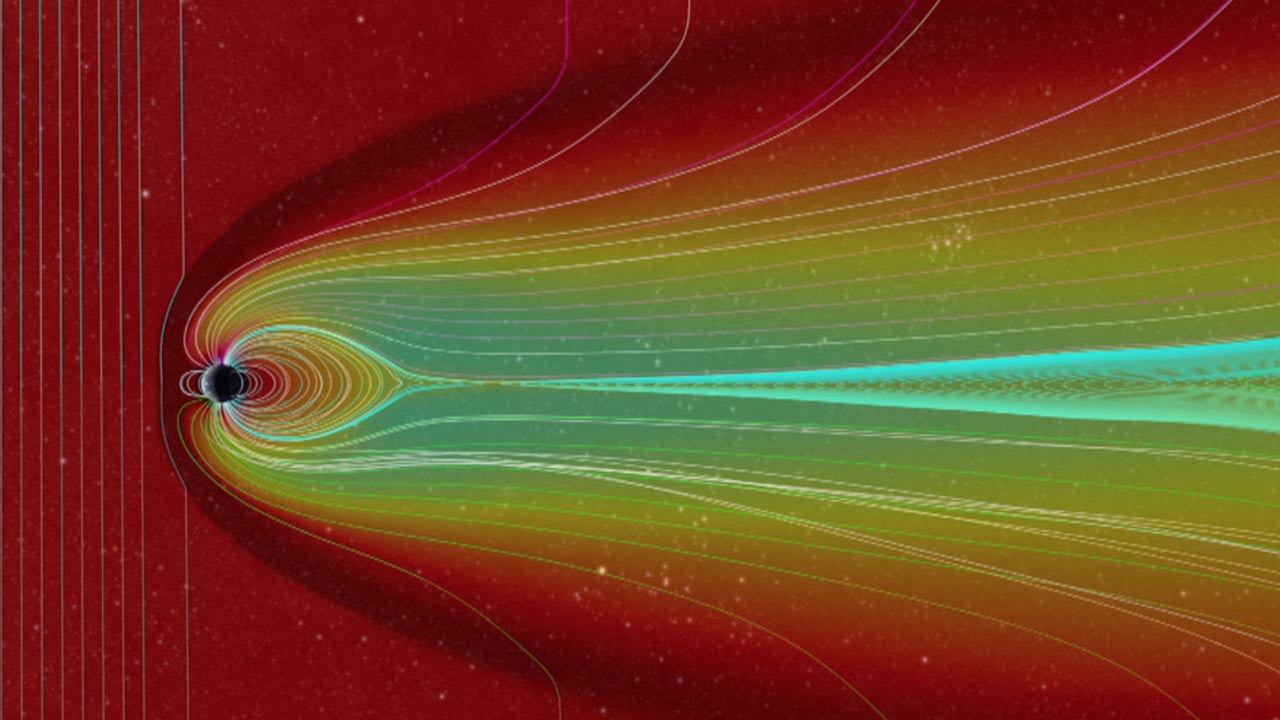
This movie opens with a close-up view of Earth with geo-magnetic field lines. The camera pulls out and fades in a profile slice of the plasma density data.
Same movie as above, but a cyan arrow marks the direction of Earth's magnetic pole.
A profile view of the magnetic field and density data. No pullout from Earth.
This movie presents an oblique view of the geo-magnetic field and a vertical slice of density data. This view provides a better look of the three-dimensional structure of the magnetic field lines as the magnetosphere evolves.
Same movie as above, but a cyan arrow marks the direction of Earth's magnetic pole.

Color bar for density data. This colorbar uses the same scale as "Comparative Magnetospheres: A Noteworthy Coronal Mass Ejection" to facilitate comparison.
Credits
Please give credit for this item to:
NASA's Scientific Visualization Studio, the Space Weather Research Center (SWRC), the Community-Coordinated Modeling Center (CCMC) and the Space Weather Modeling Framework (SWMF).
-
Animator
- Tom Bridgman (Global Science and Technology, Inc.)
-
Producer
- Genna Duberstein (USRA)
-
Scientists
- Chigomezyo M. Ngwira (Department of Physics, Catholic University of America)
- Antti Pulkinnen (NASA/GSFC)
- Maria M. Kuznetsova (NASA/GSFC)
- Alex Glocer (NASA/GSFC)
-
Project support
- Laurence Schuler (ADNET Systems, Inc.)
- Ian Jones (ADNET Systems, Inc.)
Series
This page can be found in the following series:Related papers
Datasets used
-
BATS-R-US Magnetosphere Model
ID: 686MHD Magnetospheric simulation
See all pages that use this dataset
Note: While we identify the data sets used on this page, we do not store any further details, nor the data sets themselves on our site.
Related
- ID: 4188
- ID: 11660
 Produced Video
 - ID: 4167
 Visualization
Release date
This page was originally published on Thursday, September 25, 2014.
This page was last updated on Sunday, December 29, 2024 at 10:16 PM EST.