The Big CME that Missed Earth
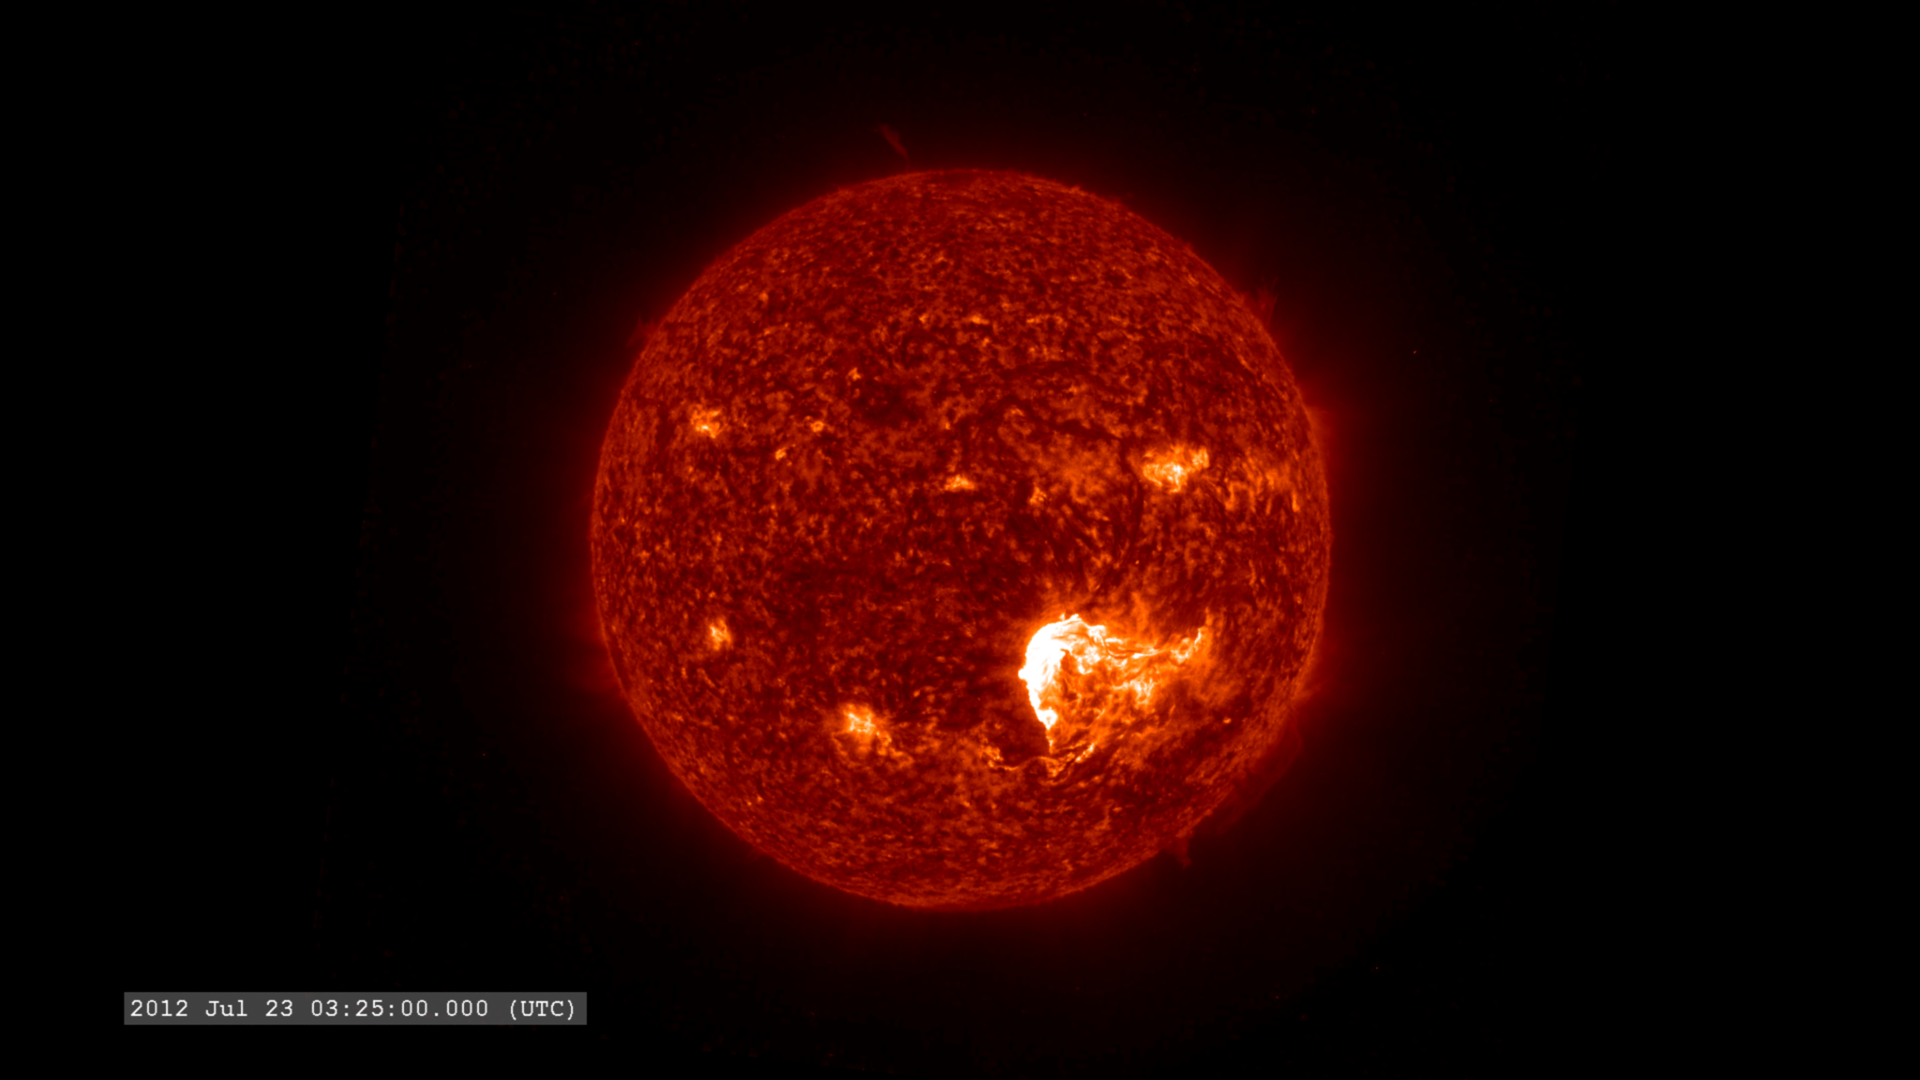
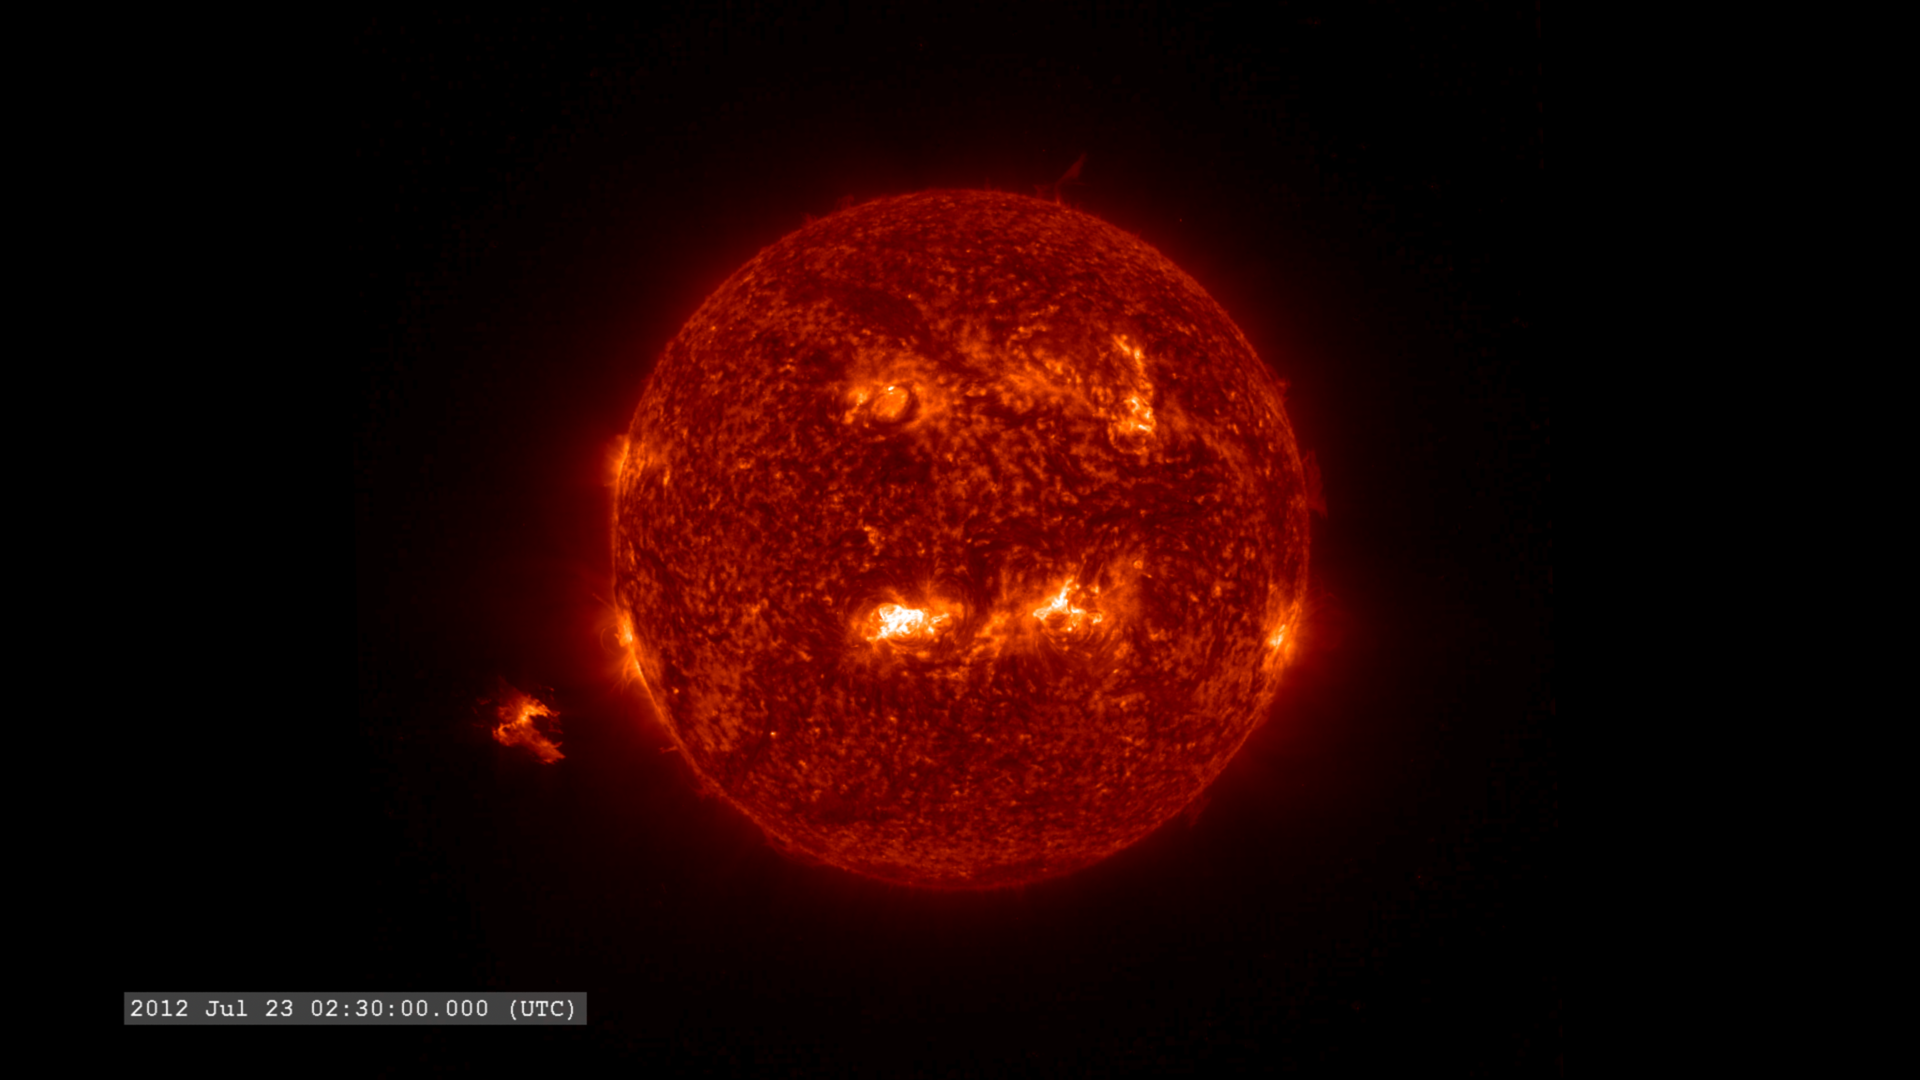
July of 2012 witnessed the eruption of a very large and fast solar coronal mass ejection (CME) (see NASA STEREO Observes One of the Fastest CMEs On Record and Carrington-class CME Narrowly Misses Earth ). While not directed at Earth, it was sufficiently large that it could have seriously disrupted the global electrical infrastructure. The event did impact STEREO-A of NASA's heliophysics fleet which provided a host of measurements (see Sentinels of the Heliosphere).
One of the conditions which contributed to the high speed of this event is that two smaller CMEs were launched a little earlier, and these events cleared out much of the solar wind material, leaving little to slow the outflow of the July 23 event (UTC).
In the visualizations below, generated from the Enlil space weather model, green represents particle density, usually protons and other ions. In green, we see the Parker spiral moving out from the sun generated by the sun's current sheet (Wikipedia). Red represents particles at high temperatures and shows the CME is hotter than the usual solar wind flow. Large changes in density are represented in blue. These three colors sometimes combine to tell us more about the characteristics of the event (noted in the 3-color Venn diagram below).
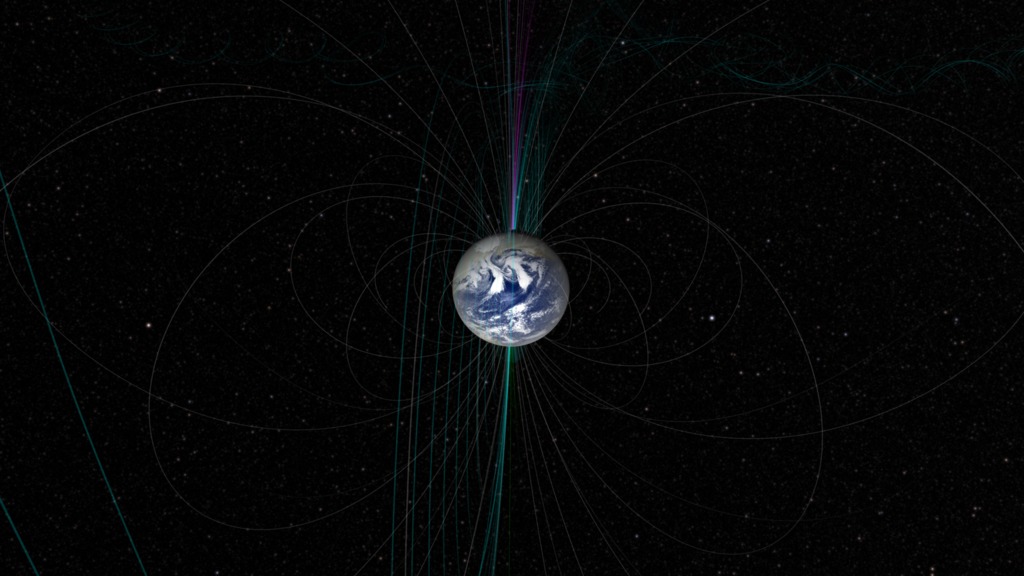
However, if this CME had struck Earth's magnetosphere, which has a much stronger magnetic field, the changing magnetic field would induce much larger voltages in systems with long electrical conductors, such as power lines that run over long distances. These significantly higher voltages can damage power transformers.
Enlil model run of the July 23, 2012 CME and events leading up to it. This view includes a 'top-down' view in the plane of Earth's orbit, as well as a slice perpendicular to the orbit which passes through Earth. We see the previous CME pass Earth, but not the July 23 event.
This video is also available on our YouTube channel.
Enlil model run of the July 23, 2012 CME and events leading up to it. This view is a 'top-down' view in the plane of Earth's orbit.

The mass density in atomic mass units (AMUs) per cubic centimeter. 1 AMU/cc corresponds to 1 hydrogen ion or atom per cc. IMPORTANT NOTE: This color bar applies to the large movies above.
Enlil model run of the July 23, 2012 CME and events leading up to it. This movie provides a better view of the inner solar system for the CME event. The density color table has been altered accordingly. This view includes a 'top-down' view in the plane of Earth's orbit, as well as a slice perpendicular to the orbit which passes through Earth. We see the previous CME pass Earth, but not the July 23 event.
Enlil model run of the July 23, 2012 CME and events leading up to it. This movie provides a better view of the inner solar system for the CME event. The density color table has been altered accordingly. This view is a 'top-down' view in the plane of Earth's orbit.
Due to the higher particle densities in the inner solar system, this density color table applies to the inner solar system movies above. The upper density limit is 100 atoms/cc.
Plasma temperture scale, in Kelvin.
This color table represents how displaying each of the three variables as separate red, green, and blue color ramps combine to identify characteristics in the solar wind and CME.
Enlil model run of the July 23, 2012 CME and events leading up to it. This view includes a 'top-down' view in the plane of Earth's orbit, but rotated so STEREO-A is the focus of the event. The slice perpendicular to the orbit passes through STEREO-A so we can see the July 23 event hit STEREO-A.
Enlil model run of the July 23, 2012 CME and events leading up to it. This view includes a 'top-down' view in the plane of Earth's orbit, but rotated so STEREO-A is the focus of the event. The slice perpendicular to the orbit passes through STEREO-A so we can see the July 23 event hit STEREO-A.
For More Information
See Science@NASA
Credits
Please give credit for this item to:
NASA's Scientific Visualization Studio, the Space Weather Research Center (SWRC), the Community-Coordinated Modeling Center (CCMC), Enlil and Dusan Odstrcil (GMU), Leila Mays (CUA) and Janet Luhmann (UCB) and NASA's Scientific Visualization Studio.
-
Animator
- Tom Bridgman (Global Science and Technology, Inc.)
-
Scientists
- Dusan Odstrcil (George Mason University)
- M. Leila Mays (Catholic University of America)
- Janet G. Luhmann (University of California at Berkeley)
-
Project support
- Laurence Schuler (ADNET Systems, Inc.)
- Ian Jones (ADNET Systems, Inc.)
Release date
This page was originally published on Wednesday, July 23, 2014.
This page was last updated on Tuesday, November 14, 2023 at 12:05 AM EST.
Missions
This visualization is related to the following missions:Series
This visualization can be found in the following series:Datasets used in this visualization
-
Enlil Heliospheric Model (Enlil Heliospheric Model)
ID: 685MHD solar wind simulation
See all pages that use this dataset -
DE421 (JPL DE421)
ID: 752Planetary ephemerides
This dataset can be found at: http://ssd.jpl.nasa.gov/?ephemerides#planets
See all pages that use this dataset
Note: While we identify the data sets used in these visualizations, we do not store any further details, nor the data sets themselves on our site.
Related
- ID: 4189
 Visualization
 - ID: 11558
 Produced Video
 - ID: 4172
 Visualization
 - ID: 4177
 Visualization
 - ID: 4178
 Visualization