Earth
ID: 4784
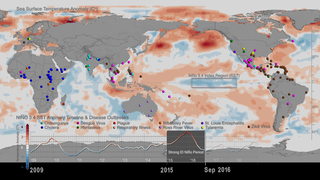
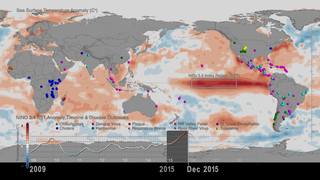
El Niño-Southern Oscillation (ENSO) is an irregularly recurring climate pattern characterized by warmer (El Niño) and colder (La Niña) than usual ocean temperatures in the equatorial Pacific, which creates a ripple effect of anticipated weather changes in far-spread regions of our planet. Weather changes associated with the ENSO phenomenon result in climate anomalies related to each other, such as rainfall, and vegetation anomaly conditions that trigger outbreaks of infectious diseases of public health concern in different regions around the world. These distant weather effects are called teleconnections. Therefore the effects of ENSO are called ENSO teleconnections, highlighting that warmer or colder than usual ocean temperatures in equatorial pacific with extents (5N-5S, 120W-170W) affect areas far from the source typically 2-3 months after.
During the last 20 years NASA scientist Dr. Assaf Anyamba and colleagues have been studying ENSO teleconnections by monitoring various climate datasets, among them Sea Surface Temperature and Precipitation Anomaly datasets from NASA and National Oceanic and Atmospheric Administration (NOAA) and Vegetation Index Anomalies from NASA’s Earth Observing System Moderate Resolution Imaging Spectroradiometer (MODIS) instrument aboard the Terra (EOS AM-1) spacecraft. At the same time, the science team has been collecting, cataloguing and analyzing patterns and sources of infectious disease outbreaks worldwide (see data visualization Sea Surface Temperature anomalies and patterns of Global Disease Outbreaks: 2009-2018 (4K version)). Furthermore, the science team has been collecting data on mosquito vectors from different sites and carrying out long-term comprehensive research studies in South Africa to gain a better understanding of all components of Rift Valley fever including livestock, wildlife and humans.
Rift Valley fever (RVF) is an acute viral disease of domestic animals (cattle, buffalo, sheep, goats, and camels), but it also affects humans. It is spread by the bite of various Aedes and Culex mosquito species that carry the Rift Valley fever virus (RVFV). Large outbreaks termed epizootics (in livestock) and epidemics (humans) occur during periods of above normal and persistent rainfall. Such rainfall, floods mosquito habitats called dambos or pans leading to emergence of large numbers of RVF mosquito vectors. Rift Valley fever disease causes severe mortalities (80-100%) and abortion in livestock affecting the trade economy in the regions it occurs (for ex. ~$60M loss in East Africa during the 2006-2007 outbreak, ~$17.8M loss in South Africa, during the 2010 outbreak). In humans, RVF can manifest in various ways. For example, it can vary from a mild influenza-like illness and it can even cause severe hemorrhage, but also it can turn into hepatitis, retinitis (inflammation of the retina) and encephalitis (inflammation of the brain). The mortality in humans varies and ranges between 1-35% of those infected. It is classified as a cross-over pathogen of national and international security and of public health importance.
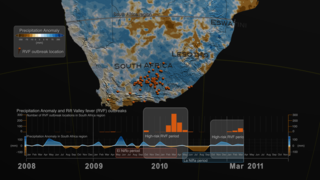
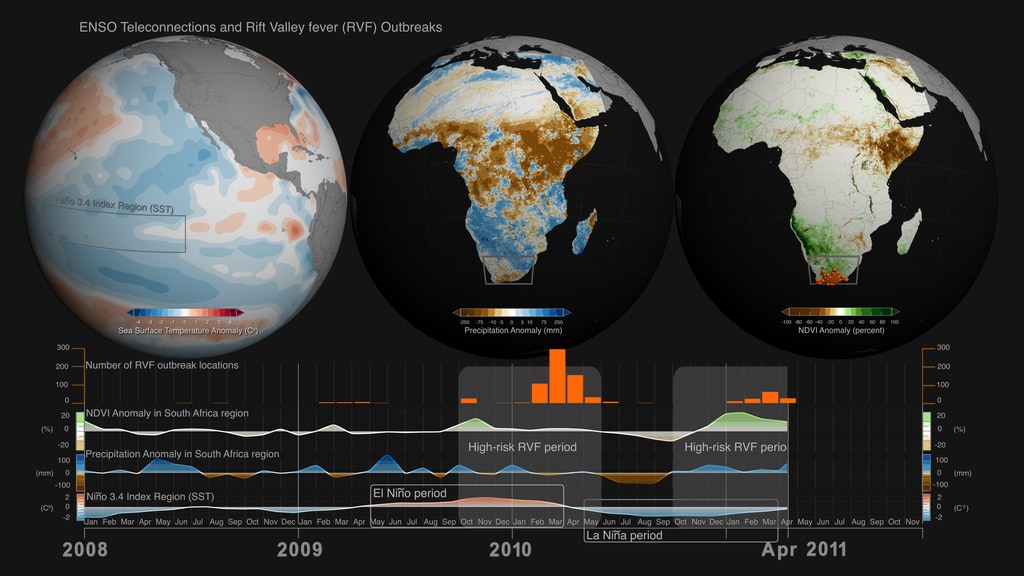
The data visualization featured on this page showcases the relationship between ENSO teleconnections and Rift Valley fever outbreaks in South Africa during the period 2008-2011. The visualization comprises of two parts:
Top:
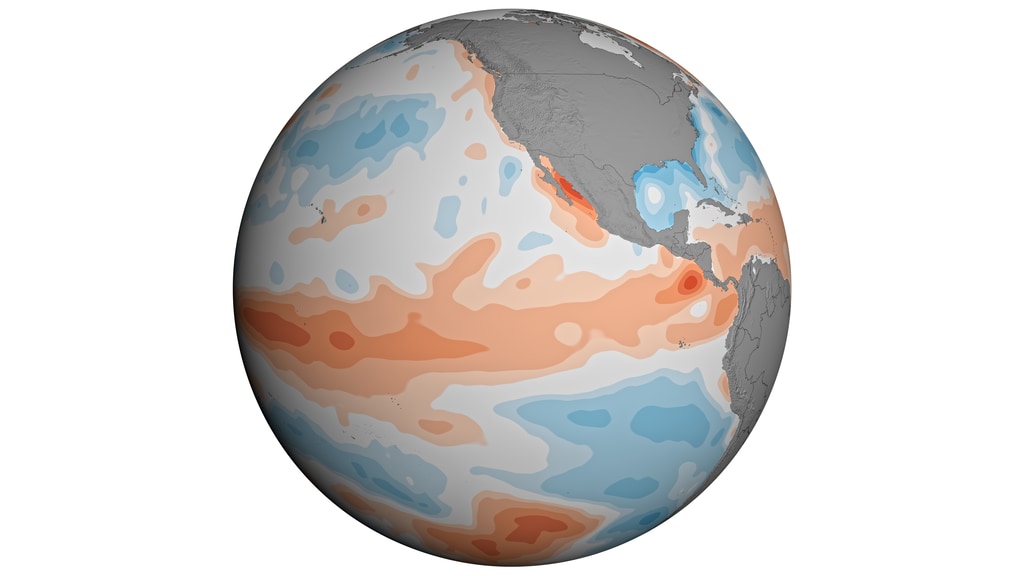
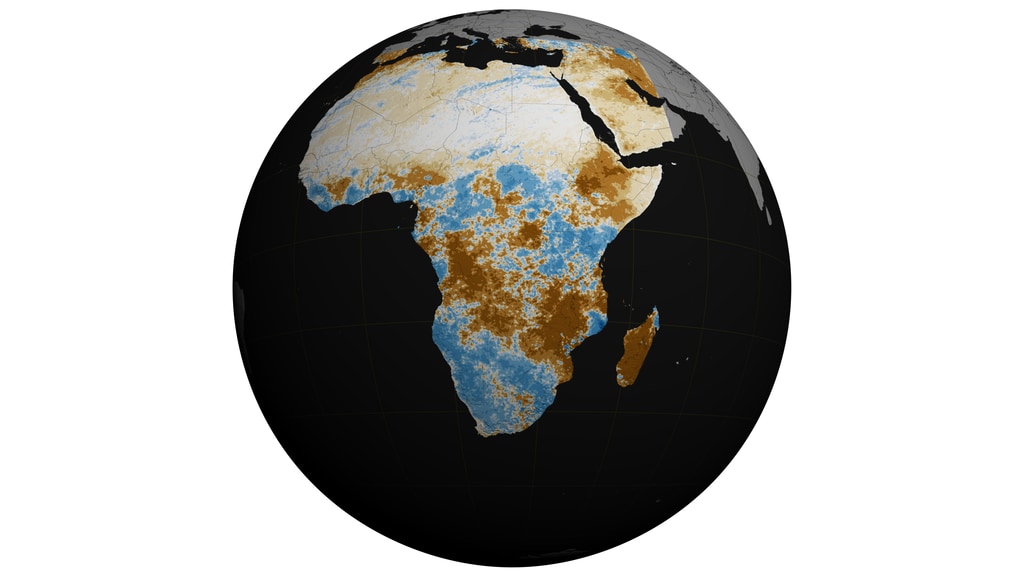
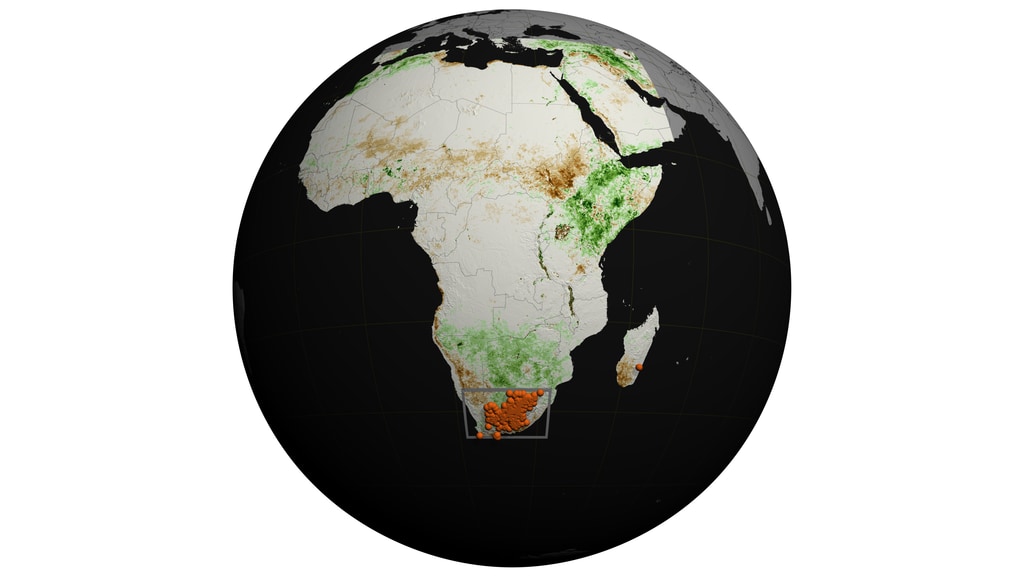
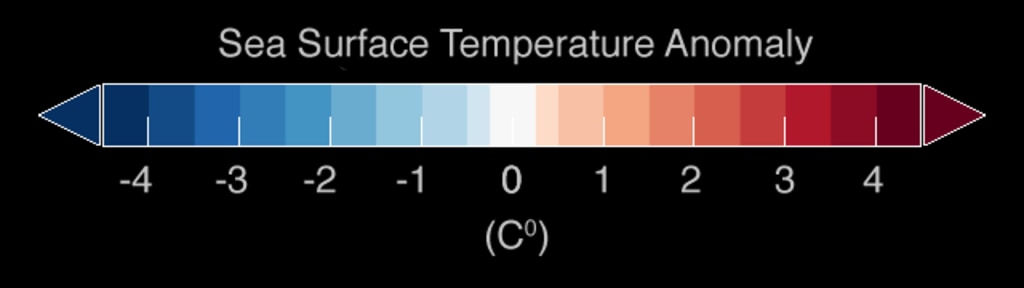
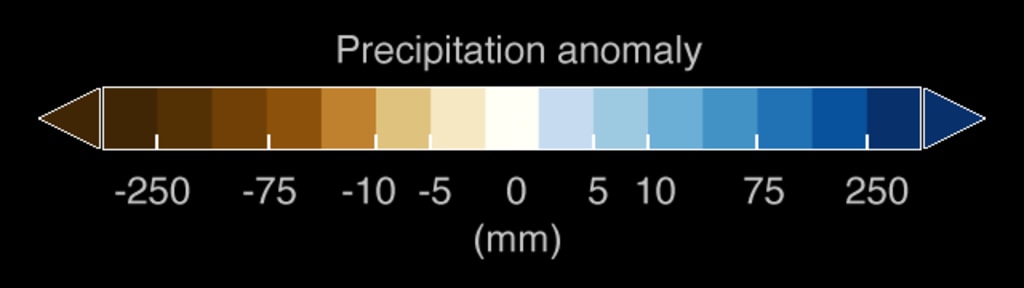
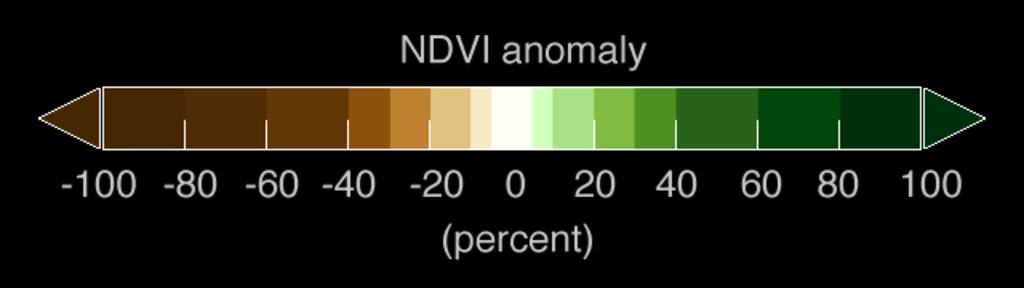
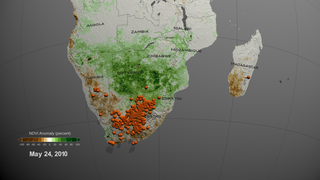
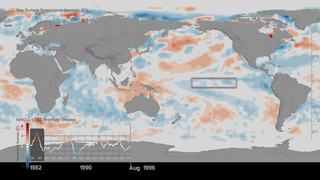
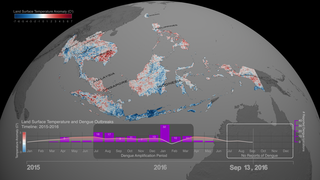
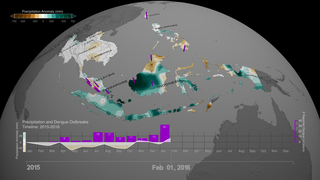
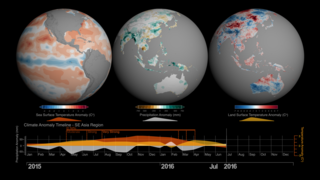
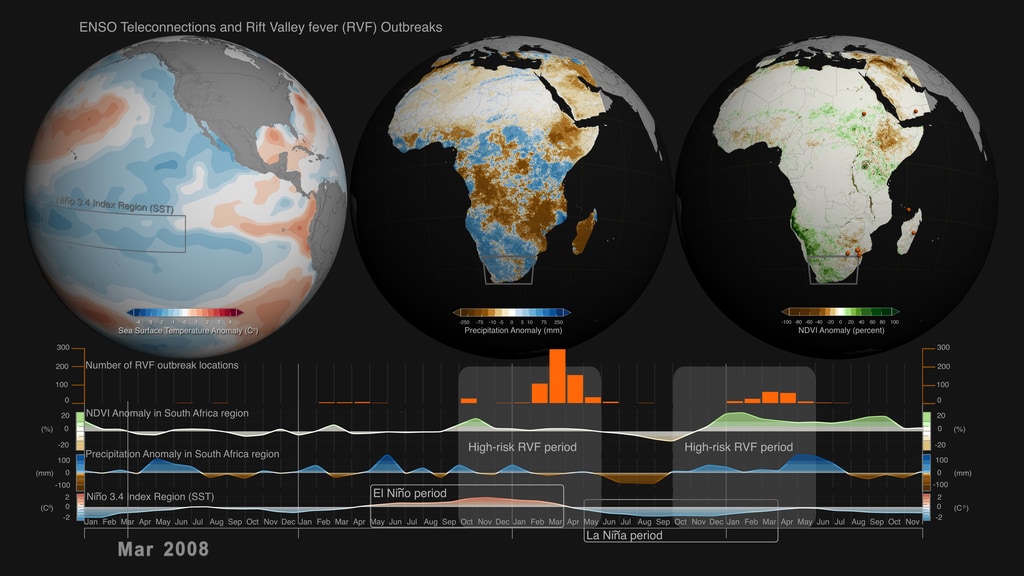
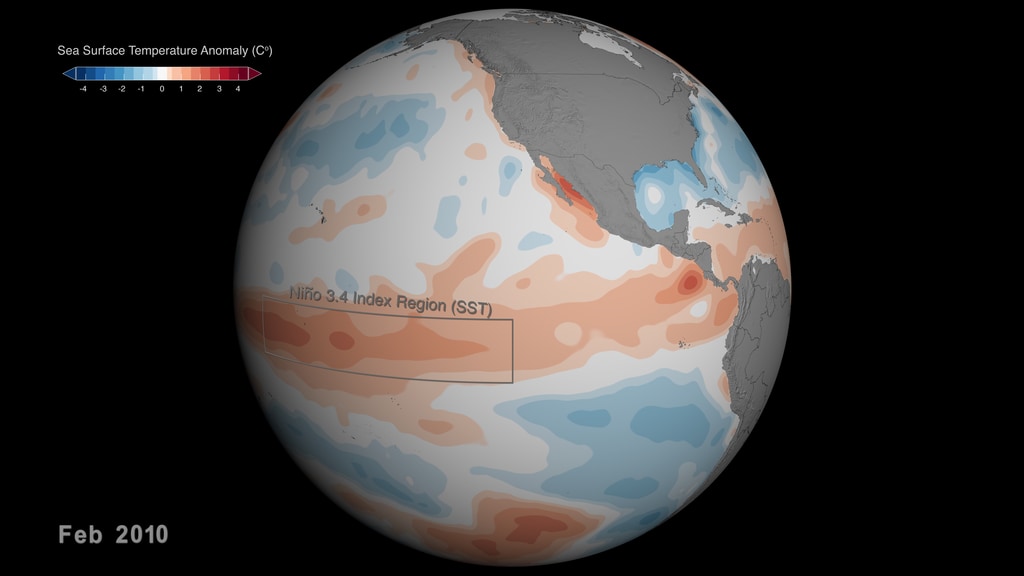
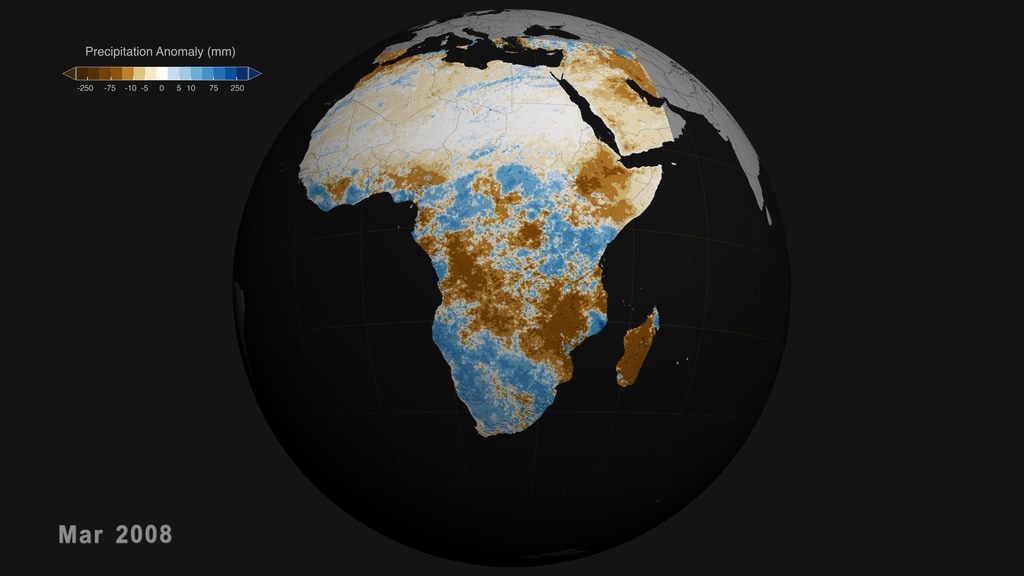
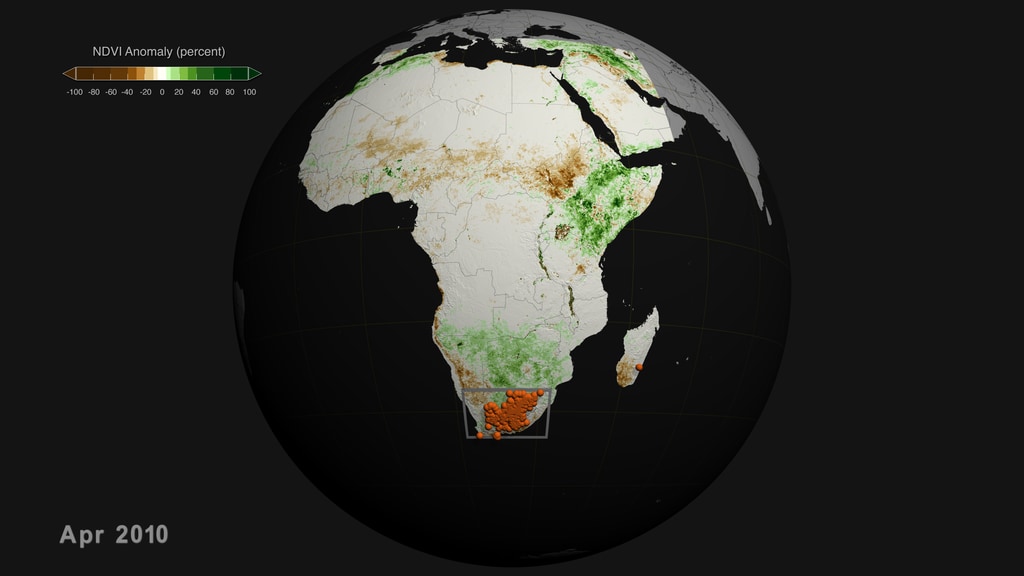
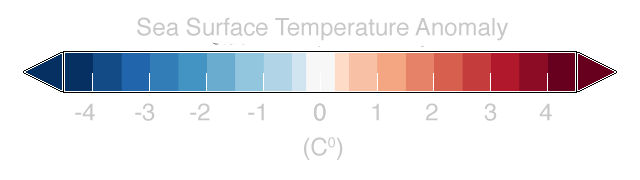
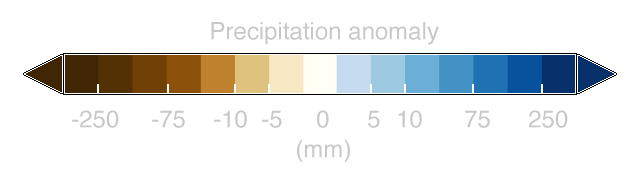
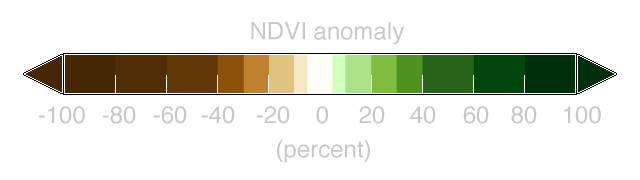
On the top part we can see three separate spheres representing the earth with three distinct datasets. On the left, Sea Surface Temperature (SST) anomaly data are mapped on water and over the equatorial Pacific, the Nino 3.4 Index SST region is highlighted. In the middle Precipitation anomaly data has been mapped over the land in the African continent. A grey inset highlights the South Africa region of interest. On the right vegetation index anomalies and Rift Valley fever outbreak locations have been mapped in the African continent and a grey inset highlights the region of interest. The region of interest is the area where RVF outbreaks peak with extents (15E-33E, 26S-35S).
Bottom:
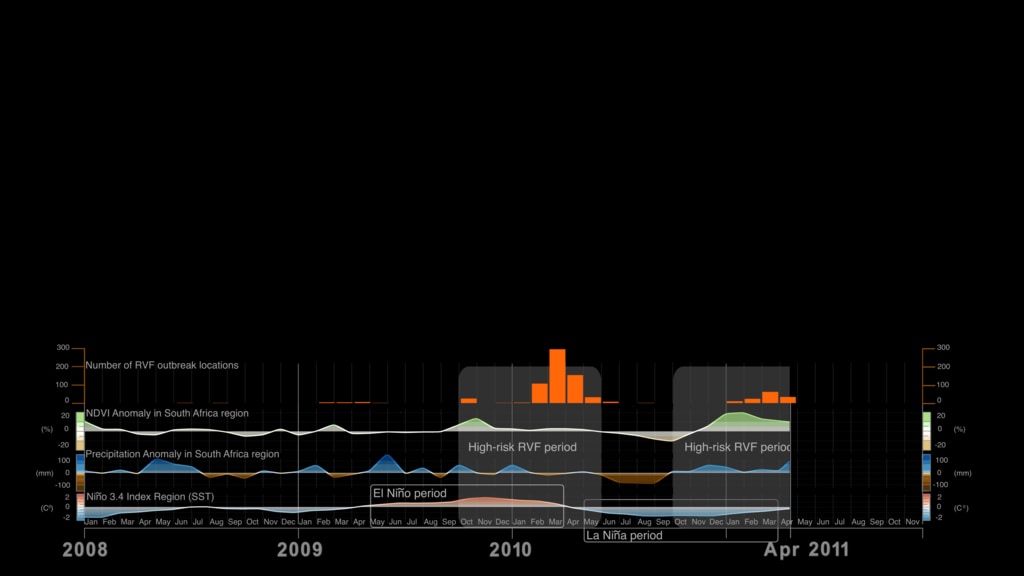
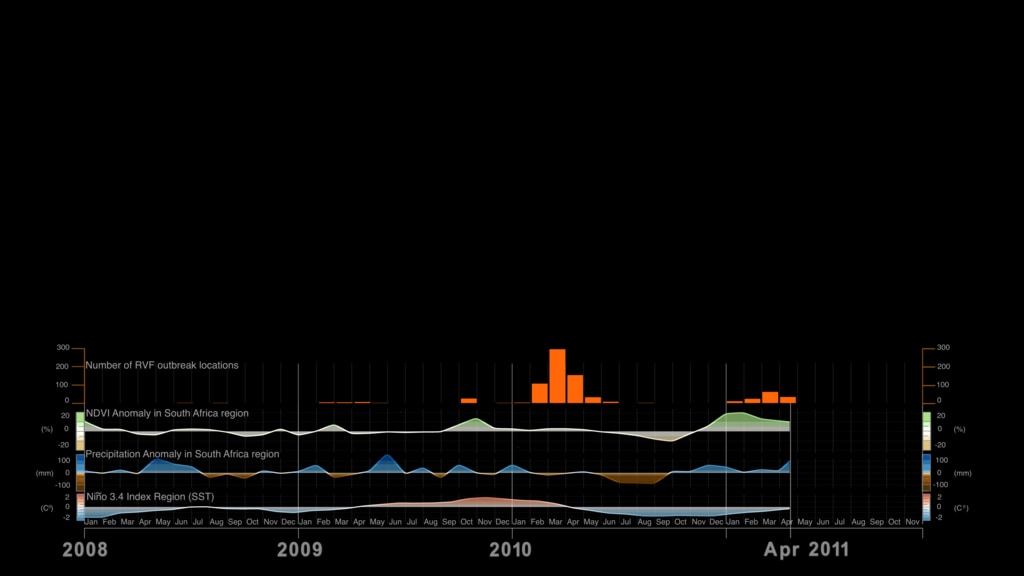
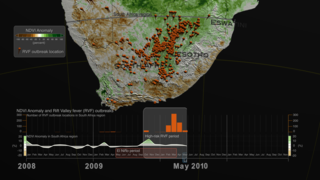
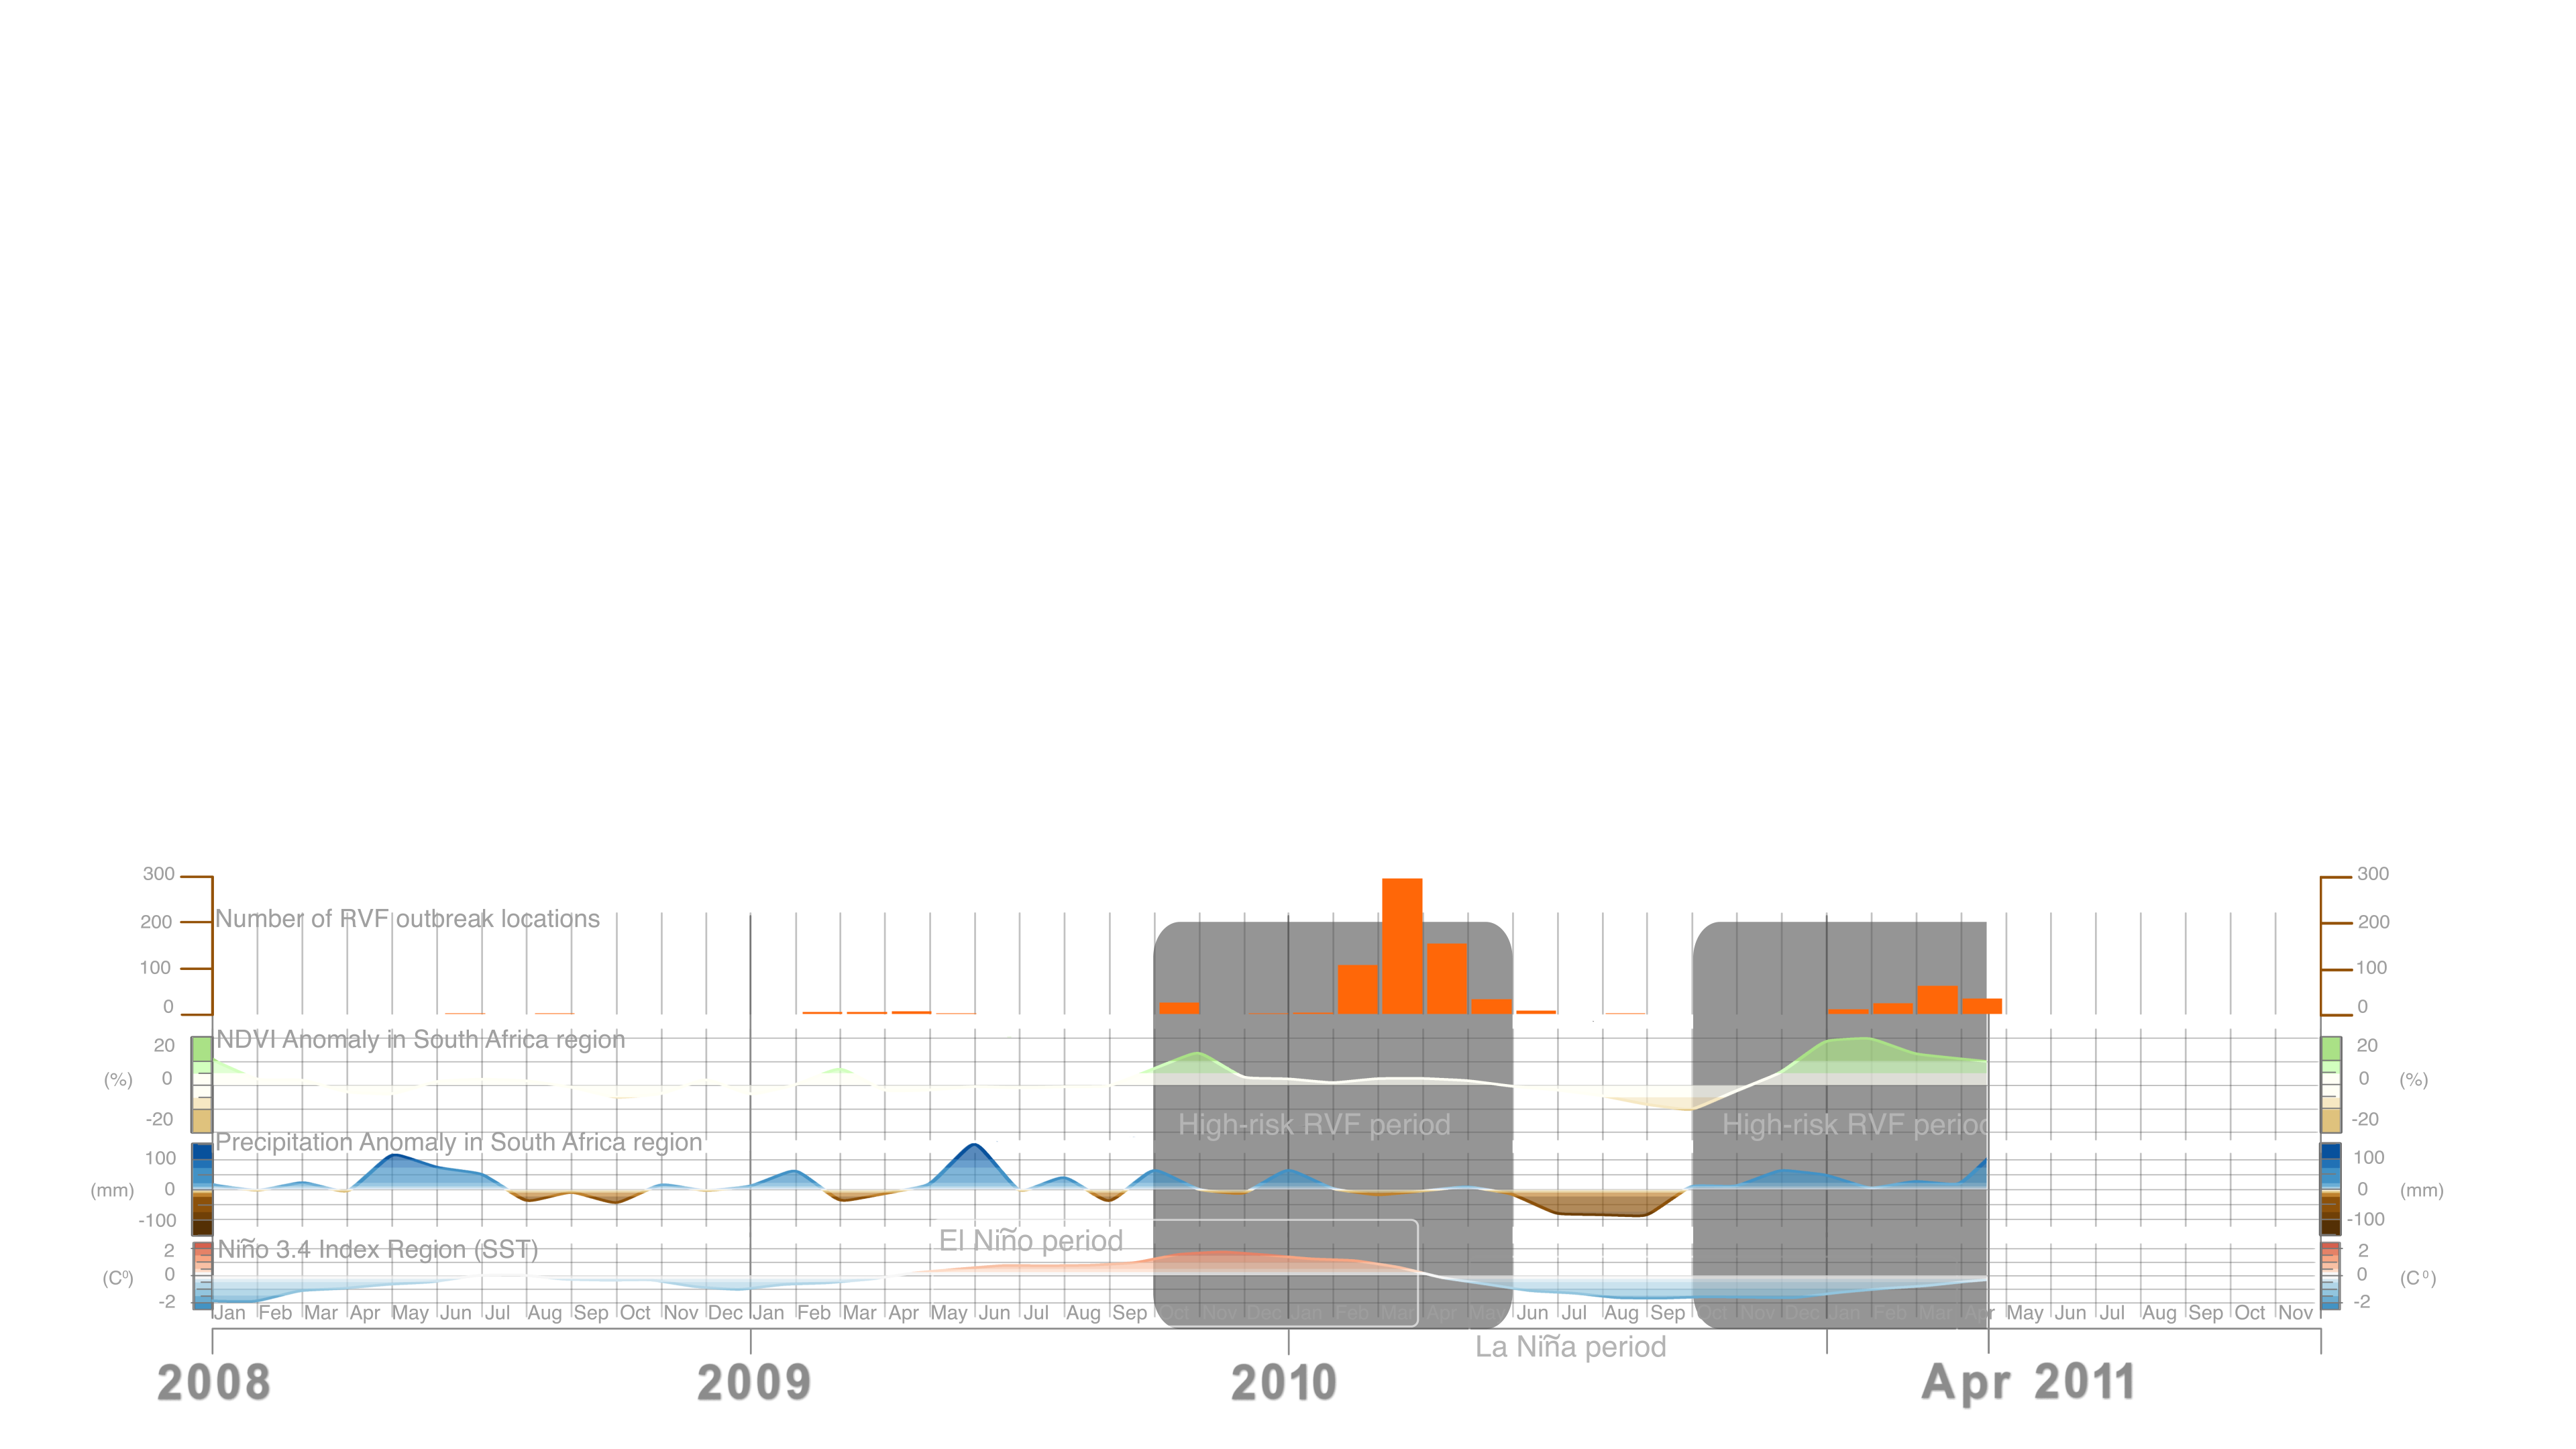
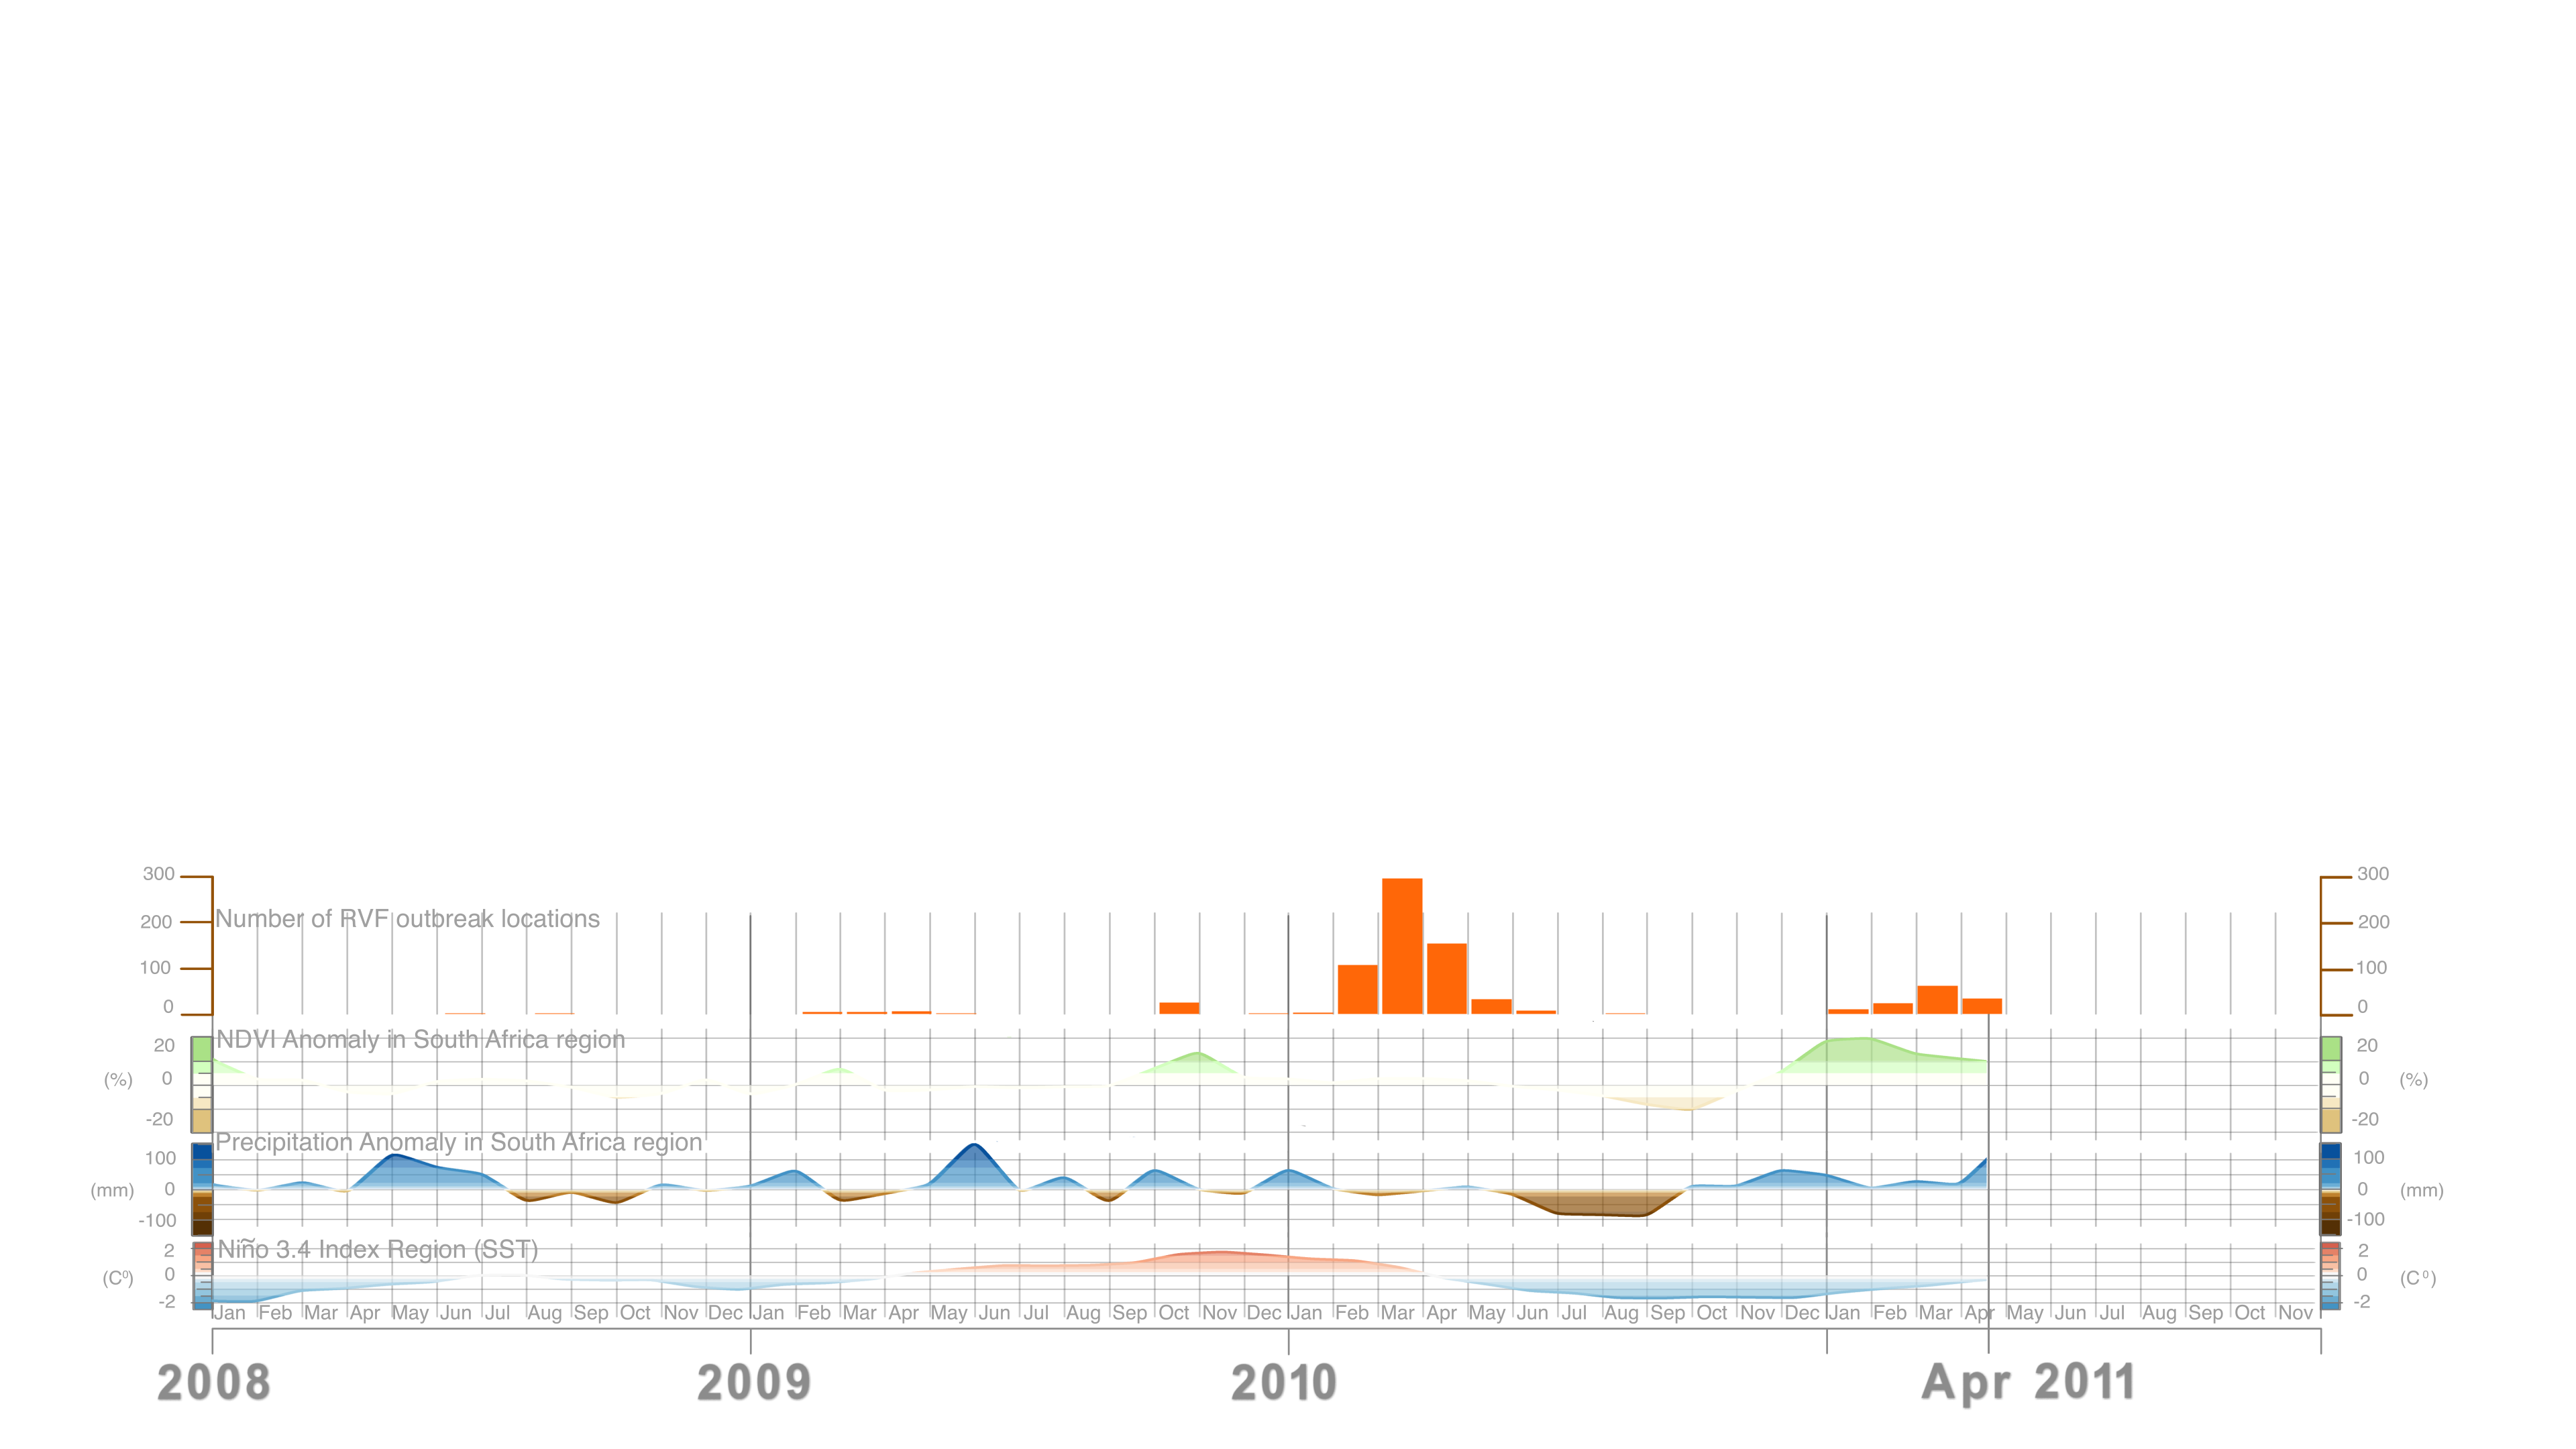
On the bottom, a synchronized data dashboard for the same period, tracks and visualizes indicators from the four different data sources represented in the top part. These four indicators are:
As the timeline unfolds, labels reveal the El Niño, La Niña periods and the high-risk RVF periods to help guide the viewer on the patterns and teleconnections.
We can see a spike of RVF outbreaks during February-May 2010 and another one during February-May 2011. These outbreaks are linked to ENSO teleconnections during the period of 2008-2011. The relationship between ENSO induced anomalous rainfall and disease outbreaks is clearly illustrated by outbreak patterns of Rift Valley fever in South Africa. During the La Niña phase of ENSO, Southern Africa receives persistent and above normal rainfall, which floods habitats of RVF mosquito vectors triggering hatching of RVF virus infected eggs. The above-normal rainfall is followed by an increase in vegetation creating appropriate habitats for the mosquito vectors setting the stage for RVF outbreak activity, which in simple terms means an uptick in mosquito populations that cause infections of domestic livestock and human populations with the RVF virus. However, in rare cases there is a departure from this canonical response, as we can observe in 2009-2010, when a mild El Niño event resulted in above normal rainfall and a large RVF outbreak in central South Africa.
To explain a bit further the weather patterns and teleconnections, lets take a closer look at the sequence of events and their timelines. During 2009-2010 the El Niño event (May 2009-March 2010) was followed by an increase in rainfall in South Africa. This cumulative precipitation resulted in an increase of vegetation that manifested on October 2009. This increase of vegetation was followed by a spike of RVF outbreaks starting 3 months after (January/February 2010). The impacts of precipitation and vegetation on the outbreaks of RVF in the region of South Africa have been visualized with data on the entries: Precipitation Anomaly and Rift Valley fever (RVF) outbreaks in South Africa: 2008-2011 and Vegetation Index Anomalies and Rift Valley fever (RVF) outbreaks in South Africa region: 2008-2011
The strong relationship between ENSO events and disease outbreaks underscores the importance of seasonal forecasts. Since disease outbreaks typically manifest 2-3 months after the start of El Niño and La Nina events, early and regular climate monitoring, paired with the use of monthly and seasonal climate forecasts become significant tools for disease control and prevention. Findings of an earlier scientific study by Dr. Assaf Anyamba et al. published in the journal Nature Scientific Reports with the title Global Disease Outbreaks Associated with the 2015-2016 El Niño event suggests that by monitoring monthly climate datasets, country public health agencies and organizations such as the United Nations' World Health Organization and Food and Agriculture Organizations, can utilize early warning forecasts to undertake preventive measures to minimize the spread of ecologically coupled diseases.
Data Sources:
Supported with funding from the Defense Health Agency-Armed Forces Health Surveillance Branch (AFHSB) Global Emerging Infections Surveillance and Response System (GEIS) under Project #P0072_19_NS
The rest of this webpage offers additional versions, colorbar information, frames and layers associated with the development of this data-driven visualization.


ENSO Teleconnections and Rift Valley fever (RVF) Outbreaks
During the last 20 years NASA scientist Dr. Assaf Anyamba and colleagues have been studying ENSO teleconnections by monitoring various climate datasets, among them Sea Surface Temperature and Precipitation Anomaly datasets from NASA and National Oceanic and Atmospheric Administration (NOAA) and Vegetation Index Anomalies from NASA’s Earth Observing System Moderate Resolution Imaging Spectroradiometer (MODIS) instrument aboard the Terra (EOS AM-1) spacecraft. At the same time, the science team has been collecting, cataloguing and analyzing patterns and sources of infectious disease outbreaks worldwide (see data visualization Sea Surface Temperature anomalies and patterns of Global Disease Outbreaks: 2009-2018 (4K version)). Furthermore, the science team has been collecting data on mosquito vectors from different sites and carrying out long-term comprehensive research studies in South Africa to gain a better understanding of all components of Rift Valley fever including livestock, wildlife and humans.
Rift Valley fever (RVF) is an acute viral disease of domestic animals (cattle, buffalo, sheep, goats, and camels), but it also affects humans. It is spread by the bite of various Aedes and Culex mosquito species that carry the Rift Valley fever virus (RVFV). Large outbreaks termed epizootics (in livestock) and epidemics (humans) occur during periods of above normal and persistent rainfall. Such rainfall, floods mosquito habitats called dambos or pans leading to emergence of large numbers of RVF mosquito vectors. Rift Valley fever disease causes severe mortalities (80-100%) and abortion in livestock affecting the trade economy in the regions it occurs (for ex. ~$60M loss in East Africa during the 2006-2007 outbreak, ~$17.8M loss in South Africa, during the 2010 outbreak). In humans, RVF can manifest in various ways. For example, it can vary from a mild influenza-like illness and it can even cause severe hemorrhage, but also it can turn into hepatitis, retinitis (inflammation of the retina) and encephalitis (inflammation of the brain). The mortality in humans varies and ranges between 1-35% of those infected. It is classified as a cross-over pathogen of national and international security and of public health importance.
The data visualization featured on this page showcases the relationship between ENSO teleconnections and Rift Valley fever outbreaks in South Africa during the period 2008-2011. The visualization comprises of two parts:
Top:
On the top part we can see three separate spheres representing the earth with three distinct datasets. On the left, Sea Surface Temperature (SST) anomaly data are mapped on water and over the equatorial Pacific, the Nino 3.4 Index SST region is highlighted. In the middle Precipitation anomaly data has been mapped over the land in the African continent. A grey inset highlights the South Africa region of interest. On the right vegetation index anomalies and Rift Valley fever outbreak locations have been mapped in the African continent and a grey inset highlights the region of interest. The region of interest is the area where RVF outbreaks peak with extents (15E-33E, 26S-35S).
Bottom:
On the bottom, a synchronized data dashboard for the same period, tracks and visualizes indicators from the four different data sources represented in the top part. These four indicators are:
- Number of Rift Valley fever (RVF) disease outbreak locations in the South Africa region with extents (15E-33E, 26S-35S)
- Normalized Difference Vegetation Index (NDVI) Anomaly in the South Africa region with extents 1(5E-33E, 26S-35S)
- Precipitation Anomaly in the South Africa region with extents (15E-33E, 26S-35S)
- Nino 3.4 Index Region Sea Surface Temperature Anomaly (SST) with extents (5N-5S, 120W-170W)
As the timeline unfolds, labels reveal the El Niño, La Niña periods and the high-risk RVF periods to help guide the viewer on the patterns and teleconnections.
We can see a spike of RVF outbreaks during February-May 2010 and another one during February-May 2011. These outbreaks are linked to ENSO teleconnections during the period of 2008-2011. The relationship between ENSO induced anomalous rainfall and disease outbreaks is clearly illustrated by outbreak patterns of Rift Valley fever in South Africa. During the La Niña phase of ENSO, Southern Africa receives persistent and above normal rainfall, which floods habitats of RVF mosquito vectors triggering hatching of RVF virus infected eggs. The above-normal rainfall is followed by an increase in vegetation creating appropriate habitats for the mosquito vectors setting the stage for RVF outbreak activity, which in simple terms means an uptick in mosquito populations that cause infections of domestic livestock and human populations with the RVF virus. However, in rare cases there is a departure from this canonical response, as we can observe in 2009-2010, when a mild El Niño event resulted in above normal rainfall and a large RVF outbreak in central South Africa.
To explain a bit further the weather patterns and teleconnections, lets take a closer look at the sequence of events and their timelines. During 2009-2010 the El Niño event (May 2009-March 2010) was followed by an increase in rainfall in South Africa. This cumulative precipitation resulted in an increase of vegetation that manifested on October 2009. This increase of vegetation was followed by a spike of RVF outbreaks starting 3 months after (January/February 2010). The impacts of precipitation and vegetation on the outbreaks of RVF in the region of South Africa have been visualized with data on the entries: Precipitation Anomaly and Rift Valley fever (RVF) outbreaks in South Africa: 2008-2011 and Vegetation Index Anomalies and Rift Valley fever (RVF) outbreaks in South Africa region: 2008-2011
The strong relationship between ENSO events and disease outbreaks underscores the importance of seasonal forecasts. Since disease outbreaks typically manifest 2-3 months after the start of El Niño and La Nina events, early and regular climate monitoring, paired with the use of monthly and seasonal climate forecasts become significant tools for disease control and prevention. Findings of an earlier scientific study by Dr. Assaf Anyamba et al. published in the journal Nature Scientific Reports with the title Global Disease Outbreaks Associated with the 2015-2016 El Niño event suggests that by monitoring monthly climate datasets, country public health agencies and organizations such as the United Nations' World Health Organization and Food and Agriculture Organizations, can utilize early warning forecasts to undertake preventive measures to minimize the spread of ecologically coupled diseases.
Data Sources:
- Sea Surface Temperature (SST) data: The SST known as the NOAA OI.v2 SST monthly fields are derived by a linear interpolation of the weekly optimum interpolation (OI) version 2 fields to daily fields then averaging the daily values over a month. The analysis uses in situ and satellite SST's plus SST's simulated by sea-ice cover. Before the analysis is computed, the satellite data is adjusted for biases using the method of Reynolds (1988) and Reynolds and Marsico (1993). The SST dataset is available here.
- SST ENSO index (Niño 3.4) for the period 2009-2018 is obtained from the NOAA National Center for Climate Prediction online archives. The warm (El Niño) and cold (La Niña) periods of ENSO events were determined using the Oceanic Niño Index (ONI) threshold of +/- 0.5 degress Celcius based on centered 30-year base periods updated every 5 years. The ONI is a 3-month running mean of Extended Reconstructed Sea Surface Temperature (ERSST) Version 4 (v4) SST anomalies in the Niño 3.4 region (5 N-5 S, 120W-170W).
- Disease Outbreak data were collected from the Program for Monitoring Emerging Diseases (ProMED) and the World Organisation for Animal Health/Organisation mondiale de la santé animale (OIE).
- Rainfall/Precipitation anomaly data: African Rainfall Climatology (ARC) dataset from the National Oceanic and Atmospheric Administration (NOAA) – Climate Prediction Center (CPC) archives. The dataset is available over Africa at 0.1° x 0.1° spatial resolution from 1983 to present. Reference: Novella, N.S. and W.M. Thiaw, 2016: A Seasonal Rainfall Performance Probability Tool for Famine Early Warning Systems. J. Appl. Meteor. Climatol., 55, 2575–2586, 10.1175/JAMC-D-16-0111.1
- Normalized Difference Vegetation Index (NDVI) dataset is derived from NASA’s Earth Observing System Moderate Resolution Imaging Spectroradiometer (MODIS) instrument aboard the Terra (EOS AM-1) spacecraft. We used the MODIS global monthly Climate Modeling Grid (CMG) products with a spatial resolution of 0.05° x 0.05° (~5.5 x 5.5 km). The data is available through this portal. Reference: Townshend, J. & Justice, Christopher. (2002). Towards operational monitoring of terrestrial systems by moderate-resolution remote sensing. Remote Sensing of Environment. Volume 83, Issues 1-2, Pages: 351-359. 10.1016/S0034-4257(02)00082-2.
Supported with funding from the Defense Health Agency-Armed Forces Health Surveillance Branch (AFHSB) Global Emerging Infections Surveillance and Response System (GEIS) under Project #P0072_19_NS
The rest of this webpage offers additional versions, colorbar information, frames and layers associated with the development of this data-driven visualization.
Used Elsewhere In

Related


Visualization Credits
Lead Visualizer:
Helen-Nicole Kostis (USRA)
Visualizer:
Greg Shirah (NASA/GSFC)
Lead Scientists:
Assaf Anyamba (USRA)
Radina Soebiyanto (USRA)
Science Support:
Jennifer Small (SSAI)
Richard Damoah (Morgan State University)
Outbreak Data Curators:
Sarah Hutchinson (Intern)
Destini Garrison (Intern)
Project Support:
Eric Sokolowsky (Global Science and Technology, Inc.)
Leann Johnson (Global Science and Technology, Inc.)
Technical Support:
Ian Jones (ADNET Systems, Inc.)
Laurence Schuler (ADNET Systems, Inc.)
Please give credit for this item to:
NASA's Scientific Visualization Studio
NASA's Scientific Visualization Studio
Short URL to share this page:
https://svs.gsfc.nasa.gov/4784
Data Used:
Note: While we identify the data sets used in these visualizations, we do not store any further details nor the data sets themselves on our site.
Keywords:
DLESE >> Climatology
SVS >> El Nino
DLESE >> Environmental science
DLESE >> Human geography
SVS >> SST Anomaly
GCMD >> Earth Science >> Climate Indicators >> Drought Indices
GCMD >> Earth Science >> Climate Indicators >> Precipitation Indices
GCMD >> Earth Science >> Climate Indicators >> Teleconnections >> El Nino Southern Oscillation
GCMD >> Earth Science >> Human Dimensions >> Human Health >> Diseases/Epidemics
GCMD >> Earth Science >> Human Dimensions >> Human Health >> Public Health
SVS >> Hyperwall
NASA Science >> Earth
GCMD >> Earth Science >> Human Dimensions >> Public Health >> Diseases/epidemics
SVS >> Diseases
NASA Earth Science Focus Areas >> Climate Variability and Change
GCMD keywords can be found on the Internet with the following citation: Olsen, L.M., G. Major, K. Shein, J. Scialdone, S. Ritz, T. Stevens, M. Morahan, A. Aleman, R. Vogel, S. Leicester, H. Weir, M. Meaux, S. Grebas, C.Solomon, M. Holland, T. Northcutt, R. A. Restrepo, R. Bilodeau, 2013. NASA/Global Change Master Directory (GCMD) Earth Science Keywords. Version 8.0.0.0.0
https://svs.gsfc.nasa.gov/4784
Data Used:
NOAA/Monthly Sea Surface Temperature (SST) OI.v2 also referred to as: NOAA OI.v2 SST
NOAA - 2008-2011NOAA Climate Prediction Center/Monthly Sea Surface Temperature (SST) ENSO Index (Niño 3.4)
NOAA - 2008-2011NOAA Climate Prediction Center/Monthly African Rainfall Climatology (ARC) also referred to as: Rainfall/Precipitation Anomaly
Observed Data - NOAA - 2008-2011Disease Outbreak Data from the Program for Monitoring Emerging Diseases (ProMED) also referred to as: ProMED Disease Outbreak Data
ProMED - 2008-2011Disease Outbreak Data from the World Organisation for Animal Health/Organisation mondiale de la santé animale (OIE)
World Organisation for Animal Health/Organisation mondiale de la santé animale (OIE) - 2008-2011NASA/Terra/MODIS/Global Monthly Normalized Difference Vegetation Index (NDVI)
2008-2011Keywords:
DLESE >> Climatology
SVS >> El Nino
DLESE >> Environmental science
DLESE >> Human geography
SVS >> SST Anomaly
GCMD >> Earth Science >> Climate Indicators >> Drought Indices
GCMD >> Earth Science >> Climate Indicators >> Precipitation Indices
GCMD >> Earth Science >> Climate Indicators >> Teleconnections >> El Nino Southern Oscillation
GCMD >> Earth Science >> Human Dimensions >> Human Health >> Diseases/Epidemics
GCMD >> Earth Science >> Human Dimensions >> Human Health >> Public Health
SVS >> Hyperwall
NASA Science >> Earth
GCMD >> Earth Science >> Human Dimensions >> Public Health >> Diseases/epidemics
SVS >> Diseases
NASA Earth Science Focus Areas >> Climate Variability and Change
GCMD keywords can be found on the Internet with the following citation: Olsen, L.M., G. Major, K. Shein, J. Scialdone, S. Ritz, T. Stevens, M. Morahan, A. Aleman, R. Vogel, S. Leicester, H. Weir, M. Meaux, S. Grebas, C.Solomon, M. Holland, T. Northcutt, R. A. Restrepo, R. Bilodeau, 2013. NASA/Global Change Master Directory (GCMD) Earth Science Keywords. Version 8.0.0.0.0


