Earth
ID: 4754
Earth’s atmosphere is mainly comprised of nitrogen and oxygen but also contains traces of hundreds of chemical compounds. While tiny in abundance, these chemicals have an outsized impact on humans and the environment due to their reactivity and toxicity. This visualization shows a computer simulation of the complexity of the chemical system of the atmosphere produced by NASA's GEOS modeling system with atmospheric chemistry. Shown is a sequence of modeled surface concentrations of 96 chemical species during the time period July 22, 2018 to October 2, 2018. These chemicals undergo rapid changes as they are being emitted by natural and anthropogenic activities, transported by prevailing winds and vertical lifting motions, deposited to the surface, or chemically transformed.
The visualization starts with a global map of model predicted concentrations of surface ozone, a potent air pollutant that is chemically produced from hydrocarbons and nitrogen oxides under the presence of sunlight. Consequently, the highest concentrations of surface ozone can be found during daytime close to urban areas and in the vicinity of forest fires (e.g., Africa). At night, ozone is chemically destroyed in highly polluted environments, leading to very low nighttime concentrations over industrial areas such as Eastern China. These processes are captured in detail by NASA’s GEOS composition forecast (CF) system, which incorporates the latest scientific understanding of the physics and chemistry that guide the formation of ozone, along with measurements from satellites and other instrument platforms. A particular feature of the model system used here is its comprehensive representation of atmospheric chemistry using the GEOS-Chem chemistry model, capturing 240 gaseous species that react with each other via 725 chemical reactions. Directly or indirectly, all of these species impact the formation of ozone. The visualization shows snapshots of modeled concentrations of 96 of the most important chemical compounds, loosely grouped into seven ‘families’ based on their physical and chemical properties.
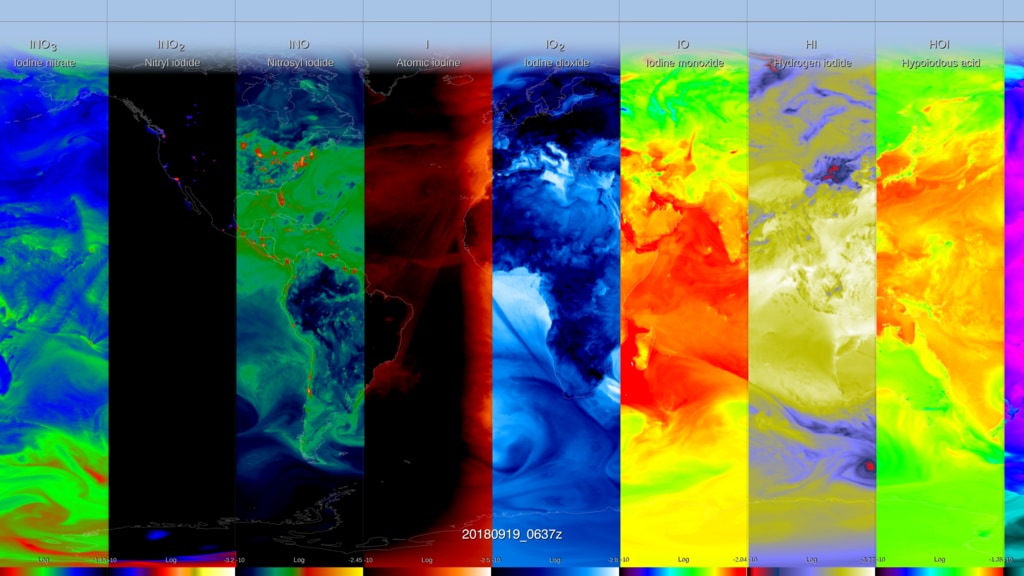
Very tightly linked to ozone is the hydrogen oxides “HOx” family. It contains the highly reactive hydroxyl radical, OH, which plays a prominent role in atmospheric chemistry due to its role as a ‘cleansing agent’ of the atmosphere. The abundance of OH, which is subject to the availability of water vapor and sunlight, in turn directly impacts the atmospheric lifetime of hydrocarbons such as methane and carbon monoxide. Human activities constitute an important source for both of these gases (beside natural sources) and directly influence the long-term concentration trends of these pollutants, as can be directly observed from NASA satellites. Another related group of chemicals are hydrocarbons from biogenic activity: “Isoprene oxidation”. Plants emit hundreds of (structurally similar) compounds, with isoprene being the most important one. These compounds rapidly react with each other through a complex cascade of reactions, which makes the chemistry over vegetation-rich areas such as rain forests or the Southeast US challenging to simulate. Biogenic compounds also play an important role for the formation of aerosols: tiny particles that can constitute a major health risk when inhaled. The abundance and composition of aerosol particles is highly variable and is influenced by anthropogenic activities (e.g., soot from biofuel burning) as well as natural events, such as wildfires, dust storms, volcanic eruptions, and sea spray. The ocean is also a source of another group of chemicals, the halogens. These species tend to be highly reactive and can effectively destroy ozone, especially over remote areas. The last chemical group depicted in the visualization is related to nitrogen. Nitrogen oxides are central to atmospheric chemistry in general and ozone formation in particular. At the surface, the most important source of nitrogen dioxide (NO2) is the combustion of fossil fuels. As a result, NO2 concentrations are highest over urban areas (e.g. highways, power plants) and along ship routes.
The visualization ends back at the beginning with ozone, illustrating the connectiveness of the chemical system of the atmosphere. Given the complexity of atmospheric chemistry, computer simulations – such as those by the NASA GEOS composition forecasting system – are an essential tool to understanding the formation of air pollution and to help formulate effective mitigation strategies.
Here's a list of each of the chemical species shown and their groupings (ppbV=pars per billion by volume):
The Complex Chemistry of Surface Ozone Depicted in a New GEOS Simulation
The visualization starts with a global map of model predicted concentrations of surface ozone, a potent air pollutant that is chemically produced from hydrocarbons and nitrogen oxides under the presence of sunlight. Consequently, the highest concentrations of surface ozone can be found during daytime close to urban areas and in the vicinity of forest fires (e.g., Africa). At night, ozone is chemically destroyed in highly polluted environments, leading to very low nighttime concentrations over industrial areas such as Eastern China. These processes are captured in detail by NASA’s GEOS composition forecast (CF) system, which incorporates the latest scientific understanding of the physics and chemistry that guide the formation of ozone, along with measurements from satellites and other instrument platforms. A particular feature of the model system used here is its comprehensive representation of atmospheric chemistry using the GEOS-Chem chemistry model, capturing 240 gaseous species that react with each other via 725 chemical reactions. Directly or indirectly, all of these species impact the formation of ozone. The visualization shows snapshots of modeled concentrations of 96 of the most important chemical compounds, loosely grouped into seven ‘families’ based on their physical and chemical properties.
Very tightly linked to ozone is the hydrogen oxides “HOx” family. It contains the highly reactive hydroxyl radical, OH, which plays a prominent role in atmospheric chemistry due to its role as a ‘cleansing agent’ of the atmosphere. The abundance of OH, which is subject to the availability of water vapor and sunlight, in turn directly impacts the atmospheric lifetime of hydrocarbons such as methane and carbon monoxide. Human activities constitute an important source for both of these gases (beside natural sources) and directly influence the long-term concentration trends of these pollutants, as can be directly observed from NASA satellites. Another related group of chemicals are hydrocarbons from biogenic activity: “Isoprene oxidation”. Plants emit hundreds of (structurally similar) compounds, with isoprene being the most important one. These compounds rapidly react with each other through a complex cascade of reactions, which makes the chemistry over vegetation-rich areas such as rain forests or the Southeast US challenging to simulate. Biogenic compounds also play an important role for the formation of aerosols: tiny particles that can constitute a major health risk when inhaled. The abundance and composition of aerosol particles is highly variable and is influenced by anthropogenic activities (e.g., soot from biofuel burning) as well as natural events, such as wildfires, dust storms, volcanic eruptions, and sea spray. The ocean is also a source of another group of chemicals, the halogens. These species tend to be highly reactive and can effectively destroy ozone, especially over remote areas. The last chemical group depicted in the visualization is related to nitrogen. Nitrogen oxides are central to atmospheric chemistry in general and ozone formation in particular. At the surface, the most important source of nitrogen dioxide (NO2) is the combustion of fossil fuels. As a result, NO2 concentrations are highest over urban areas (e.g. highways, power plants) and along ship routes.
The visualization ends back at the beginning with ozone, illustrating the connectiveness of the chemical system of the atmosphere. Given the complexity of atmospheric chemistry, computer simulations – such as those by the NASA GEOS composition forecasting system – are an essential tool to understanding the formation of air pollution and to help formulate effective mitigation strategies.
Here's a list of each of the chemical species shown and their groupings (ppbV=pars per billion by volume):
Used Elsewhere In
Visualization Credits
Greg Shirah (NASA/GSFC): Lead Visualizer
Christoph A. Keller (USRA): Lead Scientist
K. Emma Knowland (USRA): Scientist
Steven Pawson (NASA/GSFC): Scientist
Trent L. Schindler (USRA): Visualizer
Christoph A. Keller (USRA): Lead Scientist
K. Emma Knowland (USRA): Scientist
Steven Pawson (NASA/GSFC): Scientist
Trent L. Schindler (USRA): Visualizer
Please give credit for this item to:
NASA's Scientific Visualization Studio
NASA's Scientific Visualization Studio
Short URL to share this page:
https://svs.gsfc.nasa.gov/4754
Data Used:
Note: While we identify the data sets used in these visualizations, we do not store any further details nor the data sets themselves on our site.
Keywords:
DLESE >> Atmospheric science
DLESE >> Chemistry
GCMD >> Earth Science >> Atmosphere >> Atmospheric Chemistry
SVS >> Hyperwall
NASA Science >> Earth
SVS >> Chemistry
GCMD keywords can be found on the Internet with the following citation: Olsen, L.M., G. Major, K. Shein, J. Scialdone, S. Ritz, T. Stevens, M. Morahan, A. Aleman, R. Vogel, S. Leicester, H. Weir, M. Meaux, S. Grebas, C.Solomon, M. Holland, T. Northcutt, R. A. Restrepo, R. Bilodeau, 2013. NASA/Global Change Master Directory (GCMD) Earth Science Keywords. Version 8.0.0.0.0
https://svs.gsfc.nasa.gov/4754
Data Used:
GEOS Atmospheric Model
Model - NASA GMAO - 07/22/2018 through 10/02/2018Keywords:
DLESE >> Atmospheric science
DLESE >> Chemistry
GCMD >> Earth Science >> Atmosphere >> Atmospheric Chemistry
SVS >> Hyperwall
NASA Science >> Earth
SVS >> Chemistry
GCMD keywords can be found on the Internet with the following citation: Olsen, L.M., G. Major, K. Shein, J. Scialdone, S. Ritz, T. Stevens, M. Morahan, A. Aleman, R. Vogel, S. Leicester, H. Weir, M. Meaux, S. Grebas, C.Solomon, M. Holland, T. Northcutt, R. A. Restrepo, R. Bilodeau, 2013. NASA/Global Change Master Directory (GCMD) Earth Science Keywords. Version 8.0.0.0.0


