Earth
ID: 4627
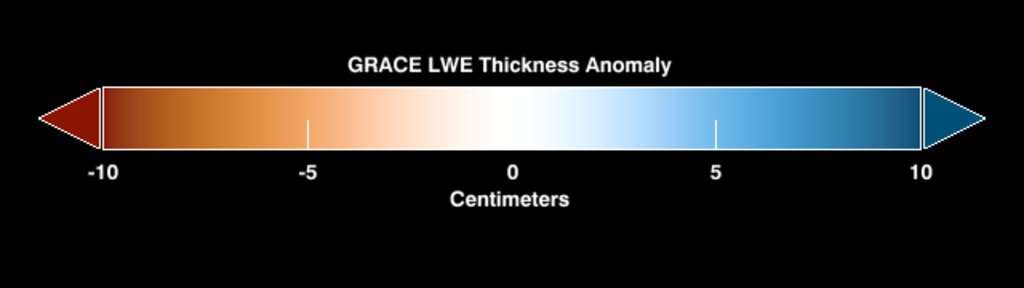
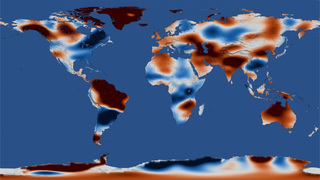
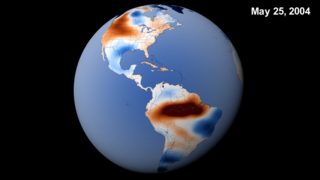
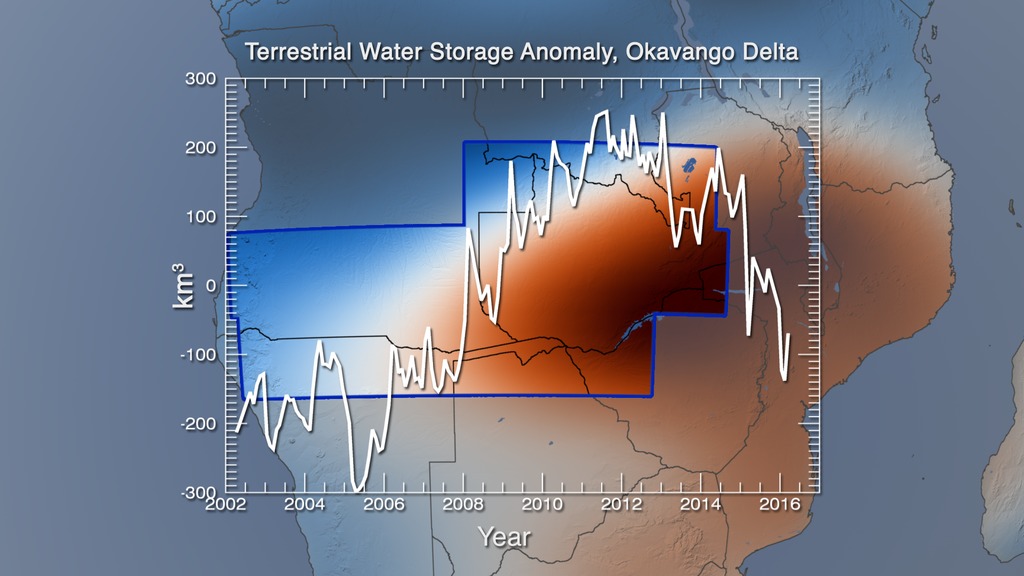
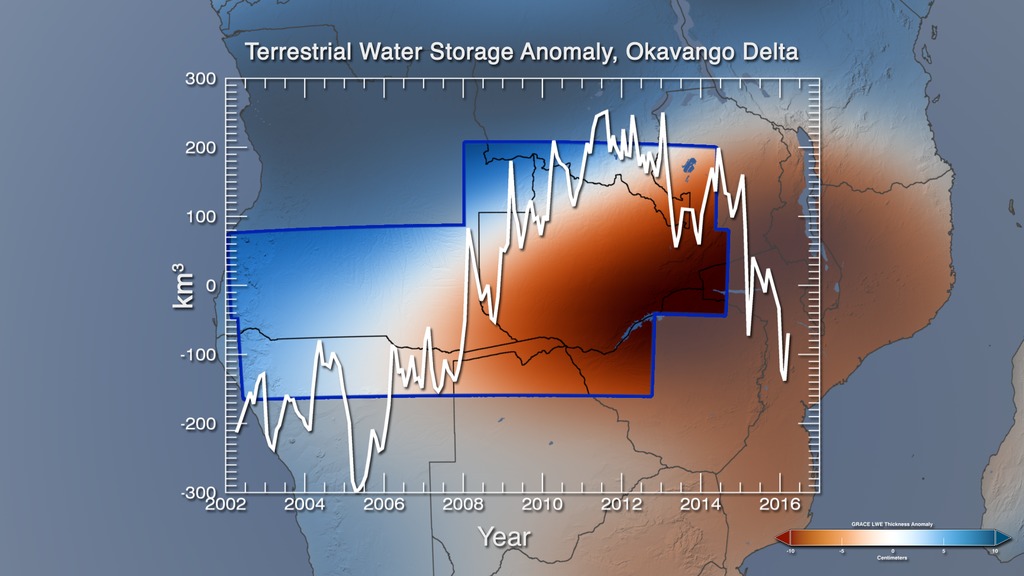
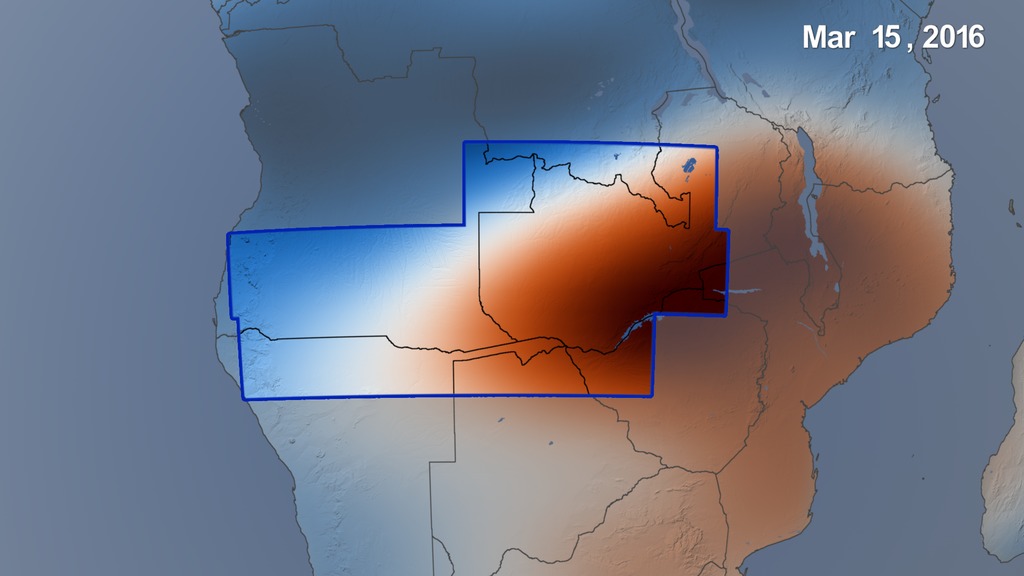
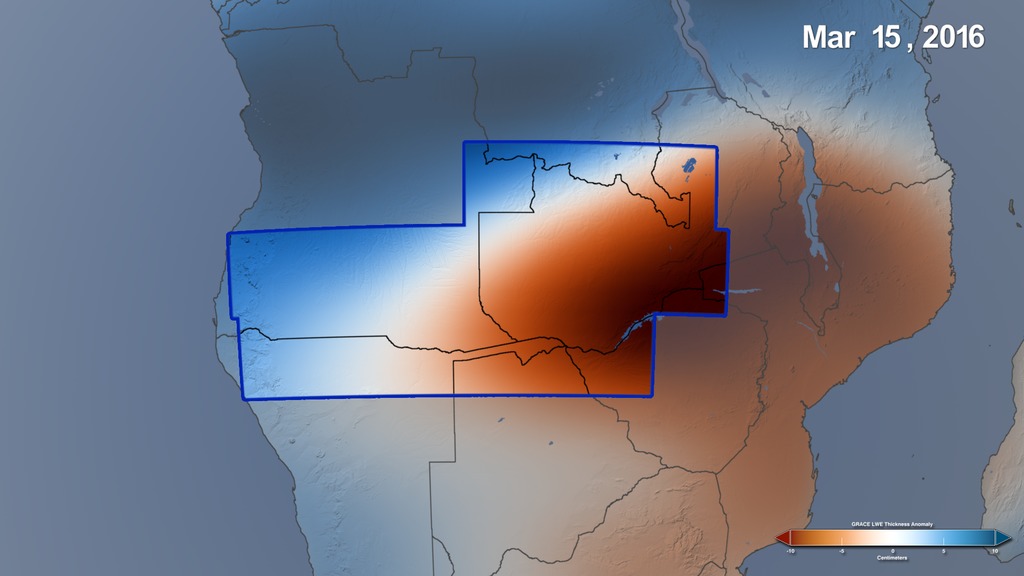
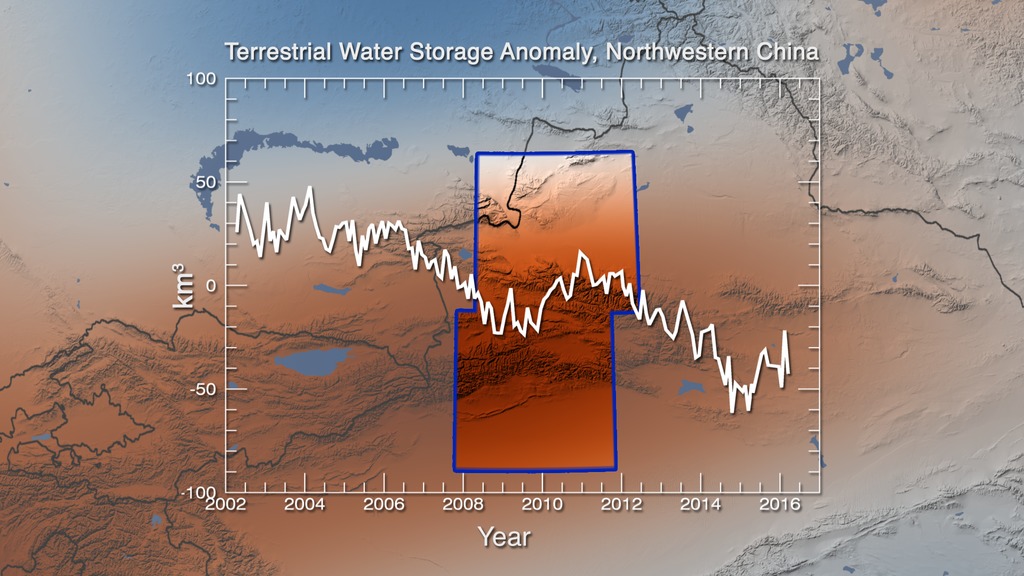
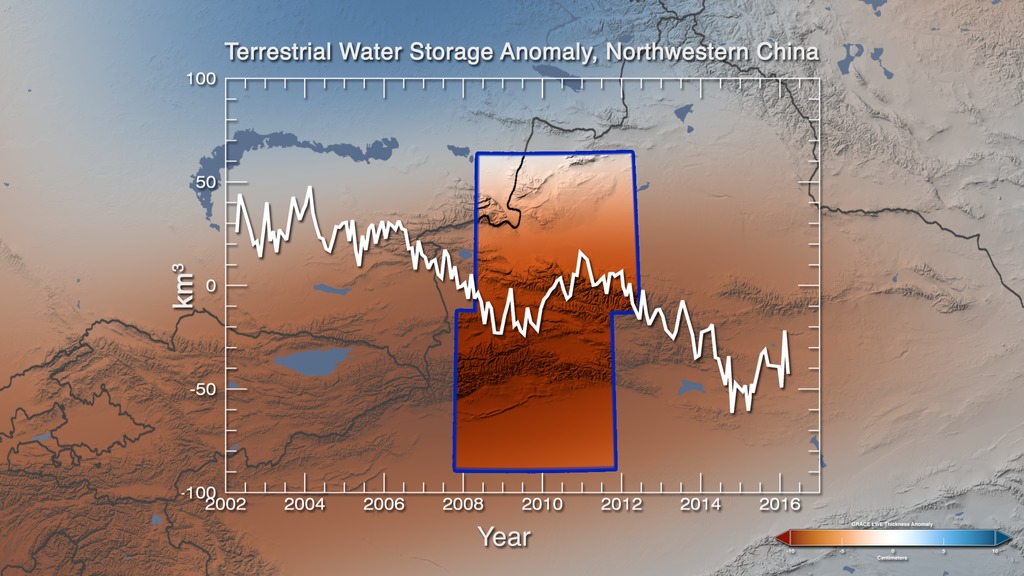
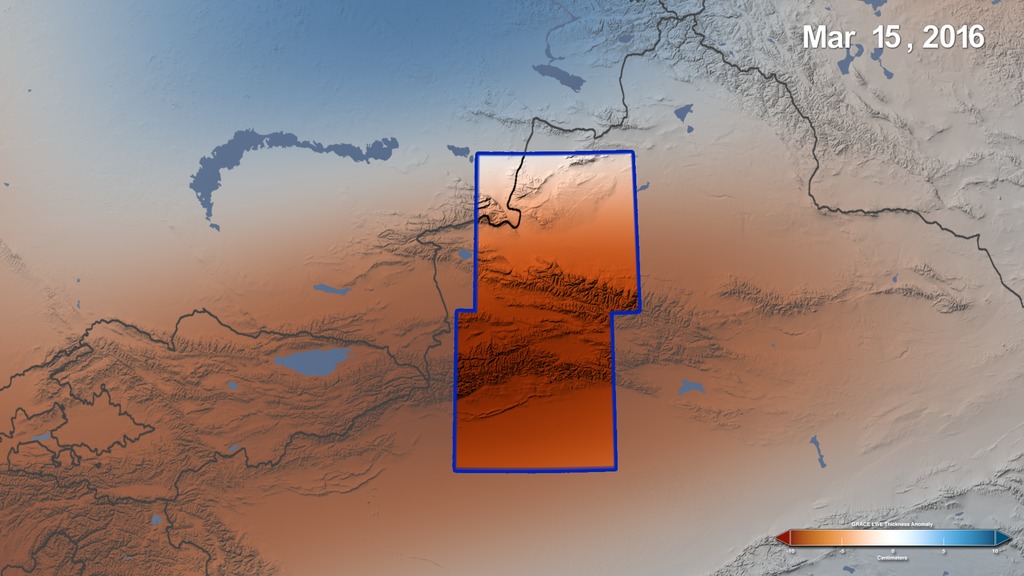
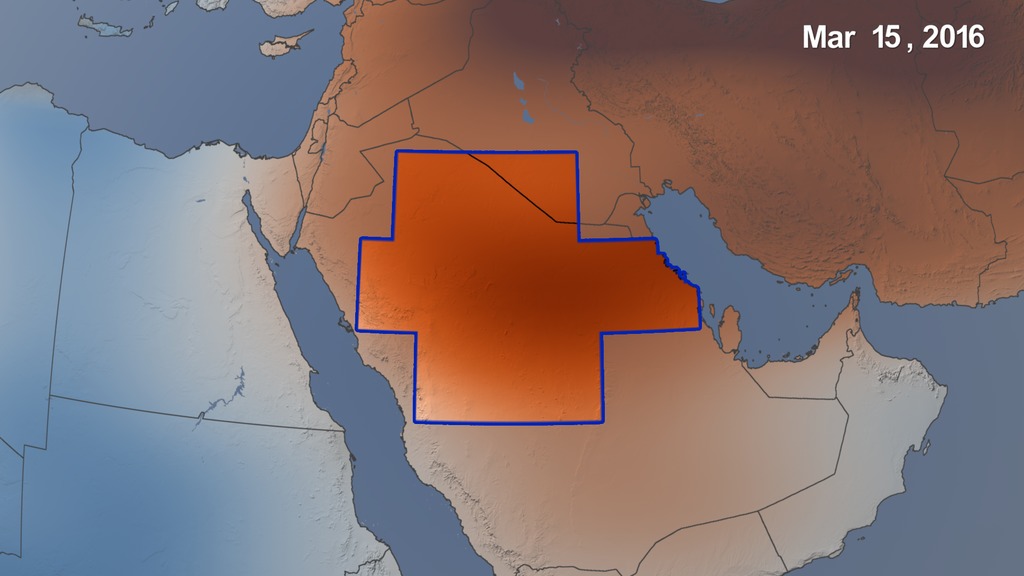
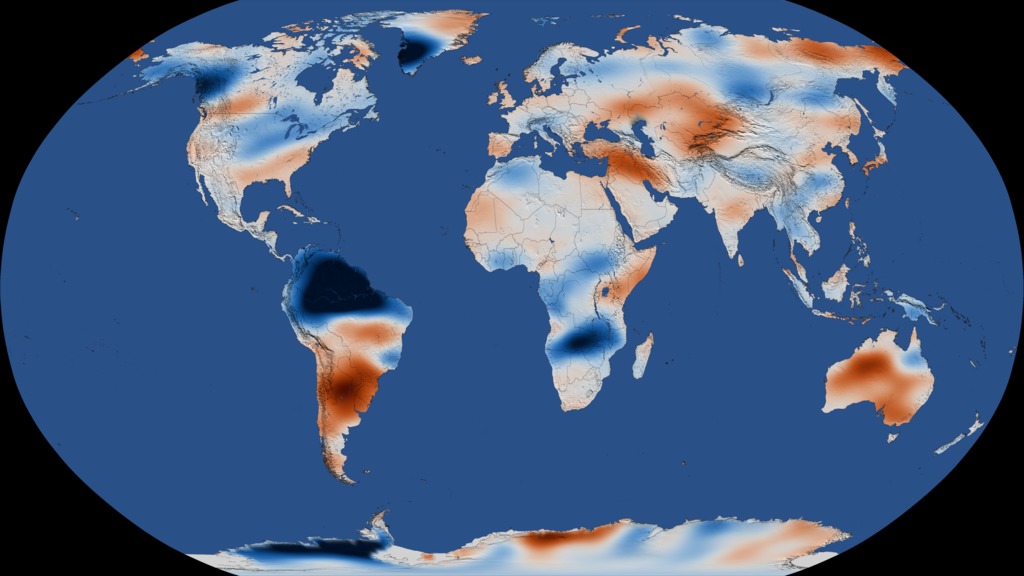
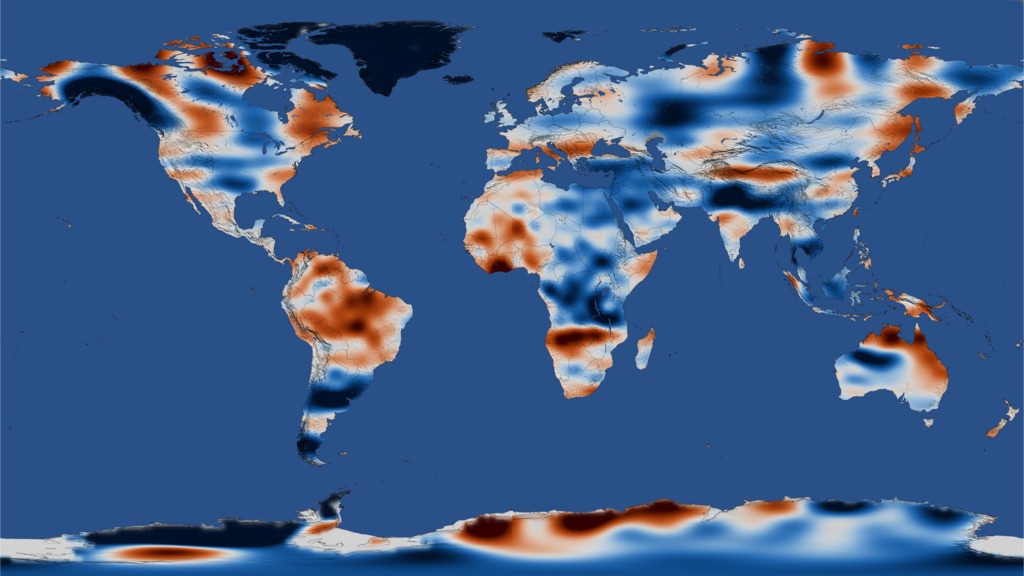
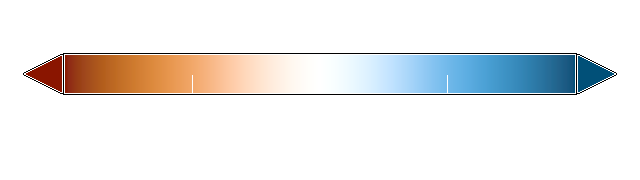
NASA scientists used GRACE data to identify regional trends of freshwater movement, and combined that information with data from other satellites, climate models and precipitation measurements to determine the causes of major regional trends in freshwater storage. In these visualizations, the colors represent liquid water equivalent thinckness, while the animated graph overlay represents the terrestrial water storage anomaly.

GRACE 15-Year Groundwater Trends
Used Elsewhere In
Visualization Credits
Trent L. Schindler (USRA): Lead Visualizer
Kathryn Mersmann (USRA): Lead Producer
Ellen T. Gray (ADNET Systems, Inc.): Lead Writer
Matthew Rodell (NASA/GSFC): Lead Scientist
Kathryn Mersmann (USRA): Lead Producer
Ellen T. Gray (ADNET Systems, Inc.): Lead Writer
Matthew Rodell (NASA/GSFC): Lead Scientist
Please give credit for this item to:
NASA's Scientific Visualization Studio
NASA's Scientific Visualization Studio
Short URL to share this page:
https://svs.gsfc.nasa.gov/4627
Data Used:
Note: While we identify the data sets used in these visualizations, we do not store any further details nor the data sets themselves on our site.
Keywords:
SVS >> HDTV
GCMD >> Earth Science
SVS >> Hyperwall
SVS >> GRACE
NASA Science >> Earth
NASA Earth Science Focus Areas >> Water and Energy Cycle
NASA Earth Science Focus Areas >> Earth Surface and Interior
GCMD keywords can be found on the Internet with the following citation: Olsen, L.M., G. Major, K. Shein, J. Scialdone, S. Ritz, T. Stevens, M. Morahan, A. Aleman, R. Vogel, S. Leicester, H. Weir, M. Meaux, S. Grebas, C.Solomon, M. Holland, T. Northcutt, R. A. Restrepo, R. Bilodeau, 2013. NASA/Global Change Master Directory (GCMD) Earth Science Keywords. Version 8.0.0.0.0
https://svs.gsfc.nasa.gov/4627
Data Used:
Gravity Recovery and Climate Experiment (GRACE)
Terra and Aqua/MODIS/Blue Marble: Next Generation also referred to as: BMNG
Credit:
The Blue Marble data is courtesy of Reto Stockli (NASA/GSFC).
The Blue Marble data is courtesy of Reto Stockli (NASA/GSFC).
Keywords:
SVS >> HDTV
GCMD >> Earth Science
SVS >> Hyperwall
SVS >> GRACE
NASA Science >> Earth
NASA Earth Science Focus Areas >> Water and Energy Cycle
NASA Earth Science Focus Areas >> Earth Surface and Interior
GCMD keywords can be found on the Internet with the following citation: Olsen, L.M., G. Major, K. Shein, J. Scialdone, S. Ritz, T. Stevens, M. Morahan, A. Aleman, R. Vogel, S. Leicester, H. Weir, M. Meaux, S. Grebas, C.Solomon, M. Holland, T. Northcutt, R. A. Restrepo, R. Bilodeau, 2013. NASA/Global Change Master Directory (GCMD) Earth Science Keywords. Version 8.0.0.0.0


