Sun
ID: 4167
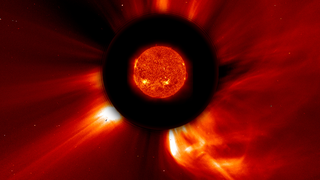
July of 2012 witnessed the eruption of a very large and fast solar coronal mass ejection (CME) (see NASA STEREO Observes One of the Fastest CMEs On Record and Carrington-class CME Narrowly Misses Earth ). While not directed at Earth, it was sufficiently large that it could have seriously disrupted the global electrical infrastructure. The event did impact STEREO-A of NASA's heliophysics fleet which provided a host of measurements (see Sentinels of the Heliosphere).
One of the conditions which contributed to the high speed of this event is that two smaller CMEs were launched a little earlier, and these events cleared out much of the solar wind material, leaving little to slow the outflow of the July 23 event (UTC).
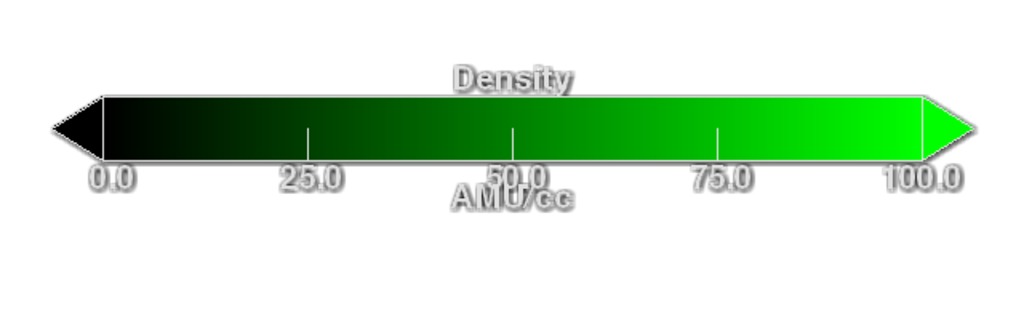
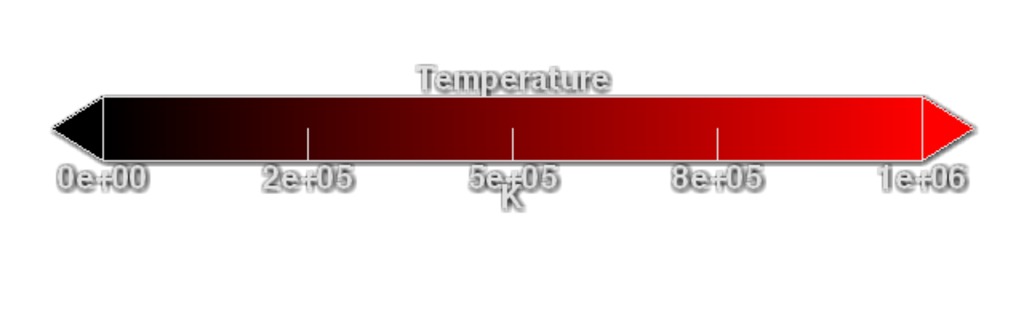
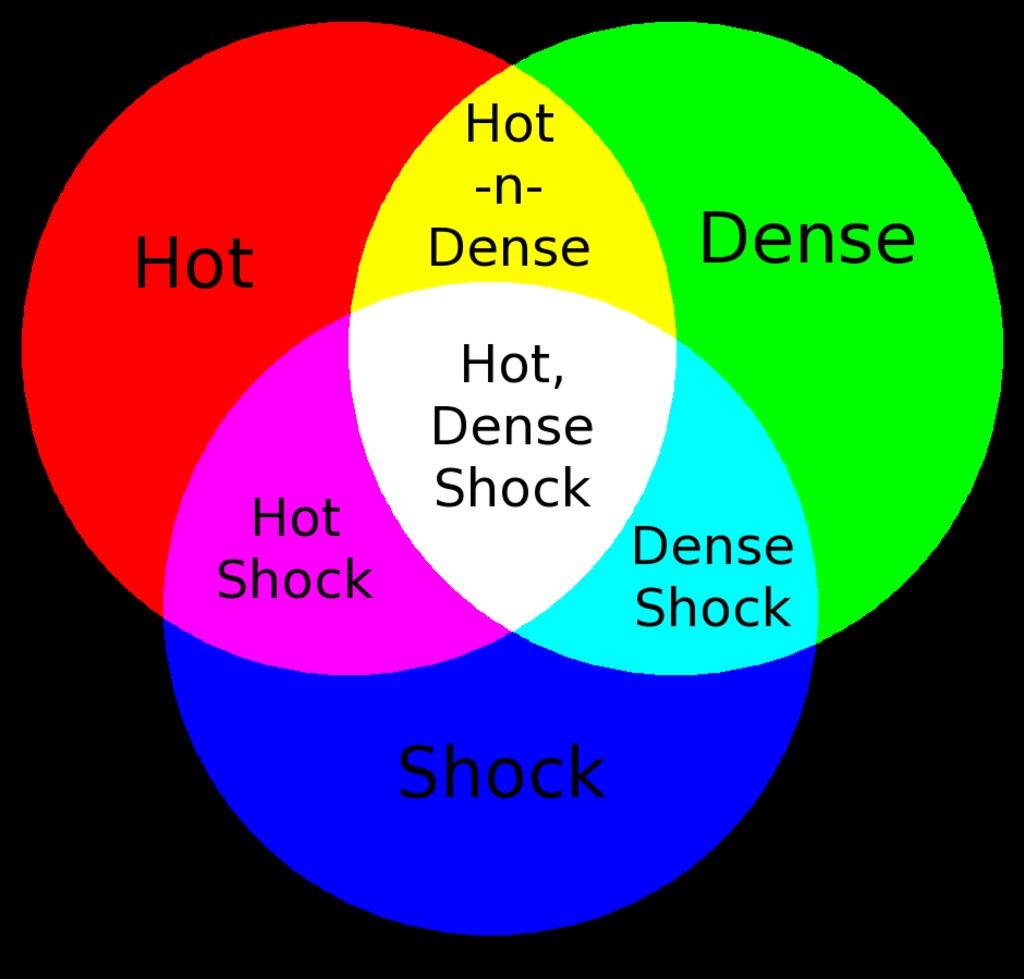
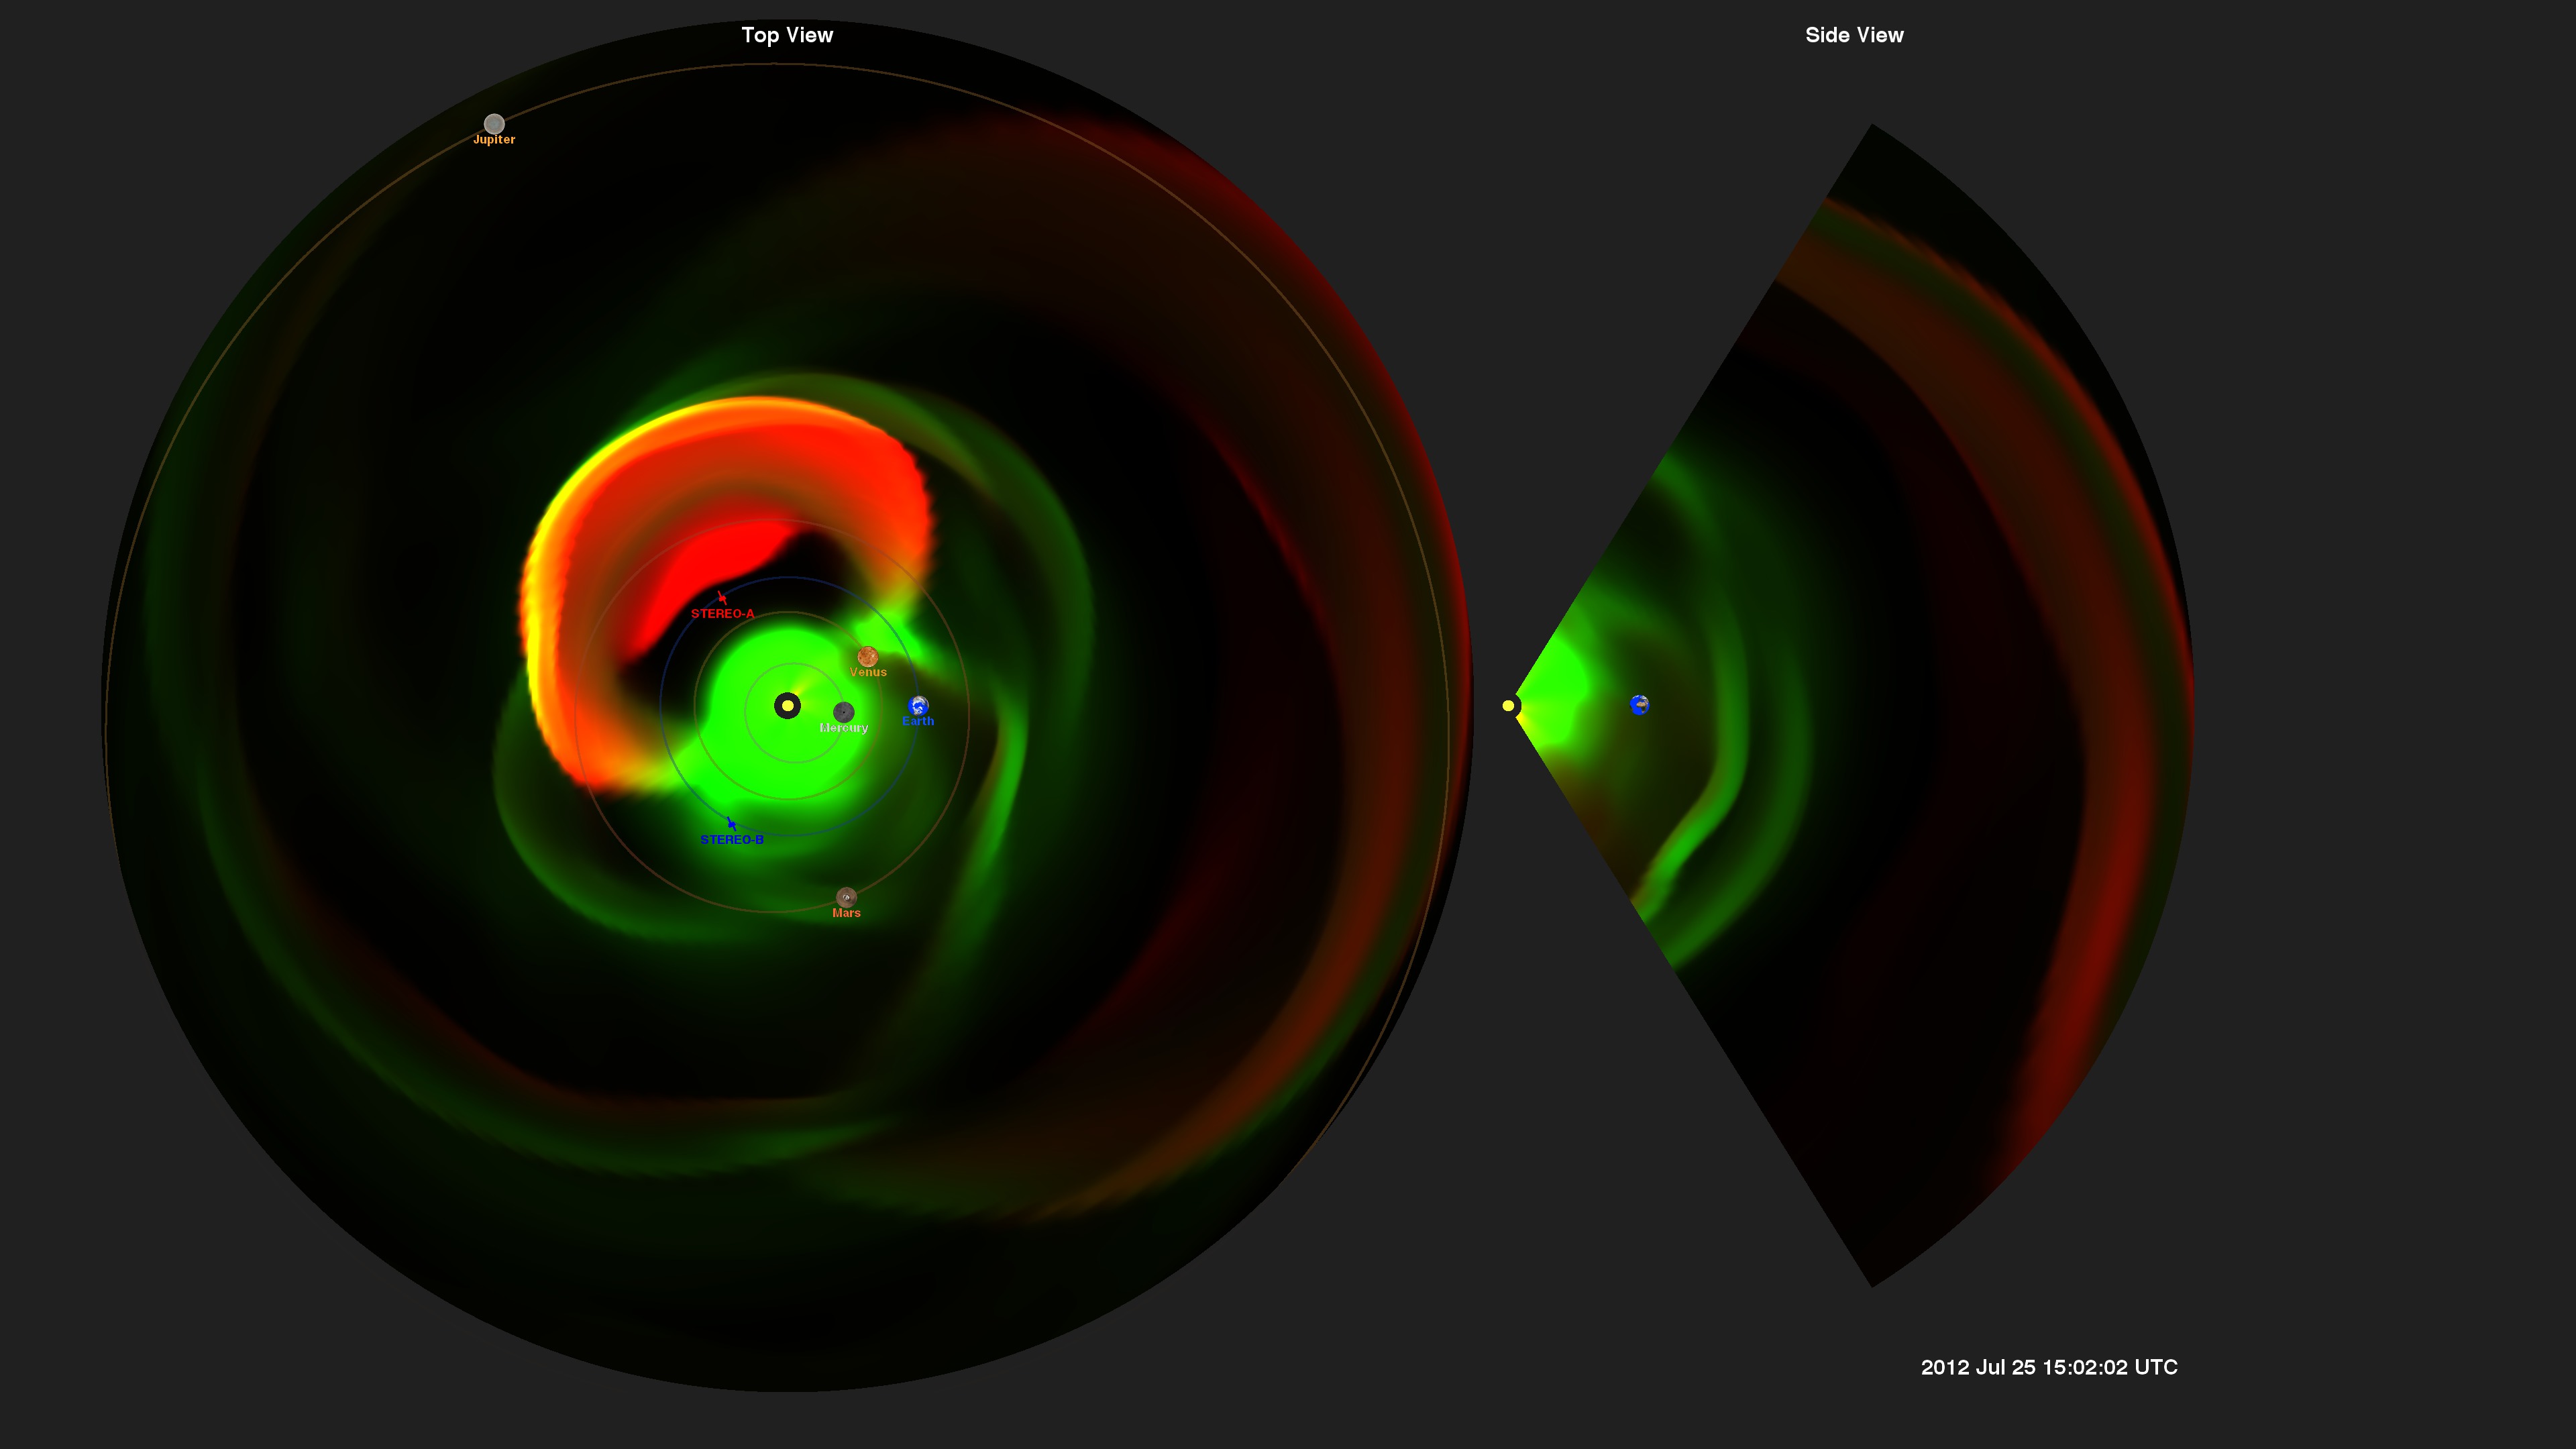
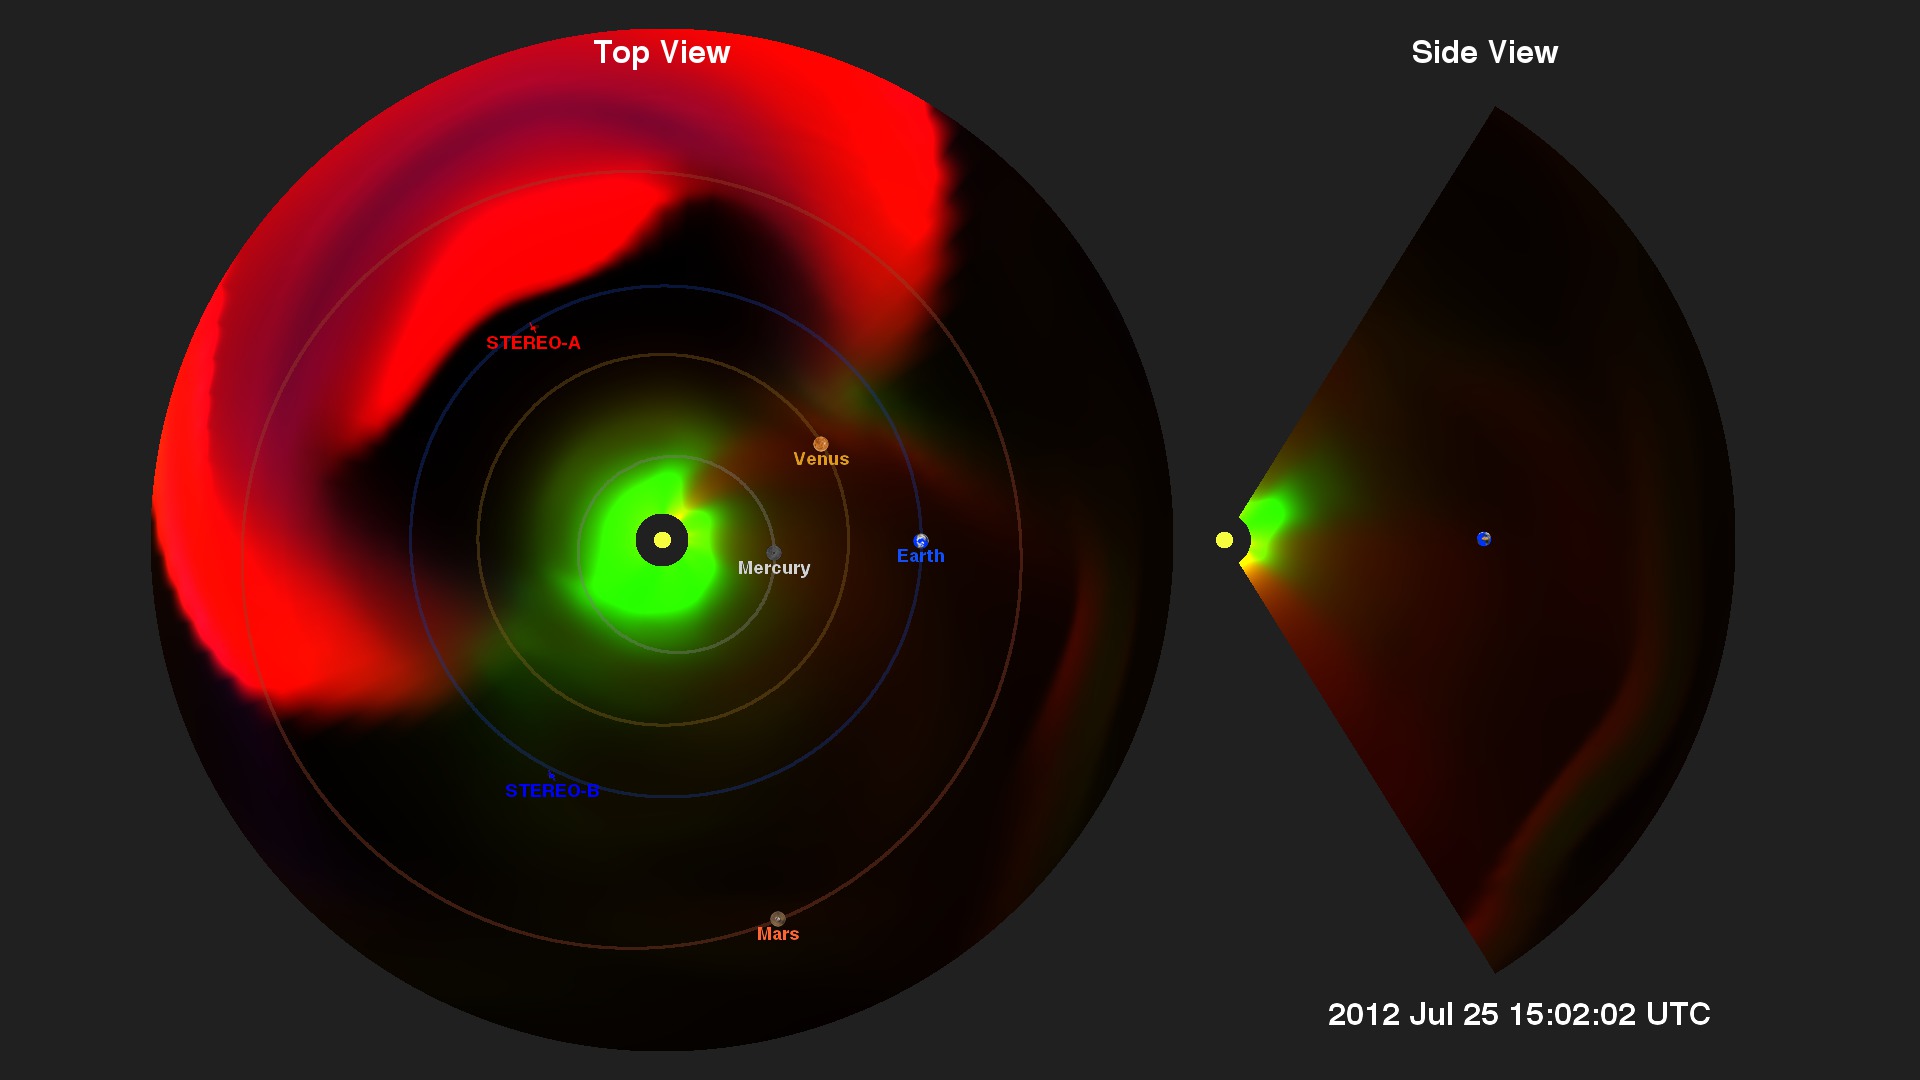
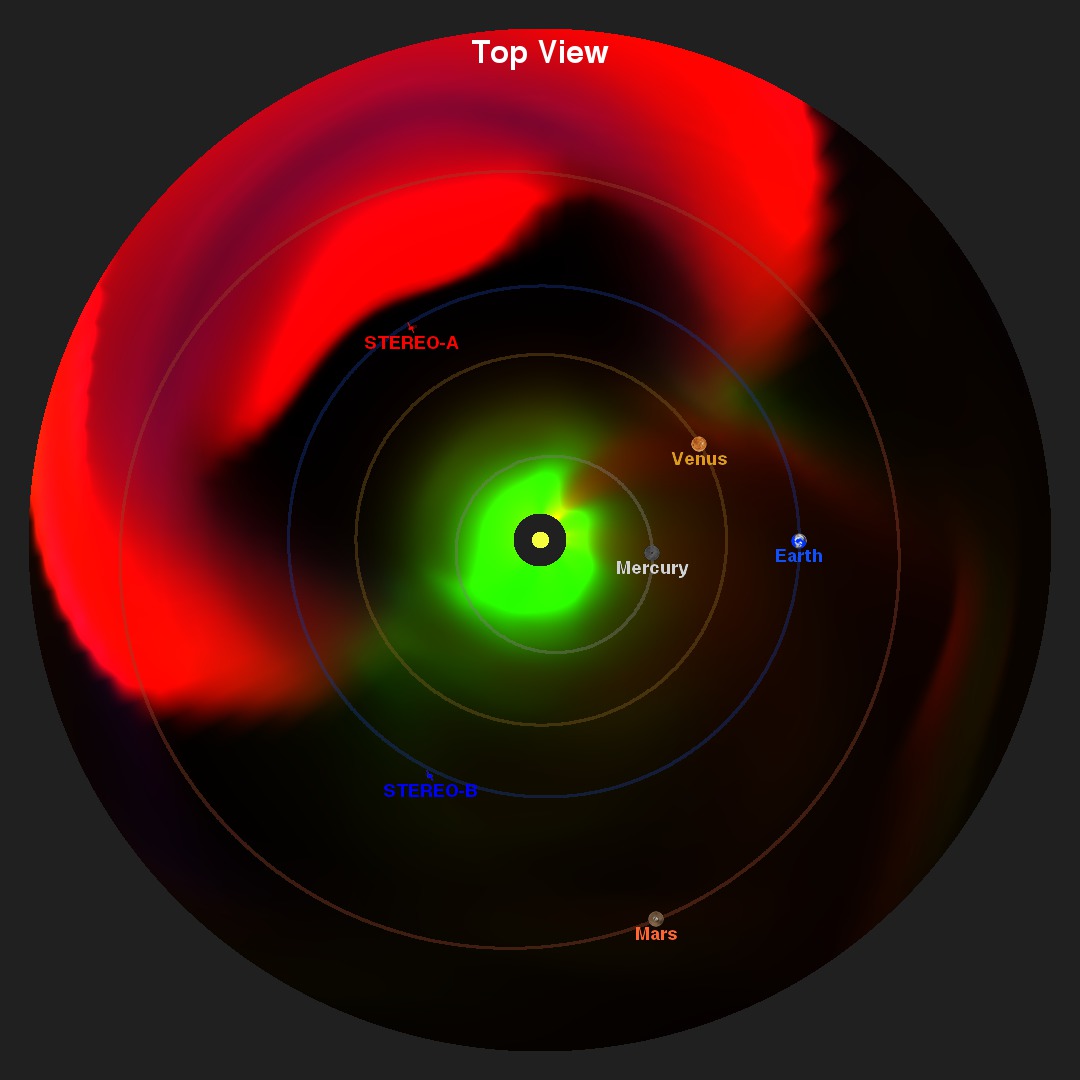
In the visualizations below, generated from the Enlil space weather model, green represents particle density, usually protons and other ions. In green, we see the Parker spiral moving out from the sun generated by the sun's current sheet (Wikipedia). Red represents particles at high temperatures and shows the CME is hotter than the usual solar wind flow. Large changes in density are represented in blue. These three colors sometimes combine to tell us more about the characteristics of the event (noted in the 3-color Venn diagram below).
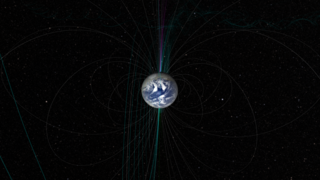
However, if this CME had struck Earth's magnetosphere, which has a much stronger magnetic field, the changing magnetic field would induce much larger voltages in systems with long electrical conductors, such as power lines that run over long distances. These significantly higher voltages can damage power transformers.

The Big CME that Missed Earth
One of the conditions which contributed to the high speed of this event is that two smaller CMEs were launched a little earlier, and these events cleared out much of the solar wind material, leaving little to slow the outflow of the July 23 event (UTC).
In the visualizations below, generated from the Enlil space weather model, green represents particle density, usually protons and other ions. In green, we see the Parker spiral moving out from the sun generated by the sun's current sheet (Wikipedia). Red represents particles at high temperatures and shows the CME is hotter than the usual solar wind flow. Large changes in density are represented in blue. These three colors sometimes combine to tell us more about the characteristics of the event (noted in the 3-color Venn diagram below).
However, if this CME had struck Earth's magnetosphere, which has a much stronger magnetic field, the changing magnetic field would induce much larger voltages in systems with long electrical conductors, such as power lines that run over long distances. These significantly higher voltages can damage power transformers.
Related
For More Information
Visualization Credits
Tom Bridgman (Global Science and Technology, Inc.): Lead Animator
Dusan Odstrcil (George Mason University): Scientist
M. Leila Mays (Catholic University of America): Scientist
Janet G. Luhmann (University of California at Berkeley): Scientist
Laurence Schuler (ADNET Systems, Inc.): Project Support
Ian Jones (ADNET Systems, Inc.): Project Support
Dusan Odstrcil (George Mason University): Scientist
M. Leila Mays (Catholic University of America): Scientist
Janet G. Luhmann (University of California at Berkeley): Scientist
Laurence Schuler (ADNET Systems, Inc.): Project Support
Ian Jones (ADNET Systems, Inc.): Project Support
Short URL to share this page:
https://svs.gsfc.nasa.gov/4167
Mission:
STEREO
Data Used:
Note: While we identify the data sets used in these visualizations, we do not store any further details nor the data sets themselves on our site.
This item is part of these series:
Space Weather Modeling
The Carrington-Class CME of 2012
Keywords:
SVS >> Solar Wind
GCMD >> Earth Science >> Sun-earth Interactions >> Solar Activity >> Solar Flares
SVS >> Space Weather
SVS >> Hyperwall
SVS >> Heliophysics
SVS >> STEREO
SVS >> Corona
NASA Science >> Sun
GCMD >> Earth Science >> Sun-earth Interactions >> Solar Activity >> Coronal Mass Ejections
GCMD keywords can be found on the Internet with the following citation: Olsen, L.M., G. Major, K. Shein, J. Scialdone, S. Ritz, T. Stevens, M. Morahan, A. Aleman, R. Vogel, S. Leicester, H. Weir, M. Meaux, S. Grebas, C.Solomon, M. Holland, T. Northcutt, R. A. Restrepo, R. Bilodeau, 2013. NASA/Global Change Master Directory (GCMD) Earth Science Keywords. Version 8.0.0.0.0
Places you might have seen this:
Appeared on "The Today Show", July 26, 2014
https://svs.gsfc.nasa.gov/4167
Mission:
STEREO
Data Used:
Enlil Heliospheric Model also referred to as: Enlil Heliospheric Model
Model - Community Coordinated Modeling Center (CCMC)
MHD solar wind simulation
JPL DE421 also referred to as: DE421
Ephemeris - NASA/JPL
Planetary ephemerides
This item is part of these series:
Space Weather Modeling
The Carrington-Class CME of 2012
Keywords:
SVS >> Solar Wind
GCMD >> Earth Science >> Sun-earth Interactions >> Solar Activity >> Solar Flares
SVS >> Space Weather
SVS >> Hyperwall
SVS >> Heliophysics
SVS >> STEREO
SVS >> Corona
NASA Science >> Sun
GCMD >> Earth Science >> Sun-earth Interactions >> Solar Activity >> Coronal Mass Ejections
GCMD keywords can be found on the Internet with the following citation: Olsen, L.M., G. Major, K. Shein, J. Scialdone, S. Ritz, T. Stevens, M. Morahan, A. Aleman, R. Vogel, S. Leicester, H. Weir, M. Meaux, S. Grebas, C.Solomon, M. Holland, T. Northcutt, R. A. Restrepo, R. Bilodeau, 2013. NASA/Global Change Master Directory (GCMD) Earth Science Keywords. Version 8.0.0.0.0
Places you might have seen this:
Appeared on "The Today Show", July 26, 2014


